Using Maximum Entropy Models to Discriminate between Similar
Languages and Varieties
Jordi PortaandJos´e-Luis Sancho
Departamento de Tecnolog´ıa y Sistemas Centro de Estudios de la Real Academia Espa˜nola
c/ Serrano 187-189, 28002 Madrid
{porta,sancho}@rae.es
Abstract
DSLRAE is a hierarchical classifier for similar written languages and varieties based on maximum-entropy (maxent) classifiers. In the first level, the text is classified into a language group using a simple token-based maxent classifier. At the second level, a group-specific maxent classifier is applied to classify the text as one of the languages or varieties within the previously identified group. For each group of languages, the classifier uses a different kind and combination of knowledge-poor features: token or character n-grams and ‘white lists’ of tokens. Features were selected according to the results of applying ten-fold cross-validation over the training dataset. The system presented in this article1has been ranked second in the Discriminating Similar
Lan-guage (DSL) shared task co-located within the VarDial Workshop at COLING 2014 (Zampieri et al., 2014).
1 Introduction
Language identification (LI) can be defined as the task of determining the language of a written text. LI is also a cross-cutting technology supporting many other text analysis tasks: sentiment analysis, political tendency or topic classification. There are some interesting problems around written language identification that have attracted some attention recently, as native language identification (NLI, Tetreault et al., 2013), the identification of the country of origin or the discrimination between similar or closely related languages (DSL, Tiedemann and Ljubeˇsi´c, 2012).
LI has reached a great success in discriminating between languages with unique character sets and lan-guages belonging to different language groups or typologically distant. However, according to Zampieri (2013), multilingualism, noisy or non-standard features in text and discrimination between similar lan-guages, varieties or dialects remain as the major known bottlenecks in language identification. For this reason, DSL can be considered as a sub-task in language identification. Interestingly enough, LI seems to work well with what Kloss (1967) calledabstandsprache or language by distance (because Basque is an isolate, it is generally regarded as a distant language) but fails in dealing withausbauspracheor language by development (a standard variety together with all varieties heteronomous with respect to it, e. g. Basque Batua koin´e and the various vernacular dialects).
Mass media, educational centres, administrations and communications favour standard languages in-stead of other varieties. Standard varieties of languages are then seen by sociolinguists and dialectologists as political and cultural constructs (Trudgill, 2004). However, languages and varieties are not just sys-tems for communication between individuals, they are also used by groups and they are a crucial part of their identity and culture. Language variation is systematic, both inter- and intra-personal. It can be related to political, social, geographical, situational, communicative or instrumental factors. Variation within a language can be found at different levels: alphabet, orthography (diacritics), word structure (syllable composition, morphology), lexical choice or even syntax. Similar or closely related languages often reflect a common origin and are members of a dialect continuum (Bloomfield, 1935).
1We wish to thank an anonimous reviewer for her valuable comments and suggestions.
This work is licensed under a Creative Commons Attribution 4.0 International Licence. Page numbers and proceedings footer are added by the organisers. Licence details:http://creativecommons.org/licenses/by/4.0/
Solutions to language identification are often based either on generative or discriminative character n-gram language models. While character-based methods provide a means to distinguish between differ-ent languages on the basis of coarse-grained statistics on n-grams, it seems that discriminating between similar languages needs more fine-grained distinctions not always reflected by n-gram character distribu-tions. According to Tiedemann and Ljubeˇsi´c (2012), character-based n-gram methods fail for languages with a high lexical overlap, since the more shared words between two languages, the more similar will their n-gram character frequency profiles be.
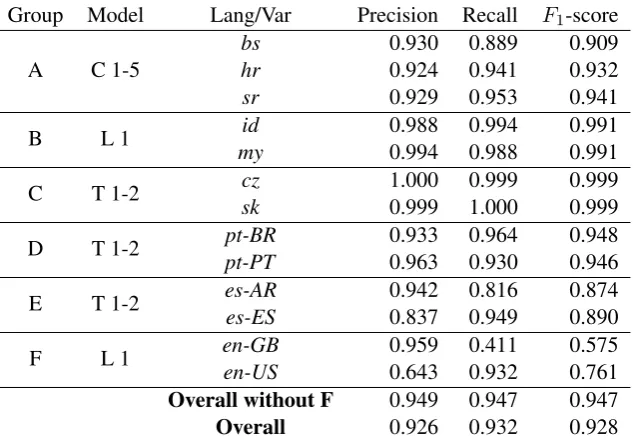
Group Model Lang/Var Precision Recall F1-score
A C 1-5 bshr 0.9300.924 0.8890.941 0.9090.932
sr 0.929 0.953 0.941
B L 1 myid 0.9880.994 0.9940.988 0.9910.991
C T 1-2 czsk 1.0000.999 0.9991.000 0.9990.999
D T 1-2 pt-BRpt-PT 0.9330.963 0.9640.930 0.9480.946
E T 1-2 es-ARes-ES 0.9420.837 0.8160.949 0.8740.890
[image:2.595.142.459.168.391.2]F L 1 en-GBen-US 0.9590.643 0.4110.932 0.5750.761 Overall without F 0.949 0.947 0.947 Overall 0.926 0.932 0.928
Table 1: Macro-averaged Precision, Recall andF1-score on the DSL training dataset resulting from 10-fold cross-validation using the best model for each group of languages o varieties. Model has a letter code indicating the kind of elements considered: C (characters), T (tokens), L (tokens from the list of the 10,000 most frequent tokens), and a number indicating how many consecutive elements have been taken in a feature: 1 (unigrams), 1-2 (unigrams and bigrams), 1-5 (sequences of length one to five).
2 Previous Approaches
Although focused on formal languages, Gold (1967) is usually credited as the first to attempt compu-tational language identification. In particular, two common LI approaches, namely n-gram language models and white (or black) lists, echo Gold’s information presentation methods. In the 1990s, language identification was formulated as a sub-task of text categorization and varied approaches were explored. Beesley (1988) pioneered the use of character n-grams models, which were also used by Dunning (1994) and Cavnar and Trenkle (1994). Grefenstette (1995) compared this approach to Ingle (1978), based on the frequency of short words. The interested reader is referred to Zampieri (2013) for a review of some statistical and machine learning proposals and to both Baldwin and Lui (2010) and Lui and Baldwin (2011) for an overview of some linguistically motivated models.
As Baldwin and Lui (2010) or Tiedemann and Ljubeˇsi´c (2012) point out, language identification is erroneously considered an easy and solved problem2, in part because of some general purpose systems
being available, notably TextCat3, Xerox Language Identifier4 and, more recently, langid.py (Lui
and Baldwin, 2012). While it is true that it is possible to obtain brilliant results for a small number of languages (Baldwin and Lui, 2010) or typologically distant languages (Zampieri et al., 2013), accurately discriminating among closely related languages or varieties of the same language has been repeatedly reported as a bottleneck for language identification systems, in particular for those based on n-grams.
2See McNamee (2005) eloquent title. 3http://odur.let.rug.nl/vannoord/TextCat
Back in 2004, Padr´o and Padr´o concluded that “since the tested systems tend to fail when distinguishing similar languages (e.g. Spanish and Catalan), further research could be done to solve these cases.” Martins and Silva (2005) report similar difficulties in discriminating among European and Brazilian Portuguese. Ranaivo-Malanc¸on (2006) motivates her work on the unsatisfactory performance of (then) available language identifiers when dealing with close languages such as Malay and Indonesian. Ljubeˇsi´c et al. (2007) do not even attempt to distinguish Bosnian from Croatian when developing a Croatian identifier because of their closeness. Trieschnigg et al. (2012) come as an exception as they report satisfactory results in identifying sixteen varieties of Dutch with TextCat.
Ranaivo-Malanc¸on (2006) presents a cascaded language identifier for Malay and Indonesian. It first distinguishes Malay or Indonesian from other four European languages using trigrams extracted from the most frequent words from each language. Texts classified as Malay or Indonesian are subsequently scanned for some linguistic features (format of numbers and exclusive words), yielding a more precise performance than TextCat.
Ljubeˇsi´c et al. (2007) also propose a cascaded identifier that relies on ‘black lists’ to discard non-Balkan languages and a second order Markov model on n-grams to discriminate among them, aug-mented with a ‘black list’ component that raises accuracy up to 0.99 when dealing with the most difficult pair (Croatian and Serbian). This work is followed up in Tiedemann and Ljubeˇsi´c (2012) where 9% of improvement over standard approaches is reported and where support for Bosnian discrimination is included.
Huang and Lee (2008) use a bag of the most frequent words to build a voting identifier for three Chi-nese varieties with a top accuracy of 0.929. More recently, Zampieri (2013) compares the performance of n-gram based models to machine learning methods using bag of words when discriminating similar languages and varieties obtaining comparable performance with both approaches.
Grouin et al. (2010) present the shared task DEFT 2010. Participants were challenged to identify the decade, country (France and Canada) and newspaper for a set of journalistic texts. As far as the country labeling is concerned, they report an upper 0.964F1-measure and an average of 0.767. Very brief descriptions of the systems are also offered.
Zampieri and Gebre (2012) present a log-likelihood estimation method for language models built on orthographical (character n-grams), lexical (word unigrams) and lexico-syntactic (word bigrams) fea-tures. They report a 0.998 accuracy distinguishing European and Brazilian Portuguese with a language model based on character 4-grams. This approach is adapted in Zampieri et al. (2013) to deal with Span-ish varieties, where the role of knowledge-rich features (POS tags) is also explored. They report a 0.99 accuracy when binarily distinguishing Argentinean and Mexican Spanish with single words or bigrams. Trieschnigg et al. (2012) compare the performance of TextCat to the nearest neighbour and nearest prototype in combination with a cosine distance when distinguishing among sixteen varieties of Dutch. They report a micro-average F1-score of 0.799 (and a macro-average F1-score of 0.527) with a top
F1-score of 0.987 when dealing with Frisian.
Lui and Cook (2013) report experiments with different classifiers to map English documents to their country of origin. An SVM classifier with bag of words is top ranked with a macro-average 0.911F1 -score in a cross-domain setting and 0.975 in an in-domain setting.
All these previous works (with the sole exception of Trieschnigg et al. (2012), where a general purpose LI system yields a satisfactory performance) agree in the specificity of DSL regarding LI. Maybe because of that, two level approaches are not uncommon. Features used to discriminate seem to be language-group specific, altough word rather than character features seem to perform better (Zampieri and Gebre (2012) report best results for character 4-grams, however, given that European and Brazilian Portuguese do not completely share ortography).
3 Maximum Entropy Models and Feature Engineering
Maximum Entropy techniques and the more general framework of Random Fields have been applied extensively to natural language processing problems, where maxent classifiers are commonly used as an alternative to Na¨ıve Bayes classifiers. In maxent modelling, the probability that an example xis in a classcis estimated from its bag of words (or n-grams) as:
p(c|x) = Z1 exp X
y∈bow(x)
N
X
i=1
wci·fi(c, y)
where fi(c, y) are indicator functions, wci is the weight assigned to feature i in class c, and Z is a
normalization factor. Features are modelled by indicator functionsfi(c, y), which are evaluated to one
when the featureifor a particular classcis true for a wordyand zero otherwise. The following is an example of an indicator function modelling the presence of a particular word in a class:
f1(c, y) =
1, c=en-GB∧y=‘colour’
0, otherwise The class assigned to an examplexis the most probable one:
ˆ
c= arg max
c∈C p(c|x)
The maxent classifiers are implemented with the toolkit of Zhang Le (2004), and the parameters of the model are estimated using Generalized Iterative Scaling (Darroch and Ratcli, 1972).
Having chosen a closed approach to the DSL shared task, no other resources than the text samples given as training and development datasets have been used in features design. In this knowledge-poor approach to the problem, the maxent classifier has been trained with token and character n-gram features. Character-based features are obtained with a simple character tokenizer. However, for token-based fea-tures, texts are tokenized using an orthographic tokenizer which splits punctuation from words. Several bags of features have been considered during the experiments: single tokens (T1), single words from the list of the 10,000 most frequent tokens (L1), token bigrams (T2), and n-grams of character sequences of length from one to five (C1-5). We will also refer to the lists of the 10,000 most frequent words as ‘white list’, which have a complementary role to the ‘black lists’ of Tiedemann and Ljubeˇsi´c (2012).
To determine which features are best suited to each group, we measured their performance using ten-fold cross-validation on the training dataset and using the development dataset for testing. For group A, best results were obtained using bag of features consisting of variable length character n-grams ranging from one to five (C1-5). On group B, token bigrams (T2) performed slightly better in the development set than in the training set than the ‘white list’ of tokens (L1), which seems to indicate a better general-isation of the former on unseen examples. Results for group C were similar for all features considered. Regarding groups D and E, token-based features got similar results, with slightly better results for token bigrams. Finally, for English (group F) results were generally bad, reaching the ‘white list’ the better results. Group F is known to contain more than a few misclassifications due to news cross citing be-tween American and British press. Results for each group’s best model using ten-fold cross-validation on the training dataset are shown in Table 1. All figures have been macro averaged, i.e., they have been computed averaging the ten folds.
Because best results for each group are obtained with different feature sets, a new classifier is in-troduced. This classifier determines the language/variety group of each example before applying its particular group classifier. As can be seen in Table 2, the degree of token overlap between languages and varieties of different groups is rather low compared with the degree of overlap within the same group. Using only tokens, total accuracy is reached on the training dataset using cross validation. A classifier applying several classifiers in the way we propose is known as a hierarchical two-level classifier.
4 Evaluation and Error Analysis
bs hr sr id my sk cz pt-BR pt-PT es-AR es-ES en-GB en-US bs 35.51 31.29 2.25 2.05 2.09 1.95 1.91 2.00 1.92 1.99 2.09 2.10
hr 41.18 2.47 2.21 2.15 2.04 2.08 2.20 2.12 2.16 2.42 2.39
sr 2.06 1.74 1.95 1.79 1.63 1.72 1.69 1.69 1.68 1.68
id 19.02 2.36 2.47 4.00 4.14 4.35 4.21 6.81 6.74
my 1.91 2.00 3.43 3.61 3.75 3.52 6.40 6.23
sk 9.45 2.12 2.15 2.20 2.22 2.55 2.56
cz 2.18 2.25 2.24 2.27 2.73 2.70
pt-BR 29.17 12.04 11.63 4.62 4.60
pt-PT 12.14 12.50 4.92 4.94
es-AR 30.91 5.52 5.52
es-ES 4.89 4.90
en-GB 32.76
[image:5.595.81.519.60.207.2]en-US
Table 2: Lexical overlap between pairs of languages as a percentage. Only orthographic forms and punctuation signs appearing more than once in the training dataset has been considered.
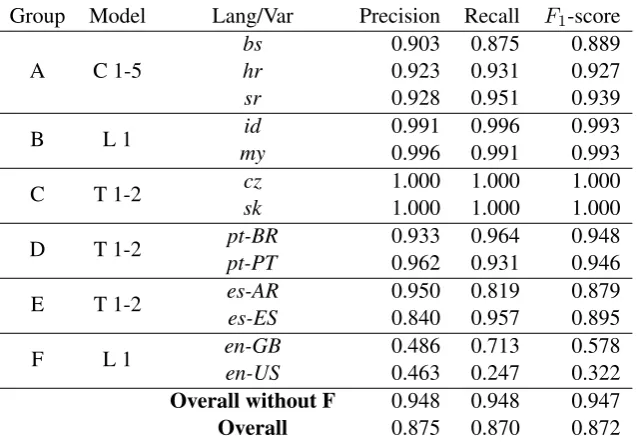
Group Model Lang/Var Precision Recall F1-score
A C 1-5 bshr 0.9030.923 0.8750.931 0.8890.927
sr 0.928 0.951 0.939
B L 1 myid 0.9910.996 0.9960.991 0.9930.993
C T 1-2 czsk 1.0001.000 1.0001.000 1.0001.000
D T 1-2 pt-BRpt-PT 0.9330.962 0.9640.931 0.9480.946
E T 1-2 es-ARes-ES 0.9500.840 0.8190.957 0.8790.895
[image:5.595.141.460.253.475.2]F L 1 en-GBen-US 0.4860.463 0.7130.247 0.5780.322 Overall without F 0.948 0.948 0.947 Overall 0.875 0.870 0.872
Table 3: Macro-averaged Precision, Recall andF1-score on the DSL test dataset. Models are described in Table 1.
Table 4 shows the confusion matrix for the classifier on the test dataset and Table 1 the results in terms of precision, recall andF1-score for each language and variety. As can be seen in Table 4, no example has been classified outside in a wrong group.
Tan et al. (2014) provide a baseline using a Na¨ıve Bayes classifier on character 5-grams. As can be seen if Table 3 is compared with Table 4 of Tan et al. (2014), figures for group A are slightly below the baseline, groups B and C achieve the same results, D and E groups get slightly better results with the maxent classifier, and the biggest difference is found in group F, having better results Na¨ıve Bayes. The overall result without group F is similar: anF1-score of 0.947 for maxent and 0.942 for Na¨ıve Bayes.
The DSL Corpus is composed of journalistic comparable texts to make the corpus suitable for discrim-inating similar languages and languages varieties but not text types or genres. Tiedemann and Ljubeˇsi´c (2012) avoid biases towards topic and domain by experimenting with parallel texts reaching an overall accuracy of 90.3% for group A (br,hr,sr) using a ‘black list’ classifier and comparing its results with a Na¨ıve Bayes approach. They found that the ‘black list’ classifier generalise better than the Na¨ıve Bayes approach when moving from parallel to comparable corpora, since the former classifier is based on more informative features than the later.
bs hr sr id my cz sk pt-BR pt-PT es-AR es-ES en-GB en-US
bs 875 61 64 0 0 0 0 0 0 0 0 0 0
hr 60 931 9 0 0 0 0 0 0 0 0 0 0
sr 33 16 951 0 0 0 0 0 0 0 0 0 0
id 0 0 0 996 4 0 0 0 0 0 0 0 0
my 0 0 0 9 991 0 0 0 0 0 0 0 0
cz 0 0 0 0 0 1,000 0 0 0 0 0 0 0
sk 0 0 0 0 0 0 1,000 0 0 0 0 0 0
pt-BR 0 0 0 0 0 0 0 964 36 0 0 0 0
pt-PT 0 0 0 0 0 0 0 69 931 0 0 0 0
es-AR 0 0 0 0 0 0 0 0 0 819 181 0 0
es-ES 0 0 0 0 0 0 0 0 0 43 957 0 0
en-GB 0 0 0 0 0 0 0 0 0 0 0 571 229
[image:6.595.82.514.61.206.2]en-US 0 0 0 0 0 0 0 0 0 0 0 602 198
Table 4: Confusion matrix for the hierarchical maxent classifier on languages and varieties in the DSL test dataset. The 1,000 Bosnian texts have been classified as Bosnian (875), Croatian (61) and Serbian (64).
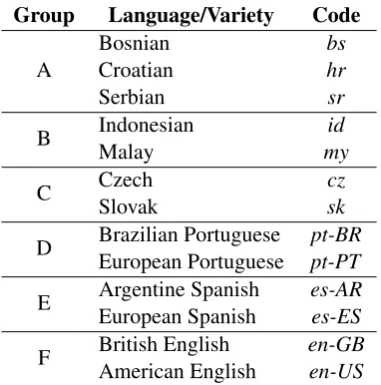
Group Language/Variety Code
A BosnianCroatian hrbs
Serbian sr
B IndonesianMalay myid
C CzechSlovak czsk
D Brazilian PortugueseEuropean Portuguese pt-BRpt-PT
E Argentine SpanishEuropean Spanish es-ARes-ES
F British EnglishAmerican English en-GBen-US
Table 5: Languages and varieties groups and codes.
outperform character n-grams. Given that datasets are not identical, it is difficult to draw any conclusion from the 1.2% difference in accuracy between DSLRAE and Zampieri et al. (2013). Manual inspection of misclassified news suggests some textual properties that are specially challenging: a) high density of foreign proper names (Russian,Baby,Pony,Jack, . . . ) may dilute the evidence provided by vernacular words; b) conversely, low density of features specific to any variant (such as place or family names5,
demonyms, lexical choices) may be insufficient to drive the text to the right class; this is also the case of some perfectly neutral sentences where a trained linguist could not spot any clue about their origin; c) certain syntactical idiosyncrasies (for example Argentinian idiomsla pasas bien,tal como muchas veces, en exceso de) are not captured by bigrams; d) there are instances of cross-information, e. g., Argentinian news about Spain and vice versa where maybe more of a topic rather than a variety is being detected (e. g., news about Urdangar´ın or Fern´andez de Kirchner); e) there are some typos and misspellings (carabanas,dosco) whose role remains unclear; e) finally, there is at least one text misclassified in the gold standard: it is labeled as Argentinian but it was written by the Spanish EFE news agency. Some of these difficulties cross-cut all language groups and are not specific to Spanish but rather to DSL as a task. In contrast to what Zampieri and Gebre (2012) found, ten-fold cross-validation on the training dataset for different feature settings on the DSL dataset did not find character grams to outperform word n-grams for group D (Portuguese). It could be hypothesized that they used a unique source (newspaper) for each variety and therefore rigid editorial conventions could be at play; moreover, the collections were
[image:6.595.204.395.264.457.2]three years distant, so topic consistency could also be compromised6. Manual inspection of mislabeled
sentences shows some already known categories: evidence diluted by foreign words (Red Brick Ware-house,M´esz´aros,Fat Duck), poor evidence (Valongo,Sao Paulo) or cross-information (TAP,Bras´ılia). There is, however, a Portuguese-specific issue: some texts obey the 1990 Orthographic Agreement7
which blurs the orthographic distinctions regarding diacritics or consonant clusters; in fact, one sentence contains words following both standards (perspectiva and reproduc¸˜ao). It remains unexplained why word bigrams did not capture the Brazilian preference for passive voice (foram rebaixados), auxiliary + gerund chunks (estamos utilizando) or clitic dropping (lembro).
Despite findings by Tiedemann and Ljubeˇsi´c (2012), character n-grams performed better during ten-fold cross-validation on the training dataset for different feature settings on the DSL dataset for group A (Bosnian, Croatian and Serbian). Misclassified sentences involve failing to capture adapted place names (Belgiji, ˇSvedskoj) or derivational choices (organiziranog).
Results of ten-fold cross-validation on the training dataset for different feature settings for group B (Indonesian and Malay) top ranked word unigrams. Ranaivo-Malanc¸on (2006) uses number formatting and exclusive word lists. It can be hypothesized that lexical overlap is low (see Table 2) and/or frequency distributions are dissimilar thus allowing word unigrams to perform as well as ‘white lists’.
Languages of group C (Czech and Slovak) are dissimilar both orthographically and lexically. These dissimilarities are surprisingly well captured by the top 10,000 most frequent words.
5 Conclusions and Future Work
In this paper, we have shown that a hierarchical classifier is well suited to discriminate among different language groups and languages or varieties therein. Different features are shown to better suit typological traits of supported languages. A comparison to previous approaches is provided, when available.
In a multilingual setting, the effect of adding Galician to group D could be investigated. Focusing on Spanish language, we plan to geographically expand the classifier to deal with all national varieties, a much harder task as both Baldwin and Lui (2010) and Zampieri et al. (2013) remark. Moreover, the classifier could be used, as Tiedemann and Ljubeˇsi´c (2012) suggest, to learn varieties discriminators to label texts beyond national classes (e.g. both Caribbean and Andean Spanish cross-cut national borders and, conversely, nations involved are known not to be dialectally uniform). Given that error analysis showed that word bigrams fail to capture certain syntactical idiosyncrasies, a model with longer n-grams and/or knowledge-richer features such as POS sequences could also be explored, although Zampieri et al. (2013) report lower performance than knowledge-poor features. Finally, classification techniques such as those described in Gyawali et al. (2013) may be used to discard translations when building monolingual, vernacular corpora.
A diachronic expansion, such as Trieschnigg et al. (2012), is also in mind. Medieval Castilian coex-isted with other Romance varieties such as Leonese or Aragonese whose features permeated Castilian texts. Researchers are in need of a tool to properly classify diachronic texts to accurately describe older stages of Spanish. Following the suggestion of Tiedemann and Ljubeˇsi´c (2012), we envisage the use of parallel texts such as versions of the Bible from different areas to learn the differences among varieties.
References
Timothy Baldwin and Marco Lui. 2010. Language identification: The long and the short of the matter. In HLT-NAACL, pages 229–237.
Kenneth Beesley. 1988. Language identifier: A computer program for automatic natural-language identification of on-line text. InLanguage at Crossroads: Proceedings of the Annual Conference of the American Translators Association, pages 47–54.
A. L. Berger, S. A. Della Pietra, and V. J. Della Pietra. 1996. A maximum entropy approach to natural language processing.Computational Linguistics, 22(1):39–71.
Leonard Bloomfield. 1935.Language. Allen & Unwin, London.
William B. Cavnar and John M. Trenkle. 1994. N-gram-based text categorization. InProceedings of 3rdAnnual
Symposium on Document Analysis and Information Retrieval (SDAIR 94), pages 161–175.
J. N. Darroch and D. Ratcliff. 1972. Generalized iterative scaling for log-linear models. The Annals of Mathemat-ical Statistics, 43(5):1470–1480.
Ted Dunning. 1994. Statistical identification of language. Technical report, Computing Research Laboratory. New Mexico State University.
E. Mark Gold. 1967. Language identification in the limit. Information and Control, 10(5):447–474.
Gregory Grefenstette. 1995. Comparing two language identification schemes. InProceedings of the 3rd
Interna-tional Conference on Statistical Analysis of Textual Data (JADT 95), pages 263–268.
Cyril Grouin, Dominic Forest, Lyne Da Sylva, Patrick Paroubek, and Pierre Zweigenbaum. 2014. Pr´esentation et r´esultats du d´efi fouille de texte DEFT2010 : o`u et quand un article de presse a-t-il ´et´e ´ecrit ? InProceedings Atelier de clˆoture de la sixi`eme ´edition du D´efi Fouille de Textes (DEFT-2010), pages 1–15.
Binod Gyawali, Gabriela Ramirez, and Thamar Solorio. 2013. Native language identification: a simple n-gram based approach. InProceedings of the Eighth Workshop on Innovative Use of NLP for Building Educational Applications, pages 224–231.
Chu-Ren Huang and Lung-Hao Lee. 2008. Contrastive approach towards text source classification based on top-bag-of-word similarity. InPACLIC, pages 404–410.
Norman C. Ingle. 1978.Language identification table. The author, Shoreham-by-Sea.
Heinz Kloss. 1967. Abstand languages and Ausbau languages.Anthropological Linguistics, 9(7):29–41. Zhang Le, 2004.Maximum Entropy Modeling Toolkit for Python and C++, December.
Nikola Ljubeˇsi´c, Nives Mikeli´c, and Damir Boras. 2007. Language identification: How to distinguish similar languages. InProceedings of the 29th International Conference on Information Technology Interfaces, pages 541–546.
Marco Lui and Timothy Baldwin. 2011. Cross-domain feature selection for language identification. InIJCNLP, pages 553–561.
Marco Lui and Timothy Baldwin. 2012. langid.py: An off-the-shelf language identification tool. In Proceed-ings of the ACL 2012 System Demonstrations, pages 25–30.
Marco Lui and Paul Cook. 2013. Classifying English documents by national dialect. InProceedings of the Australasian Language Technology Association Workshop 2013 (ALTA 2013), pages 5–15.
Bruno Martins and M´ario J. Silva. 2005. Language identification in web pages. InProceedings of the 2005 ACM Symposium on Applied Computing, pages 764–768.
Paul McNamee. 2005. Language identification: A solved problem suitable for undergraduate instruction.Journal of Computing Sciences in Colleges, 20(3):94–101.
Muntsa Padr´o and Llu´ıs Padr´o. 2004. Comparing methods for language identification. Procesamiento del Lenguaje Natural, 33:155–162.
S. A. Della Pietra, V. J. Della Pietra, and J. Lafferty. 1997. Inducing features of random fields.IEEE Transactions on Pattern Analysis and Machine Intelligence, 19(4):1–13.
Bali Ranaivo-Malanc¸on. 2006. Automatic Identification of Close Languages – Case study: Malay and Indonesian.
ECTI Transactions on Computer and Information Technology, 2(2):126–134.
Liling Tan, Marcos Zampieri, Nikola Ljubeˇsi´c, and J¨org Tiedemann. 2014. Merging comparable data sources for the discrimination of similar languages: The DSL corpus collection. InProceedings of the 7th Workshop on Building and Using Comparable Corpora (BUCC).
J¨org Tiedemann and Nikola Ljubeˇsi´c. 2012. Efficient discrimination between closely related languages. In
Proceedings of COLING 2012, pages 2619–2634.
R.B. Trieschnigg, D. Hiemstra, M. Theune, F.M.G. de Jong, and T. Meder. 2012. An exploration of language identification techniques for the Dutch folktale database. InProceedings of the Workshop on Adaptation of Language Resources and Tools for Processing Cultural Heritage (LREC 2012), pages 47–51.
Peter Trudgill. 2004. Glocalisation and the Ausbau sociolinguistics of modern Europe. In Anna Duszak and Urszula Okulska, editors,Speaking from the Margin: Global English from a European Perspective, pages 35– 49. Peter Lang, Frankfurt am Main.
Marcos Zampieri and Binyam Gebre. 2012. Automatic identification of language varieties: The case of Por-tuguese. InProceedings of KONVENS 2012, pages 233–237.
Marcos Zampieri, Binyam Gebrekidan Gebre, and Sascha Diwersy. 2013. N-gram language models and POS distribution for the identification of Spanish varieties. InProceedings of TALN2013, pages 580–587.
Marcos Zampieri, Liling Tan, Nikola Ljubeˇsi´c, and J¨org Tiedemann. 2014. A report on the DSL shared task 2014. InProceedings of the 1st Workshop on Applying NLP Tools to Similar Languages, Varieties and Dialects (VarDial).