Munich Personal RePEc Archive
A review of active and passive labour
market policies in Spain
Cueto, Begoña and Patricia, Suárez
University of Oviedo
November 2014
1
A review of active and passive labour market
policies in Spain
Begoña Cueto*
Department of Applied Economics University of Oviedo
bcueto@uniovi.es
Patricia Suárez*
Department of Economics University of Oviedo suarezcpatricia@uniovi.es
Abstract
The aim of this paper is to analyse the role of active labour market policies in Spain, focusing on the public employment service (PES), training, and employment incentives. Previously, the main features of unemployment subsidies and their connection to active policies is presented. The majority of the resources is targeted to employment incentives, despite their high deadweight effect given their characteristics. Data also show the scarce role of PES as intermediary. Finally, we present a discussion on the main guidelines to reform active labour market policies in order to improve their efficiency.
2 1 Introduction
Active labour market policies (ALMP) are tools addressed to either increase the probability of re-employment of unemployed workers or to reduce the probability of losing the job in the case of employed workers. In Spain, its provision is characterised by the decentralisation of ALMP, which entails that Autonomous Communities are (now) responsible for the orientation and training of workers.
In 1991, the process of decentralisation of ALMP begins with the transfer of competencies on occupational training from the central government to Catalonia. Similarly, Catalonia was the first autonomous community to obtain competency regarding employment and training, back in 1997. The process of decentralisation of all ALMP consummated in 2011, after they were transferred to the Basque Country.
Under this regulatory framework, the regional Public Employment Services (PES) assume the functions of control and regulation of the labour market, reflected in the following activities: monitoring of the labour market (management of subsidies to promote employment and vocational training, management and control of Escuelas-Taller, and management of active employment policies around personalised itineraries for jobseekers), authorisation and control of employment agencies,
and management of the EURES Network1.
In this paper, we aim to provide an overview of ALMP in Spain. Nevertheless, we firstly present the main features of unemployment subsidies and their connection to active policies. After that, major expenditure figures on these policies are presented, followed by a revision of the characteristics of job placement, training and employment incentives. The paper finishes with a discussion section regarding the proposed lines on which to base a potential policy reform.
2 Decentralisation and the institutional organisation of labour market policies
Regarding competent authorities for passive policies, it is worth mentioning that the State is exclusively responsible for this area. The Sistema Nacional de Empleo (SNE, in English, National Employment System) consists of the State PES (SEPE) and the PES of the Autonomous Communities. The objectives and functions of the Law are articulated in turn in the role played by the National Employment System, defined as the set of structures, measures, and actions necessary to promote and develop employment policy.
Law 56/2003 on Employment is the main regulatory framework of ALMPs, as it organises their decentralisation framework and defends the need to establish and define the collaboration and cooperation mechanisms with the PES of the autonomous communities. To complete the regulatory mechanics between the different levels of authorities, subsequent normative developments have delved into this law in greater detail, which is the basis for the current employment policy.
2.1 The process of transferring to the autonomous communities
The basis for the “decentralisation” and shift of ALMP can be found in the Constitution and the Autonomy Statutes of the autonomous communities and in the Employment Law of 2003, where employment policy is included in the framework of economic policy. Specifically, the management
3
of professional education, support for employment, and a broad sense of labour intermediation are defined in article 149.1.7. ª of the Spanish Constitution2.
The start of the shift of authority over ALMP can be dated back to the transfer of responsibility over professional occupational training to Catalonia in 1991. Likewise, in 1997, Catalonia was the first autonomous community to obtain competence in work, employment, and training issues. Currently, the process of decentralisation and change in management of the entire ALMP system has culminated in the handover of power in 2010 to the Basque Country..
The creation of the PES as bodies responsible for the management and/or execution of the ALMP at the autonomous level has been conducted on an uncoordinated time scale, following different schedules according to the policies of each autonomous community. In Galicia, for example, a Galician Placement Service was created based on Royal Decree (RD) 735/1995, which currently functions as the body managing the ALMP. In other autonomous communities, a managing body was created as soon as the shift had been completed in terms of work, employment, and training. In summary, the process of transferring powers began in 1991 and was completed in 2010. Certain autonomous communities enjoyed all transferred prerogatives in 1997, while others only recently acquired them. As the process has followed different schedules, the experience and the knowhow of each autonomous community are different, and therefore the implementation of ideas in the SNE is becoming a fundamental aspect.
With this regulatory framework, the regional PES assume the functions of control regulation of the labour market, which is reflected in labour market control activities:
- Management of state subsidies for promoting employment and professional training.
- Management and control of workshop schools and craft centres (in Spanish, Escuelas Taller y Casas de Oficios).
- Management of the ALMP in terms of roadmaps of personalised service for job seekers, according to their characteristics and their personal and professional requirements, as well as preventive and personalised PES services.
- Authorisation and control of Placement Agencies.
- Management of the EURES network.
At the normative level, the collaboration between Autonomous PES and for-profit placement agencies has been possible since 2010. However, the Law needed additional regulations and the signing of collaboration agreements between agencies and Autonomous PES and, at this point, the process failed.
The national Government has designed a new framework agreement for both regional and national PES to collaborate with intermediation agencies under a common architecture. In August 2013, the beginning of the process started and 14 autonomous communities agree to participate (Aragón, Asturias, Baleares, Canarias, Cantabria, Castilla y León, Castilla-La Mancha, Extremadura, Galicia, La Rioja, Madrid, Murcia, Comunidad Valenciana and Navarra). In October 2013, a press note from the Employment and Social Security Ministry informed about the presentation of 204 placements
2Article 149.1.7.ª of the Spanish Constitution. The State does not have exclusive competence on the
4
agencies, 134 were admitted and 70 rejected. However, the process is now suspended until the appeals of rejected firms were resolved3.
The administrative conditions include the maximum price that placement agencies can charge for each labour insertion. This price goes from 300 Euro (individuals between 16 and 44 years old, unemployed for 3 to 6 months) to 3,000 Euro (long-term unemployed individuals over 55). It is obvious that age and time in unemployment are key variables in labour insertion. However, given the characteristics of Spanish unemployed workers, there is an important variable missing in the design of this administrative agreement: the level of education.
2.2 Collaboration and cooperation
Although coordination between different Administrations is an aspect of the territorial organisation model included in the Spanish Constitution, it is necessary to ensure that, in effect, this coordination does in fact take place.
Regarding the coordination of unemployment benefits and employment management, after decentralisation, collaboration agreements have been drawn up between each Autonomous PES and the SEPE. In practice, to the extent that citizens go to the same employment office4 to manage their registration as a job seeker to collect their unemployment benefit, this process has not affected them, and, in truth, they are not aware of the redistribution of responsibilities between administrations. The novelty is that in a single employment office, there is staff of the Central Administration (managing the benefits) and staff hired by the Autonomous Administration (managing the ALMP).
Additionally, the Employment Law of 2003 recognises work on collaboration, coordination, and cooperation as a fundamental aspect of the adequate development of employment policy. Therefore, two bodies are recognised within the SNE: the Sectorial Conference of Labour Affairs and the General Council of the National Employment System.
The Sectorial Conference of Labour Affairs is the general collaboration, coordination, and cooperation instrument between the State Administration and the administrations of the autonomous communities and the cities of Ceuta and Melilla in terms of employment policy, especially in the development of Execution Plans of the European Employment Strategy.
The General Council of the SNE, part of the MEYSS, is the consultative body for institutional participation of the public Administrations and of social stakeholders in employment policy. It comprises representatives of the State Central Administration, of the autonomous communities, of the Cities of Ceuta and Melilla, of the most representative employers organisations (CEOE and CEPYME), and of labour unions (UGT, CCOO, CIG, ELA).
We should stress the role of the Sectorial Conference of Labour Affairs, which has become a highly relevant body for defining policies, as it is the place where the SEPE and Autonomous PES meet and discuss policy.
3http://prensa.empleo.gob.es/WebPrensa/noticias/laboral/detalle/2065.
4Regional and national employment offices are co-located. In the same employment offices, there is space
5
2.3 Information System for Public Employment Services
The Information System for Public Employment Services (in Spanish, SISPE, Sistema de Información de los Servicios Públicos de Empleo) is the common information system and the technical instrument bringing together labour intermediation, ALMP, and SUB management.
This tool was implemented in 2005 as a consequence of transferring the ALMP, which resulted in a single State Administration and Autonomous Administrations information portal. Its objective was guaranteeing basic, uniform, and coordinated management in all ACs. Therefore, it became the basis for more links between passive policies (Central Administration) and active policies (autonomous communities). The same tool includes written information on workers registered with the PES as of each last working day of the month, the changes in demand and their causes (entries and exits), employment offers or jobs offered by companies registered with the PES, information on contracts deriving from the mandatory nature of contract registration when going through PES, and, finally, the placements or jobs covered by a worker. The additional advantage of a placements file over a contracts one is that the placements can be statistically counted in the month in which the placement begins, which provides information about the relationship of the person with the PES (registered or not) and about the offer or job he or she is filling.
Summing up, SISPE contains all the information that jobseekers provide PES when they register in the employment offices. Regarding the contracts file, the data refers to the workers’ characteristics
and also the firms’ characteristics. Therefore, the potential of both files to analyse the labour market
performance of jobseekers is really high.
The SISPE is a basic tool shedding light on the management of the ALMP with common indicators for all autonomous community, thus leading to information sharing. Nevertheless, each PES is allowed sufficient autonomy to promote the development of new IT applications that would facilitate its management. Some autonomous communities opted for their own information system (Andalucía, Canaries, Castile and Leon, Catalonia, Galicia and the Valencian Community). In any case, integration into the overall management system must be guaranteed (and, in fact, it is).
One of the future challenges still to be implemented is to allow an unemployed person in any autonomous community to consult vacancies in any PES without having to check the 17 websites belonging to each autonomous community. In this context, the Single Employment Portal (in Spanish, Portal Único de Empleo) announced at the Sectorial Employment and Labour Affairs Conference in April 2013 is a basic coordination instrument to avoid labour market fragmentation.
3 Unemployment and benefits
The Spanish system of unemployment benefits (SUB) consists of an unemployment insurance and an unemployment assistance. Its regulation has been recently modified to reduce, in some cases, its total amount and increase the age at which one becomes eligible for the benefit.
Workers who have lost their job, and who have paid unemployment insurance for at least 360 days during the last six years prior to unemployment, are eligible to receive the unemployment benefit5.
5 Potential workers included in the Special Agrarian System for Social Security have their own contributory
6
For a full-time job, contribution days are counted 7 days per week (5 working days per week weighted by the coefficient 1.4)6.
The duration of this benefit ranges from a minimum of 120 days (for individuals who had worked a year) up to a maximum of 720 (for individuals who have worked 6 or more years).
The amount paid out in benefits depends on the regulatory base for each worker, calculated as the mean of the contribution bases7 for unemployment in the last 180 days worked (excluding remuneration for overtime). Thus, the monthly amount is 70% of the regulatory base, falling to 50% from the seventh month onwards. This second rate was approved in July 2012, with a prior amount of 60%. Nevertheless, there are minimum and maximum amounts determined by the number of children and considering the Indicador Público de Renta de Efectos Múltiples (IPREM, in English Public Income Indicator with Multiple Effects8).
The unemployment assistance is an additional benefit that complements the contributory insurance and can be received if the person in question has an income of less than 75% of the Salario Mínimo Interprofesional (SMI, in English Interprofessional Minimum Wage), under the following assumptions:
Workers who have completed the contributory benefit (unemployment insurance) and have
family responsibilities.
Workers who have completed the contributory benefit and have no family responsibilities
but are over 45.
Workers who have not met the minimum contribution period to gain access to the unemployment insurance.
Its length depends on the workers’ age and the presence of family responsibilities and ranges from 6 to 24 months.
Furthermore, in the case of workers over the age of 559 who have contributed to the unemployment fund for at least 6 years during their professional life, two particularities must be taken into account: first, the income requirement is applied to the family unit if the worker has a spouse and/or children below the age of 26, older children with disabilities, or foster children. And second, the subsidy length is extended up to the age when the worker can access a contributory retirement pension.
Regarding activation, the beneficiaries of unemployment benefits or subsidies should register as job seekers, renewing this condition every 3 months, and comply with the “commitment to activity” (in Spanish, Compromiso de activación)10.
6
In the case of part-time jobs, each day worked is considered as a contribution day, regardless of the duration of the day. If the day is divided into 5 or more days of work per week, the contribution period will be equal to the duration of the contract. If the day is distributed within 5 working days a week, the total days of service shall be multiplied by the coefficient 1.4.
7 The contribution base can be equated to the salary, but there are minimum and maximum thresholds (in
2014, 753 and 3,597 Euros per month, respectively).
8 The IPREM is an index used as reference for awarding, for example, help, scholarships, subventions, and
unemployment subsidies.
9 Until the Royal Decree-Law 20/2012 of 13 July came into force, on measures guaranteeing budgetary
stability and promoting competitiveness, the age at which this right could be requested was 52.
7
The commitment to activity is understood as active job seeking: applying to open job postings and providing the Public Employment Service (PES) with proof of attendance within 5 days; accepting an adequate match; and participating in specific activities related to motivation, information, training, retraining, or professional placement purposes, aiming to increase employability, as well as to meet the obligations described in the regulations on unemployment benefits. Failure to comply entails disciplinary effects such as minor sanctions after the first 100 days of receiving the benefit.
In 2000, Renta Activa de Inserción (RAI, in English Active Insertion Income) was commenced for the first time, aimed at the unemployed with special economic needs and difficulties in finding employment, including measures to improve their job re-entry. The programme was renewed each year until it became permanent in 2006. RAI is aimed at people over 45 years of age, unemployed for at least 1 year, who have exhausted their benefits and/or the unemployment subsidy and who lack income of more than 75% of the SMI in their family unit.
The beneficiaries of RAI must sign the commitment to activity and must participate in activities improving their employability, such as individualised meetings, job entry itineraries, professional interviews to define their professional profile, activities aimed at defining their personal job entry plan, employability plans, and/or training and/or volunteering activities. The amount paid out in 2014 was raised to 426 Euros (80% of the IPREM), and this benefit has a maximum duration of 11 months.
3.1.1 Temporary unemployment protection programmes
One of the measures taken by the Government from the start of the crisis has been an extension of the benefits that entail some type of unemployment subsidy to cases where the family unit does not receive any income. Thus, in August 2009, the Programa Temporal de Protección por Desempleo e Inserción (PRODI, in English Temporary Unemployment Protection and Insertion Programme) was launched, with the goal of providing a certain level of income for workers who exhausted their unemployment benefit or subsidy and still do not have a job. Thus, workers below the age of 65 who are ending their benefit period and are without rights to a subsidy or who have exhausted it and lack income over 75% of the SMI can participate, on a one-time basis, in this extraordinary benefit for six months at a level of 80% of the Public Income Indicator with Multiple Effects (IPREM). These workers should, furthermore, meet the commitment to activity included in the PES.
Initially, the duration of the PRODI was six months. However, constant crisis conditions led to its extension in February and August 2011. To date, this programme has been modified to direct it towards workers of less than 30 years of age or above 45 or to persons between 30 and 45 years who have family responsibilities.
8
beneficiaries”, perhaps indirectly admitting the difficulty of following through with such measures. Given the resources of the PES, it is difficult to conduct follow-up and personalised training for the unemployed.
This step is a relevant change in direction in the rollout of this type of measures. Previously, the commitment to activity signed by the unemployed when they access any type of benefit was an additional measure with little or no effect. With the PREPARA programme, the necessary condition of accessing help with the itinerary and receipt of support, on a monthly basis, is participation. Thus, the importance of participating in ALMP when unemployed is recognised, with the goal of finding a better way back to employment.
This programme requires the implication of national and regional PES. On the one side, SEPE is responsible for the payment and, on the other side, regional PES are in charge of supervision of participation in active measures by participants. The collaboration agreements between SEPE and regional PES are the framework for this kind of programmes which required the participation of both organizations.
The initial length of this programme was six months, with two extensions enacted. In August 2012, the government proposed a new extension, introducing several modifications justified by the assessment of the PREPARA plan and based on the “limited success of the job insertion plan among beneficiaries”.
The results showed that out of the 500,859 PREPARA beneficiaries up to July 2012, 307,029 people (61.3%) had already finished the programme. Ninety-three per cent of the insertion plans were training activities, and less than 8% had participated in retraining courses. As for insertion, 70% had not returned to work, and only 18% had held down work for more than two months. This assessment was not positive, and changes were therefore proposed to improve participant employability. Although the evaluation effort should be viewed positively, we have to state that it could be improved, as there is no control group with which to compare the 30% insertion rate obtained. Additionally, the published information does not contain data on the time elapsed from the end of the programme up to the assessment or whether there were differences based on groups, insertion activity types, or a person’s educational level. Furthermore, given the country’s economic outlook in 2013 (532 thousand jobs were lost in that year), the evaluation of these results should have been compared with unemployed groups that did not participate in the programme.
The follow-up to the commitment to activity is reinforced through the inclusion of a requirement that the programme request accreditation of the active search activities for at least 30 days. Additionally, the obligation was included to participate in ALMP actions and job searching among the offers proposed by the Public Employment Services (an obligation that was already included at the onset of the programme), as such participation is mandatory to receive support. Furthermore, an obligation to accept an adequate job offer11 as offered by the PES was specified.
However, it is worth noting that these requirements are not novel; instead, their explicit inclusion is a reminder of the commitment and focus on compliance. The most relevant change is the requirement of accrediting active search actions for at least 30 days before requesting a benefit. This
9
requirement entails a focus on activation and, afterwards, the payment of the benefit tied to active search. The perception of benefit by the unemployed person changes, as the link between an active search and a payment is made explicit.
3.2 Analysis of changes in the number of unemployment benefit recipients
The following graph shows the changes in the number of beneficiaries of the various types of unemployment benefits. From 2007, the number of workers receiving the insurance or the unemployment assistance began to rise as a consequence of rising unemployment. While in 2005 and 2006 the number of benefit recipients was 670,000, it increased by 7.8% in 2007, and in 2008 it reached the one million mark, an increase of over 40%. The same increase could be observed in 2009, resulting in 1.6 million people receiving the unemployment benefits.
The evolution of the unemployment assistance is similar. Between 2004 and 2006, the number of recipients was stable at approximately 350,000. In 2008, it nearly reached 450,000, and in 2009 over 750,000 people received this subsidy. In summary, the brutal destruction of employment starting in 2007 resulted in a substantial increase of workers depending on the unemployment protection system. Beginning in 2010, we can observe falling numbers of benefit recipients. However, this decrease is not due to reduced unemployment but to increased long-term unemployment and, thus, the exhaustion of rights to benefits, as the maximum number of months that can be received is 24. In fact, the number of assistance recipients continued increasing and exceeded one million people in 2011.
[image:10.595.78.523.424.581.2]Regarding the PRODI beneficiaries, the number of people receiving this extraordinary benefit rose dramatically, achieving its maximum level in April 201012. The functioning of the programme, where one can be a beneficiary only once, meant that as long-term unemployment rose, the number of potential beneficiaries dropped. In 2013, 113 unemployed received this benefit.
Table 1. Beneficiaries of the Spanish system of unemployment benefits (2000-2013)
Unemployment insurance
Unemployment assistance
Temporary agricultural workers
PRODI RAI Total
2000 446.678 367.851 224.170 3.966 1.042.665
2001 501.258 357.072 233.495 7.752 1.099.576
2002 565.902 354.092 224.621 50.777 1.195.392
2003 630.443 357.886 202.033 16.325 1.206.686
2004 663.154 352.954 207.031 39.253 1.262.392
2005 687.033 352.051 206.450 49.666 1.295.200
2006 720.384 353.907 204.795 51.346 1.330.432
2007 780.205 373.891 201.784 65.600 1.421.480
2008 1.100.879 448.441 197.744 67.567 1.814.631
2009 1.624.792 764.805 196.083 95.543 2.681.223
2010 1.471.826 995.611 199.715 249.902 125.680 3.042.734
2011 1.328.020 1.059.474 201.024 70.818 186.316 2.845.652
2012 1.381.261 1.124.953 201.017 1.057 233.773 2.942.061
2013 1.310.915 1.111.019 202.854 113 240.252 2.865.153
Source: Boletín de Estadísticas Laborales. MEYSS.
3.2.1 Entry flow analysis for the benefits
In the following tables, we show the entry and exit causes for the PES, both in the contributive and the assistance modalities. These data allow us to determine the cause of access to the benefit and how this cause has changed with the crisis.
10
The large majority of registrations in the SUB have their origin at the contributive level. In this modality, there are two main causes: layoffs and end of contract, which correspond to an open-ended and temporary end of hiring, respectively. In 2007-08, the end of a contract was the main reason for claiming the benefit in over 60% of the cases. From 2009, the weight of layoffs was increased, as well as, above all, the weight of suspended work and partial unemployment.
Regarding layoffs, we must note that their number was high even in times of economic expansion13. The data suggest that an individual layoff is used as an adjustment instrument for the company staff, both during crisis years and in expansion periods (García-Serrano, 2011). In 2003 and 2004, it seems that the use of layoffs increased, with their main cause being article 1 of the Law 45/2002, with a growth of 147.5% and 58.5% in comparison with the previous year, in each year of the period. In 2005 this number decreased by 10.4%, then increased again in 2006 and 2009 (Cueto and Rodríguez, 2013).
The implementation of Law 45/2002 saw the creation of the “express layoff”, i.e., a rapid (maximum of 48 hours) and easy layoff process (termination letter, recognition of unfairness, and severance deposit) in exchange for a higher severance (45 days of salary per year worked) than in the case of other forms of dismissal.
As a result there is an “implicit agreement” between the employer and the employee. The employer
makes use of the unfair dismissal figure (in Spanish, despido improcedente), paying to the worker the highest severance. On the other hand, the employee agrees on signing the unfair dismissal because he/she has no incentives to sue the employer as, this way, the maximum severance pay is achieved. Therefore, the employer avoids a long and complex layoff process.
This distortion in the layoff system also resulted in dismissals due to objective causes representing a small percentage of the total, even in times of economic crisis, when it would be justified to use this form of laying off staff (Malo, 2005; García Martínez and Malo, 2007).
The 2010 labour reform introduced a new version of the economic reason for dismissal, trying to impose a severance for terminating a contract for economic reasons as the new system norm and thus correcting the mentioned distortion (García-Serrano et al., 2010). The goal was to deploy the new definition of economic cause to effectively lay off staff easily in the case of financial difficulties. The reform implemented in 2012 followed the same direction, again redefining the causes for economic layoffs and eliminating the “express layoff”.
In the years studied, dismissals due to Law 45/2002 constituted over three quarters of the total, slightly increasing their share up to 2007 and decreasing from then onwards, especially in 2011, when they amounted to 70.6% of the total. This change was accompanied by a strong increase in dismissals due to economic reasons.
Regarding assistance claims, the main entrance reason is the exhaustion of the contributive benefit, followed by an insufficient contribution period to access the benefit.
13Toharia and Malo (2009) point out that “the refo
rm of 2002 increased the number of layoffs, rising from 4% of open-ended wage workers in 2000 to 5.5% in all years between 2002 and 2007, with a further increase
11
Table 2. New inflows to unemployment insurance
Total Dismissal Suspended work and partial unemployment
End of trial End of contract
Other reasons
2001 1.091.110 265.760 16.462 9.346 791.412 8.130
2002 2.228.343 354.215 79.864 31.190 1.621.504 141.570
2003 1.291.581 372.772 16.835 13.782 880.008 8.184
2004 1.337.370 397.856 11.546 15.322 904.830 7.816
2005 1.365.145 419.148 15.367 17.111 905.717 7.802
2006 1.431.499 449.838 8.244 20.087 944.537 8.793
2007 1.561.767 497.116 16.259 25.767 1.013.043 9.582
2008 2.236.753 770.225 40.405 35.839 1.379.358 10.926
2009 2.557.901 922.615 379.062 28.012 1.213.536 14.676
2010 1.935.370 739.599 180.409 19.787 980.607 14.968
2011 1.916.929 729.090 169.345 16.895 982.735 18.864
2012 2.092.795 760.064 306.358 17.264 985.531 23.578
2013 1.845.197 671.175 278.471 19.227 846.762 29.562
Source: Boletín de Estadísticas Laborales. MEYSS.
Table 3. New inflows to unemployment assistance
Total Workers who have not met the minimum contribution period to gain access to the
unemployment insurance
> 55 Exhaustion of unemployment
insurance
PRODI Other reasons
2007 410.297 134.418 53.168 149.865 - 72.846
2008 572.975 191.137 64.687 233.304 - 83.847
2009 1.252.935 256.076 98.190 548.961 244.913 104.795
2010 1.634.331 285.351 116.454 558.873 545.365 128.288
2011 1.116.900 329.500 124.230 448.908 75.579 138.683
2012 1.072.086 315.383 119.538 487.887 290 148.988
2013 996.699 294.388 63.233 477.957 134 160.987
Source: Boletín de Estadísticas Laborales. MEYSS.
The effects of the SUB on exits from unemployment have been broadly analysed, with the common result that they are a disincentive for job seeking. These conclusions are confirmed by various studies by Arranz and García Serrano (2013, 2014a). These authors show the existing relationship among the SUB, the common use of temporary contracts, and rehiring at the same company. They estimate the reemployment rate to be 36% for individuals who do not receive benefits and 29% for those who do receive them. Thus, in many cases, layoffs or contract terminations are followed by a period of receiving benefits and then a return to work at the same company.
When the analysis adopts a temporal perspective by studying the entry to and exit from unemployment of the same individual, the usual negative effect of the benefits on the duration of unemployment is reduced in the medium term. The explanation is a high rotation in the labour market, which causes quick returns to employment but also rapid returns to unemployment, in many cases without the necessary contribution period to access longer benefits. That is, the benefits slow the process of labour insertion but also favour retaining employment for a longer period of time. Empirical evidence by Alba et al. (2012) conclude the existence of implicit agreements between workers and firms as UI beneficiaries tend to return to the same firm when the benefit is almost exhausting and they do not observe the same result for UA beneficiaries. The authors suggest that
the duration of unemployment benefits affects firms’ behaviour in terms of hiring the same worker.
So unemployment insurance subsidises layoffs when the employer hires the same worker.
[image:12.595.87.544.284.380.2]12
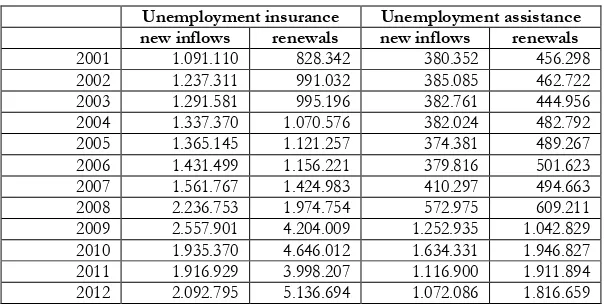
vs. permanent contracts14. We can observe the intensive use of the SUB through data in Table 4 where the inflows into unemployment insurance and assistance are differentiated by new inflows or renewals15. In 2009, renewals of UI represent more than 60% of total inflows.
[image:13.595.147.449.189.342.2]Arranz and García-Serrano (2014b) analyse the use of the SUB by industry. They find that sectors such as construction, hospitality, financial services and business services are subsidized through SUB. Even though the contributions these sectors pay are the same than those paid by other sectors, their workers use unemployment insurance in a much higher proportion.
Table 4. Inflows into SUB: new inflows and renewals
Unemployment insurance Unemployment assistance new inflows renewals new inflows renewals 2001 1.091.110 828.342 380.352 456.298 2002 1.237.311 991.032 385.085 462.722 2003 1.291.581 995.196 382.761 444.956 2004 1.337.370 1.070.576 382.024 482.792 2005 1.365.145 1.121.257 374.381 489.267 2006 1.431.499 1.156.221 379.816 501.623 2007 1.561.767 1.424.983 410.297 494.663 2008 2.236.753 1.974.754 572.975 609.211 2009 2.557.901 4.204.009 1.252.935 1.042.829 2010 1.935.370 4.646.012 1.634.331 1.946.827 2011 1.916.929 3.998.207 1.116.900 1.911.894 2012 2.092.795 5.136.694 1.072.086 1.816.659
Source: Boletín de Estadísticas Laborales. MEYSS.
3.2.2 Exit flow analysis of benefits
The following tables show the distribution of exits from unemployment insurance (Table 5), assistance (Table 6), or RAI (Table 7) as a function of the cause of the exit. As can be expected, a change has occurred beginning in 2009, with increased exits due to benefit exhaustion and a decrease of exits due to labour insertion. The latter increased by over twenty percentage points from 2008 to 2009, while exits due to labour placements decreased. Although they are a small fraction of the total, cautionary and sanction exits have also increased. However, the definition of “precautionary removal
and sanctions” is not clear.
The change in the percentage distribution of exits from the subsidy can be seen in 2010, one year later than the benefits, as a consequence of entry into the subsidy programme once the benefits are exhausted. Finally, the percentage distribution of exits from the RAI is more stable, with the rate of exit due to placement at approximately 20%.
14
Although temporary contracts have a higher unemployment contribution, the difference is only 1.25 points. The general contribution rate for unemployment is 7.05% of the contribution base (the employer pays 5.5% and the worker 1.55%). In the case of fixed-term contracts, it increases to 8.3% (the employer pays 6.7% and the worker 1.6%).
15 The unemployment insurance or assistance can be renewed if workers found a new job, they did not
13
Table 5. Outflows from unemployment benefits. Unemployment insurance
Total Exhaustion of benefits
Placement Emigration Retirement and disability
Precautionary removal and sanction
Other reasons
2001 1.863.084 564.886 1.081.980 2.927 13.533 56.930 142.828
2002 2.164.639 632.512 1.284.967 3.575 15.890 63.809 163.886
2003 2.270.998 661.708 1.337.471 3.719 17.530 65.986 184.584
2004 2.432.189 678.304 1.464.533 3.836 18.249 71.034 196.233
2005 2.505.310 680.395 1.529.572 3.788 20.115 67.282 204.158
2006 2.683.722 673.978 1.677.950 4.455 19.794 77.535 230.010
2007 3.004.581 867.859 1.940.417 10.850 21.936 111.940 51.579
2008 3.708.960 1.114.979 2.348.303 11.158 24.901 134.076 75.543
2009 6.892.873 3.617.788 2.984.077 24.418 28.908 135.275 102.407
2010 6.997.430 3.805.436 2.908.061 33.503 1.500 110.006 138.924
2011 6.105.002 3.137.122 2.706.782 41.979 32.017 113.284 73.818
2012 7.446.480 4.333.604 2.797.242 62.346 35.856 127.912 89.520
[image:14.595.85.524.274.411.2]Source: Boletín de Estadísticas Laborales. MEYSS.
Table 6. Outflows from unemployment benefits. Unemployment assistance
Total Exhaustion of benefits
Placement Emigration Retirement and disability
Precautionary removal and sanction
Other reasons
2001 880.757 378.089 321.553 2.776 6.309 42.118 129.912
2002 876.141 374.166 319.147 2.538 9.806 40.298 130.186
2003 843.165 338.915 302.988 1.504 19.658 37.486 142.614
2004 883.341 326.515 321.986 1.421 19.504 37.252 176.663
2005 877.387 321.905 314.021 1.394 20.786 32.813 186.468
2006 897.368 303.153 322.141 1.352 21.246 36.052 213.424
2007 834.274 183.159 383.097 2.161 29.897 48.538 187.422
2008 922.260 234.735 432.046 2.263 31.189 58.195 163.832
2009 1.543.066 358.402 779.148 7.046 36.221 94.116 268.133
2010 3.083.332 960.198 1.458.639 17.598 1.950 186.313 458.634
2011 2.769.786 896.903 1.280.599 21.388 44.458 164.789 361.649
2012 2.513.141 706.439 1.202.028 27.847 50.056 146.319 380.452
Source: Boletín de Estadísticas Laborales. MEYSS.
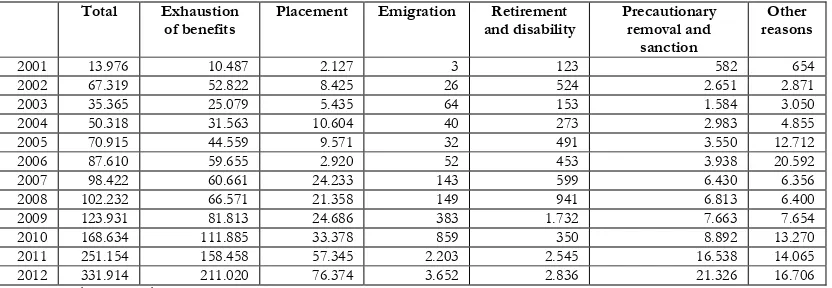
Table 7. Outflows from unemployment benefits. Renta Activa de Inserción
Total Exhaustion of benefits
Placement Emigration Retirement and disability Precautionary removal and sanction Other reasons
2001 13.976 10.487 2.127 3 123 582 654
2002 67.319 52.822 8.425 26 524 2.651 2.871
2003 35.365 25.079 5.435 64 153 1.584 3.050
2004 50.318 31.563 10.604 40 273 2.983 4.855
2005 70.915 44.559 9.571 32 491 3.550 12.712
2006 87.610 59.655 2.920 52 453 3.938 20.592
2007 98.422 60.661 24.233 143 599 6.430 6.356
2008 102.232 66.571 21.358 149 941 6.813 6.400
2009 123.931 81.813 24.686 383 1.732 7.663 7.654
2010 168.634 111.885 33.378 859 350 8.892 13.270
2011 251.154 158.458 57.345 2.203 2.545 16.538 14.065
2012 331.914 211.020 76.374 3.652 2.836 21.326 16.706
Source: Boletín de Estadísticas Laborales. MEYSS.
3.2.3 Coverage rate
The coverage rate is calculated as the total number of beneficiaries who receive unemployment benefits over registered jobseekers. The unemployed without prior work experience are eliminated from the reference population, as they have no rights to benefits due to not having paid prior contributions.
[image:14.595.87.503.457.601.2]14
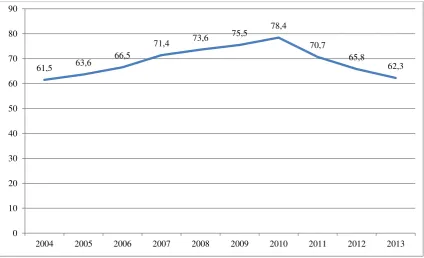
[image:15.595.86.511.135.393.2]exceeded two years in 16% of the registered unemployed, with the same number rising to 25.5% in 2013). As we have seen, the maximum length of the unemployment insurance is 24 months, and the access criteria for the assistance or the RAI are more restrictive.
Figure 1. Benefit coverage of unemployment benefits*
* Total number of beneficiaries who receive unemployment benefits over registered jobseekers who have prior work experience (including the beneficiaries of the potential agrarian workers subsidy).
Source: Boletín de Estadísticas Laborales. MEYSS.
The information on the SUB coverage can be complemented by the data from the Labour Force Survey (LFS). Nevertheless, we should bear in mind that the unemployment data registered in the PES and the LFS are different. The former is a registry, while the latter is obtained through a survey, which leads to differences. However, we should also consider that there are unemployed individuals who do not use the PES as a method of job seeking (and therefore do not register), and some people registered in the public employment offices do not fit the LFS unemployment criteria because in the survey they do not indicate any active form of job seeking.
In Table 8, we compare the two data sources. The numbers corresponding to the beneficiaries of unemployment benefits are similar to the estimates by the LFS, especially from 2011 onward. In contrast, the number of unemployed that are registered shows significant differences from the LFS data, especially if we factor in the number of people who state that they are registered with a public employment office. Regarding the final comparison, the number of people stating before the LFS that they are registered with the PES is greater than the registered unemployment. In this context, we have to consider that the number of jobseekers (“registered unemployment”, in Spanish, paro registrado) is the result of subtracting individuals who have limited availability for a specific profession or seek better employment than they currently have from the total number of PES registrations (in Spanish, demandantes de empleo). When comparing the number of individuals registered with the PES with the number registered with the LFS, the final difference is somewhat smaller.
61,5 63,6
66,5
71,4 73,6
75,5 78,4
70,7
65,8
62,3
0 10 20 30 40 50 60 70 80 90
15
Table 8. Unemployed workers and jobseekers. Unemployment beneficiaries
LFS data PES data
Employed Unemployed Inactive Registered and receiving benefits Registered and not receiving benefits Total registered jobseekers Individuals registered in PES* Registered jobseekers Benefit beneficiaries
2006 18.529.098 1.629.333 8.357.991 1.122.144 2.485.402 3.607.546 2.995.448 2.039.004 1.330.432 2007 19.171.773 1.644.047 8.320.094 1.120.636 2.225.338 3.345.974 3.018.073 2.039.004 1.421.480 2008 18.854.902 2.357.617 8.137.264 1.429.830 2.415.160 3.844.990 3.587.968 2.539.941 1.814.632 2009 17.230.834 3.845.758 8.064.619 2.376.324 3.091.274 5.467.598 4.983.119 3.644.041 2.681.223 2010 16.837.835 4.280.082 7.921.827 2.738.447 3.311.109 6.049.556 5.499.846 4.060.756 3.042.734 2011 16.516.518 4.588.649 7.791.262 2.634.953 3.725.883 6.360.836 5.745.293 4.257.160 2.845.652 2012 15.593.685 5.308.064 7.643.108 2.881.979 4.230.875 7.112.854 6.283.596 4.720.404 2.942.061 2013 15.057.236 5.499.823 7.554.103 2.835.147 4.473.936 7.309.083 6.347.812 4.845.302 2.865.153 * Including individuals who have limited availability for a specific profession or seek better employment than they currently have.
Source: LFS (Spanish Statistical Institute) and MEYSS.
In Table 9, we show the distribution of the LFS unemployed according to their PES situation. Not all of them use it as a way of searching for a job, although this proportion has increased from a minimum of 70.8% in 2007 to 86.7% in 2013.
Table 9. Unemployed workers (LFS) according to their PES situation
Unemployed Registered and receiving benefits Registered and not receiving benefits Total registered jobseekers Not registered in PES Registered jobseekers / total
unemployment
2006 1.629.333 437.348 719.978 1.157.326 472.007 71,0%
2007 1.644.047 465.276 699.322 1.164.598 479.449 70,8%
2008 2.357.617 766.372 979.077 1.745.449 612.168 74,0%
2009 3.845.758 1.586.761 1.553.325 3.140.086 705.672 81,7% 2010 4.280.082 1.896.588 1.718.533 3.615.121 664.961 84,5% 2011 4.588.649 1.849.578 2.073.450 3.923.028 665.621 85,5% 2012 5.308.064 2.099.505 2.493.859 4.593.364 714.700 86,5% 2013 5.499.823 2.068.348 2.702.189 4.770.537 729.286 86,7%
Source: LFS (Spanish Statistical Institute).
Likewise, not all unemployed registered with PES are unemployed according to the LFS definition. While this difference has decreased significantly, many still have employment. We must consider that although they are excluded from the calculations of registered unemployment, persons with a job can register with the PES as a way of searching for a better job. However, the inactive population is much more relevant. In 2006-2007, it was over 40%, a percentage that had fallen considerably from the start of the economic crisis and achieved a level of approximately a quarter of all registered unemployed workers in 2013.
[image:16.595.84.518.316.445.2]16
Table 10. Registered jobseekers according to their LFS situation (%)
All jobseekers Jobseekers aged 55-64
Employed Unemployed Inactive Employed Unemployed Inactive
2006 22.5 34.4 43.1 10.6 21.8 67.6
2007 19.3 37.2 43.5 7.7 25.0 67.3
2008 15.0 48.3 36.7 6.0 30.0 64.0
2009 11.2 60.8 27.9 5.7 41.0 53.3
2010 10.5 63.4 26.1 4.9 44.8 50.3
2011 10.4 65.4 24.2 4.7 47.4 47.8
2012 9.5 68.6 21.9 3.9 51.0 45.2
2013 9.4 69.4 21.3 3.7 53.0 43.3
Source: LFS (Spanish Statistical Institute).
3.3 Other social assistance programmes
The final social assistance programme to be mentioned is the system of Renta Mínima de Inserción (RMI, in English minimum insertion wages). This programme is aimed at people between 25 and 64 years of age, in a situation of extreme poverty and with problems of labour and/or social insertion16. The programme is managed by the autonomous communities, which in turn means that there can be differences in requirements, access, support amounts, or activation commitment criteria17. This measure also includes activation components and the obligation to participate in active employment measures, mainly job orientation schemes. Nevertheless, we must consider that the characteristics of the beneficiaries, who, in many cases, live in conditions of social exclusion, require social inclusion activities before or during labour integration activities.
4 The role by Public Employment Service
One of the primary functions of the autonomous public employment system (PES) is the registration of job seekers. Registration in an employment office is mandatory for individuals requesting unemployment benefits. To the extent to which this requires an active commitment by the benefits recipient, registration is a necessary requirement; however, registration does not guarantee that payments will be received. Jobseekers must comply with the “commitment to activity”, i.e., active job seeking.
The decentralisation of active labour policies has not caused any drawbacks in the coordination of the registration or receipt of benefits. As we mentioned previously, jobseekers go to the same employment office to manage their registration and to collect their unemployment benefit. Therefore the process has not affected them, and, generally, they are not aware of the redistribution of responsibilities between administrations.
16 In Arriba (2009) and Rodríguez Cabrero (2009), a review is conducted of the existing minimum wages
in the ACs.
17More information is available on the existing programmes in:
17
Although the intermediation activity is decentralised, the unemployed need to be guaranteed the possibility of moving to other locations and accessing PES vacancies in other communities and employment offices. For this reason, a significant functional coordination is important to prevent regional borders from hampering benefits. A key element in achieving this has been the modernisation of the PES. For example, many employment offices have undertaken an important effort to use the Internet to manage job vacancies and some autonomous PES have opened new employment offices as part of their plans for the modernization of the PES18.
Great care is necessary to ensure that decentralisation does not become an obstacle to the integration of a single labour market. A single market will prevent the PES from only working within each autonomous community. Information from the autonomous Public Employment Services is one of the primary data sources of labour market studies, as the information contains local, provincial, autonomic and national data.
4.1 Jobseeker contacts with the provincial and national employment services administration
In order to have access to PES services jobseekers must be registered in public employment offices. At registration, regional PES staff will interview jobseekers to determine their labour status, their needs and career aspirations. The registered data are personal and contact details, level of education and qualifications, languages, professional experience, and positions requested. After the interview, PES counsellors can recommend training courses, professional orientation actions or self-employment support. Registration can be done on-line by filling in an application form with the same information above mentioned. This information will also be accessible for SEPE.
Inscription in PES implies several obligations: the renewal on the appropriate dates (every 3 months), attend to the employment office if required, inform about changes in personal and professional information, and inform about the results of job interviews if PES is involve in the process. If jobseekers are entitled to unemployment benefits, they can apply for them in the SEPE after registration. Since passive and active policies are located at the same employment office, jobseekers can register and apply for the unemployment benefits at the same time.
Jobseekers visit employment offices mainly in a voluntary way if they need to find out information about vacancies (not only the ones registered in PES but others announced on newspapers or on-line) or to participate in active programmes (this information is also on-on-line). However, it is compulsory to visit PES if they are requested to participate in active measures or if they are selected for a job interview (PREPARA or RAI beneficiaries).
The offer of on-line services is extensive and has been promoted as a way to improve the access of jobseekers to information. At the same time, PES staff can concentrate on services that require personal attention to users (mainly PREPARA or RAI services).
SEPE public statistics do not contain information about jobseekers’ participation on active programmes. However, this data and some regional PES information are registered on public reports.
18 Suárez et al. (2012, 2014) provide a detailed description of the Spanish employment offices to show that
18 4.2 Vacancies registry in the PES
The 1994 PES reform eliminated employers’ obligations to file requests with the employment offices
to determine how many workers are necessary for particular jobs. Currently, to receive incentives for hiring workers, firms must register vacancies with the regional PES. This practice is considered to be
a “nominative” offer rather than a real intermediation activity conducted by the employment offices. Placement statistics offer complete information because they rely on data from contract files. These statistics provide information on whether job vacancies were filled, and for offers (vacancies) that were registered with Public Employment Services, the statistics indicate whether a vacancy was filled by a job seeker.
Currently, the Job seekers, positions and placements statistics (in Spanish, Estadística de demandantes de empleo, puestos de trabajo y colocaciones) allow us to distinguish among placements of active claims with prior job offers (in Spanish, colocaciones de demandas activas con oferta previa) and placements of active claims without prior job offers.
The concepts of “with prior job offer” and “without prior job offer” are related to the job offer file.
However, the concept of “job offers” should be defined first. “Prior job offers” are jobs that are offered by employers (vacancies) and registered with the PES so that the PES can ensure that those positions are filled by the best possible registered workers. Therefore, “job offers” are vacancies that are offered through PES services, and these jobs allow the PES to increase their market share. Specifically, as companies increase their trust in the PES and “job offers” are increasingly provided to the PES, the PES has more options to fill vacancies and can more easily find adequate positions for job seekers.
In terms of placements, placements of active job seekers with prior job offers are job placements that are the result of a prior job offer that was registered with the PES. On the contrary, placements of registered job seekers without prior offers are placements of job seekers when no offer was registered with the PES. Because companies are obligated to register contracts with Public Employment Services, the
placements file can also include “without prior offer” situations, which includes placements in which
the PES was directly and indirectly involved.
In Figure 2, we distinguish between the total number of placements in the Spanish labour market, i.e, the total number of new contracts signed19; the new contracts signed by jobseekers in PES and, the placements signed by jobseekers filling a vacancy registered in PES.
19 This number is a good example of the high rotation in the Spanish labour market: in 2013, 9.2% of the
19
Figure 2. PES placements and registration of new contracts
Source: Estadística de demandantes de empleo, puestos de trabajo y colocaciones. SEPE.
The vacancies that are managed by the PES are a small part of all vacancies. Companies seldom rely on the PES, as they typically use other channels to select their staff (i.e., self-nominations, print ads, head hunters and contacts). In 2013, approximately 403 thousand job offers were managed through the PES, whereas the total number of placements reached 15 million. These numbers demonstrate the limited trust companies have in the PES as a vacancy manager.
The analysis of how offers are managed is necessary to understand why the PES has a stronger presence in certain areas and not in others. This analysis can also be an important incentive for employment offices to reflect on the type of offers that are registered with them, which may help them to ensure that they are in accordance with the characteristics of the registered job seekers. Jobs that are offered through the PES typically involve low-skill work. Approximately 50% of the registered jobs are for labourers and skilled workers in the primary sector. In many cases, these jobs are related to public administration.
There is no detailed information available on the placements that result from intermediation activities by the PES. Taking into account the limitations of the data, it is possible to estimate the market share
or “penetration rate” of PES. This indicator is the ratio of placed job seekers in PES covering vacancies intermediated through PES over the total of vacancies covered by registered job seekers (i.e. placements of active claims with prior job offers over placements of active claims). According to this definition, the participation of PES in intermediation activities is low, amounting to approximately 6.4% for the 2007-2013 period (Suárez and Mayor, 2012). Nevertheless, the results are probably overestimated because we cannot be sure that placements of job seekers in PES covering vacancies registered in PES had an effective and real intermediation of PES.
The low number of placements in the PES and the weak relationship between companies and the PES relate to how intermediation was conducted before the 1994 reform. During this period, the selection of candidates for registered vacancies was based on the time of registration with the PES.
0 2.000.000 4.000.000 6.000.000 8.000.000 10.000.000 12.000.000 14.000.000 16.000.000 18.000.000 20.000.000
2007 2008 2009 2010 2011 2012 2013 New contracts
new contracts signed by jobseekers
20
The highest priorities were the long-term unemployed and recipients of unemployment benefits.
Consequently, the best candidates were seldom chosen according to the offer’s requirements, and
unemployed workers who were inappropriate for the offered jobs were often selected; these workers often had little motivation to work. These practices led to the loss of trust in the PES as an intermediary. Thus, when the obligation to request workers from the PES to fill vacancies was terminated, companies stopped using the PES.
Employers work with the PES when they aim to hire members of groups whose hiring is subsidised. In this case, evidence suggests that the PES can act in two ways. On the one hand, PES can simply manage the hiring of a person who was previously selected by an entrepreneur; on the other hand, they can conduct a real selection of the unemployed worker.
Regardless of the fact that the process of demand and supply adjustment is not entirely representative, the work of the PES goes beyond simple intermediation. For example, the aim of the PES is to offer assistance and orientation services for the unemployed as they search for companies.
5 Labour market (training and job creation) programmes
The latest data made available by the Ministry of Employment and Social Security on public spending on active policies corresponds to the year 2011. In order to analyse more recent data, we have to rely on the budgets included in annual plans of employment policies (APEM). The chart below shows data for both the initial forecast on public expenditure, published in November 2011, and those annual plans that were subsequently approved, containing a substantial reduction in the budget. The lowest expected level is recorded for 2013, ranking below 4 billion Euros. In the last APEM, published in September 2014, public expenditure is expected to increase in 2015, yet it remains at much lower levels than those recorded until 2011.
21
Figure 3. Public expenditure in active market policies in Spain (million Euro)
Source: AEL. MEYSS.
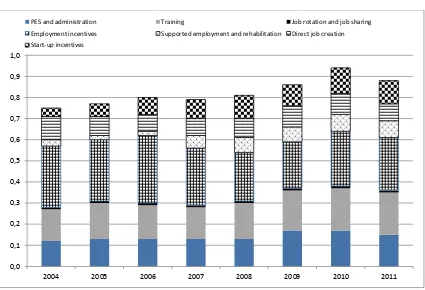
Figure 4. Public expenditure in ALMP in Spain (% GDP)
Source: Public expenditure and participant stocks on LMP. OECD.
Data from Eurostat include the distribution of ALMP expenditure by type of action, distinguishing between national and regional data (Table 11). Regional expenditure is 9% of total, although there are differences according the type of intervention. Thus, in the case of direct job creation, a quarter of the total expenditure is regional.
0 1.000 2.000 3.000 4.000 5.000 6.000 7.000 8.000 9.000 10.000
2006 2007 2008 2009 2010 2011 2012 2013 2014 2015
ALMP APEM 2011 APEM after 2011*
0,0 0,1 0,2 0,3 0,4 0,5 0,6 0,7 0,8 0,9 1,0
[image:22.595.86.511.359.649.2]22
Table 11. Expenditure in ALMP by type of administration (2011, million Euro)
National Regional Total Regional
(% over total)
Labour market services 990.9 119.2 1,110.1 10.7
Training 1,791.4 173.6 1965 8.8
Job rotation and job sharing 124.6 1.4 126 1.1
Employment incentives 2,472.5 151.8 2,624.3 5.8
Supported employment and rehabilitation 821.5 29.6 851.1 3.5
Direct job creation 478.9 161.9 640.8 25.3
Star-up incentives 1,066.3 130.1 1,196.4 10.9
7,746.1 767.6 8,513.7 9.0
Source: Labour market policy – Expenditure and participants. Eurostat.
As we have mentioned before, the ALMPs are within the competence of the autonomous communities. The resources for their financing come from the General State Budget provided for in the SEPE budget. However, each autonomous community can also dedicate its own resources to each measure.
The ALMP expenditure data are difficult to obtain given the dispersed nature of the information. Thus, there are autonomous communities where both the budget for each year and its implementation are published, while in other cases, these data cannot be found. As we have explained in the previous section, Eurostat data displays the distribution of ALMP expenditure by type of action, distinguishing between national and regional data. Unfortunately, this information is not available in any report from the Ministry of Employment and Social Security or the Employment Departments of the autonomous communities.
In 2013, changes have been made both in the lines of action within which employment policies are framed and in the criteria of territorial distribution of resources20. The Sectorial Conference on Employment and Labour Affairs agreed on a new programming assessment and financing model, which is set to define a broad range of indicators for the measurement of goal achievement, and financing is conditioned upon the meeting of these goals.
5.1 Training
The policy regarding professional training in Spain can be characterised by the decentralisation of course provision (Mato, 2002). Even before the process of decentralisation of competences in ALMP to the autonomous communities, training was provided by the autonomous communities and by the National Employment Institute (INEM) accredited collaborating centres. The autonomous communities, for their part, conducted (and still conduct) training through training centres linked to social stakeholders (unions and employers organisations), municipal councils, foundations, and various types of associations.
Currently, the subsystem of professional formation for employment is regulated by RD 395/2007. There are 3 basic types of training:
20 Order ESS/2198/2013, dated 21 November 2013, with which subsidies in the labour area financed from
23
- Demand training: company training and individual training permits. In this case, the companies have the initiative to organise training, which is financed through a rebate system on the Social Security payments made by workers and companies.
- Offer training: training promoted by public administration, social stakeholders or social entities, and private collaborators, subsidised by the Autonomous PES. These activities include training activities for the unemployed, activities with an employment commitment, training plans for employed workers, and specific programmes for persons with special training needs or with difficulties in integration or qualifications.
- Traineeship: training activities included in the formation contracts and public programmes of occupational training where workers can link training activities with professional experience in the workplace. These activities are basically Workshop Schools, craft centres, and employment workshops.
Training mainly designated for employed workers is managed through the Tripartite Foundation for Training in Employment (in Spanish, Fundación Tripartita para el Empleo), whose board is constituted by the Central State Administration though the SEPE, together with the most representative employers organisations and unions.
Training mainly aimed at unemployed workers is provided by the autonomous communities, whether through their own centres or collaborating centres. On an annual basis, a public tender is held to finance the Intersectorial and Sectorial training plans and Actions linked to professional certificates. The SEPE signs training agreements with beneficiary entities so that their Sectorial and Intersectorial plans and Actions associated with professional certificates can be developed.
The 2012 reform included the gradual implementation of dual professional training, including a set of training activities with the aim of awarding professional qualifications, combining processes of teaching and learning in the company and the training centre.
Usually, participation in training is voluntary. Although registration with the PES is a requirement, this step would not lead to reduced participation in training activities as registration is conducted immediately. The voluntary nature of training has an impact on the type of worker receiving the training. Despite the low educational level of the majority of the unemployed in Spain, individuals participating in training usually have secondary education levels (Cueto and Suárez, 2011). That is, the persons with the greatest need for training and retraining participate the least in such training schemes.
24
of evaluations for particular programmes21, concluding a small positive effect of training in line with other European programmes.
5.2 Employment incentives
The main ALMP in Spain are the employment incentives. The high level of temporality existing in our labour market has motivated all labour reforms to try to reduce it, and among other measures, bonuses for hiring have been used to promote open-ended contracts.
Throughout the years, the target groups, the amount of help, and its payment methods have been modified (a fixed amount or a reduction in social contributions of the firm to the Social Security). Furthermore, we should consider that the autonomous communities have their own support programmes, which are added to the existing programmes at the state level (Cueto, 2006).
The evaluations of the hiring bonuses have shown that this type of programmes have large deadweight and displacement effects (Toharia et al., 2008; García Pérez and Rebollo, 2009), as their positive effects are clearly limited. That is, the majority of bonus hires would have occurred even if the company were not to receive the bonus. This result can be explained, at least in part, because existing bonuses involved the majority of the active population, reaching most workers (Cueto, 2006). This feature seems to have been fixed in the 2010 to 2013 programmes, concentrating employment incentives on those groups which have the most difficult access to employment or stable employment (young people with few skills and people over 45 years of age). In fact, the Law 35/2010 included, for the first time, the qualification level of young workers as a criterion to receive the bonus. Thus,
the target group was defined as “the unemployed between 16 and 30 years of age with special employability problems: registered with the employment office for at least 12 months of the previous
18, and those who have not finished mandatory schooling.”
In February 2014, a programme called “Tarifa plana” (in English Flat rate) was implemented. Its goal was to promote open-ended hiring through the reduction of business contributions to the common Social Security contingenciesapplied for 2 years to all contracts signed between 25 February and 31 December 2014 by any company, if they constituted net employment formation. Thus, the amount paid by companies would be 100 Euros per month in the case of a full-time contract and from 75 or 50 Euros per month for the case of part-time contracts, according to the working day.
Therefore, the “tarifa plana” is applicable to any worker, regardless of his or her employment history, qualifications, or salary. Due to this characteristic, its deadweight or inertia effect is expected to be significant.
5.3 Self-employment support programmes
There are numerous measures that seek to incentivise entry of the unemployed into self-employment. Although some of these measures are directed specifically at young people (for example, individuals under 30 years of age pay a flat rate of 50 euros in Social Security contributions), the majority of the measures are directed at the unemployed population as a whole.
21 Some of these evaluations are: Cueto et al. (2010), Cueto and Mato (2009), Mato and Cueto (2008) or