The different star formation histories of blue and red spiral
and elliptical galaxies
Rita Tojeiro,
1‹Karen L. Masters,
1Joshua Richards,
2Will J. Percival,
1Steven P. Bamford,
3Claudia Maraston,
1Robert C. Nichol,
1Ramin Skibba
4and Daniel Thomas
11Institute of Cosmology and Gravitation, Dennis Sciama Building, University of Portsmouth, Burnaby Road, Portsmouth PO1 3FX, UK 2Department of Physics, Imperial College London, London SW7 2AZ, UK
3School of Physics & Astronomy, University of Nottingham, University Park, Nottingham NG7 2RD, UK
4Center for Astrophysics and Space Sciences, Department of Physics, University of California, 9500 Gilman Dr., La Jolla, San Diego, CA 92093, USA
Accepted 2013 March 14. Received 2013 March 8; in original form 2012 September 3
A B S T R A C T
We study the spectral properties of intermediate mass galaxies (M∗∼1010.7M) as a function of colour and morphology. We use Galaxy Zoo to define three morphological classes of galaxies, namely early types (ellipticals), late-type (disc-dominated) face-on spirals and early-type (bulge-dominated) face-on spirals. We classify these galaxies as blue or red according to their Sloan Digital Sky Survey (SDSS)g−rcolour and use the spectral fitting code Versatile Spectral Analyses to calculate time-resolved star formation histories, metallicity and total starlight dust extinction from their SDSS fibre spectra.
We find that red late-type spirals show less star formation in the last 500 Myr than blue late-type spirals by up to a factor of 3, but share similar star formation histories at earlier times. This decline in recent star formation explains their redder colour: their chemical and dust content are the same. We postulate that red late-type spirals are recent descendants of blue late-type spirals, with their star formation curtailed in the last 500 Myr. The red late-type spirals are however still forming stars 17 times faster than red ellipticals over the same period.
Red early-type spirals lie between red late-type spirals and red ellipticals in terms of recent-to-intermediate star formation and dust content. Therefore, it is plausible that these galaxies represent an evolutionary link between these two populations. They are more likely to evolve directly into red ellipticals than red late-type spirals, which show star formation histories and dust content closer to blue late-type spirals.
Blue ellipticals show similar star formation histories as blue spirals (regardless of type), except that they have formed less stars in the last 100 Myr. However, blue ellipticals have different dust content, which peaks at lower extinction values than all spiral galaxies. Therefore, many blue ellipticals are unlikely to be descendants of blue spirals, suggesting there may not be single evolutionary path for this group of galaxies.
Key words: surveys – galaxies: evolution – galaxies: statistics – galaxies: stellar content.
1 I N T R O D U C T I O N
It has been know for almost a century (Hubble 1922) that galaxies come in two basic types: spiral galaxies which exhibit a disc of stars, usually with spirals arms; and elliptical galaxies which are predominantly spheroidal. Furthermore, the spiral galaxies form a
E-mail: rita.tojeiro@port.ac.uk
sequence, largely defined by growing bulge size (Sc-Sb-Sa) culmi-nating in S0 (or lenticular galaxies) with extremely large bulges, which are often grouped with ellipticals (and collectively called early types).1This morphological bimodality in the galaxy
popu-lation has been the basic observation to be explained by studies of
1Throughout this paper we use ‘elliptical galaxy’ and ‘early-type galaxy’ interchangeably, noting that this class contains most S0s.
C
2013 The Authors
Published by Oxford University Press on behalf of the Royal Astronomical Society
galaxy evolution since it has been understood that the objects were galaxies external to our own.
While it had long been noted that ellipticals tended to be redder than spirals (e.g. Hubble 1926; Holmberg 1958), only quite recently it was noted that the local galaxy population demonstrates a strong bimodality in optical colour (e.g. Strateva et al. 2001; Blanton et al. 2003; Baldry et al. 2006) with a ‘blue cloud’ and ‘red sequence’, and an underpopulated ‘green valley’ in between them. This bimodality correlates extremely well with the type, or morphology of galaxies, with late types (spirals) predominantly found to be in the blue cloud, and early types on the red sequence (e.g. Strateva et al. 2001; Conselice 2006; Mignoli et al. 2009). Because of this it is now common practice to divide the galaxy population using colour on a colour–magnitude diagram.
Observations at high redshift show that the red sequence builds up over time (e.g. Bundy et al. 2006), so one of the main tasks of galaxy evolution studies has become to develop an understanding of the mechanisms by which galaxies progress from the blue cloud to the red sequence (e.g. Bell et al. 2007; Skelton, Bell & Somerville 2012). The tight relationship between colour and morphology and other supporting evidence led to popularity for the merger origin of red elliptical galaxies; however, problems with this picture are emerging (e.g. Oesch et al. 2010; Cisternas et al. 2011).
It is, of course, possible to find samples of galaxies that are the exception to the tight relationship between colour and morphology. Late-type or disc galaxies with predominantly red colours and early-type galaxies with unusually blue colours have been reported since the 70s [e.g. the work of van den Bergh (1976) on anaemic spirals in the Virgo cluster and Huchra (1977) on blue Markarian galaxies]. The sizes of these samples were small – and even if detailed number densities were difficult to obtain due to completeness issues, it was clear that these systems are rare in the local Universe. This means of course that the processes that lead to these unusual objects must either be rare, or produce these unusually coloured galaxies for only short times. In either case, both red spirals and blue ellipticals stand out as great laboratories for galaxy evolution experiments aimed at increasing our understanding of the formation of early-type galaxies and the build up of the red sequence.
With the advent of large imaging and spectroscopic surveys, stud-ies of the galaxy population entered a new era of statistical power. In particular, the Sloan Digital Sky Survey (SDSS) imaged over one quarter of the sky, and the SDSS-I and SDSS-II projects obtained spectra and redshifts for over one million galaxies in the nearby Universe (Abazajian et al. 2009). However, due to the need for vi-sual inspection to identify morphology studies of the correlation between colour and morphology remained limited in size (Fukugita et al. 2007), or had to rely on automatically measured proxies for morphology (e.g. Conselice 2006).
Galaxy Zoo (GZ; Lintott et al. 2008, 2011) extended the statis-tical power of SDSS to morphology studies by asking members of the public to visually classify the one million galaxies found in the SDSS Main Galaxy Sample (MGS; Strauss et al. 2002). GZ was motivated in part by a desire to identify a larger sample of blue ellipticals than had been found by the MOrphologically Selected Early-type galaxies from SDSS (MOSES) project (Schawinski et al. 2007a,b, 2009; Thomas et al. 2010), and indeed one of the first results showed that about 6 per cent of the low-redshift early-type galaxy populations are blue (Schawinski et al. 2009), with the frac-tion of blue ellipticals increasing to as much as 12 per cent to-wards lower mass galaxies in lower density regions (Bamford et al. 2009). That work also demonstrated the difficulty in identifying blue early types with automated structural parameter measurements.
The GZ data also revealed a significant population of red spirals (Bamford et al. 2009; Skibba et al. 2009). With a simple selection of all spiral/disc galaxies, these works suggested that around 20 per cent of these galaxies are to be found in the red sequence (with an increasing fraction in intermediate density regions). The fraction of red spirals was seen to increase with environment, even at fixed stellar mass, suggesting that some environmental process is sup-pressing star formation in spiral galaxies, beyond a simple change in the mass function with environment (Bamford et al. 2009). At around the same time Wolf et al. (2009) identified a sample of red spirals in the Space Telescope A9012/Galaxy Evolution Sur-vey (STAGES), usingHubble Space Telescopemorphologies. They demonstrated that these optically red spirals had a non-zero (but significantly lowered) star formation rate (SFR) when compared to blue spirals. All three works included highly inclined spirals in their samples.
A substantial number of normally star-forming spirals can be found in the red sequence due to the effects of inclination-dependent dust reddening (Maller et al. 2009; Masters et al. 2010a). It has also long been known that spiral galaxies with large bulges can be quite red (e.g. Roberts & Haynes 1994) and Masters et al. (2010a) demonstrated that the trend in colour due to increasing bulge size is comparable in size to inclination-dependent reddening. For these reasons, Masters et al. (2010b) selected a new sample of face-on spirals from GZ with small bulges (identified via light profile fits) to study the properties of spirals with instrinsically red discs. Of these face-on late-type spirals objects they found that about 6 per cent lay in the red sequence (increasing to 30 per cent in more bulge dominated spirals). That work showed that red spirals were not more dust reddened than similar blue spirals, and while they had less star formation than blue spirals they were not completely passive objects [which was confirmed by Cortese (2012) looking at the ultraviolet properties of the sample]. The fraction of late-type spirals in the red sequence was observed to increase substantially with stellar mass, but at all stellar masses the red spirals were observed to have older stellar populations and less recent star formation than the carefully selected late-type blue spirals comparison sample.
While red spirals are relatively rare in the local universe they may form an important evolutionary pathway between the blue cloud and red sequence. Bundy et al. (2010) used data from the COSMOS survey to study red sequence galaxies with disc-like morphology at high redshift, and concluded from the relative fractions over cosmic history, that a significant fraction of discs moving from the blue cloud to the red sequence (60 per cent) may pass through a red spiral phase. Robaina et al. (2012) compared the stellar populations of a sample of galaxies with either spirals or elliptical morphology (from GZ) which were selected to be quiescent by requiring no Hα emission in their SDSS fibre spectra and a colour–colour selection designed to remove dust reddened objects (e.g. Williams et al. 2009; Holden et al. 2012). These red spirals by definition are more passive and quiescent than the sample of Masters et al. (2010b) and, in addition, no selection on spiral bulge size was made. The work of Robaina et al. (2012) found (in agreement with the work of Thomas & Davies 2006) that the stellar populations in the two samples (in age, metallicity andα-enhancement) were statistically indistinguishable.
In this paper, we present the results of a detailed spectral analy-ses of carefully selected galaxy samples that span the full colour– morphology space, which we define using SDSS photometry and GZ public morphological classifications. We use the public data base of Tojeiro et al. (2009) to obtain minimally parametric and de-tailed star formation histories (SFHs), metallicity histories and dust
content for the galaxies in our sample. The data base of Tojeiro et al. (2009) is the product of applying the VErsatile SPectral Analyses (VESPA; Tojeiro et al. 2007) code to SDSS’s Data Release 7. The VESPAalgorithm applies full spectral fitting to find the best
com-bination of stellar populations of different ages and metallicities, modulated by a dust extinction curve, that best fits each individ-ual spectrum. The age resolution of the SFHs returned byVESPA
can help disentangle the evolutionary paths of the four samples in significantly more detail than previous studies.
This paper is organized as follows. We define and characterize our samples in Section 2, and we present our methodology in Section 3. In Section 4, we present our results. Finally, in Section 5 we summarize, discuss and conclude.
2 DATA
The SDSS I/II has imaged over one quarter of the sky using a ded-icated 2.5 m telescope in Apache Point, New Mexico (Gunn et al. 2006). For details on the hardware, software and data reduction see York et al. (2000) and Stoughton et al. (2002). In summary, the sur-vey was carried out on a mosaic CCD camera (Gunn et al. 1998) and an auxiliary 0.5 m telescope for photometric calibration. Photome-try was taken in five bands:u,g,r,iandz(Fukugita et al. 1996), and magnitudes corrected for Galactic extinction using the dust maps of Schlegel, Finkbeiner & Davis (1998). The photometric and spectroscopic scope of SDSS I/II is being increased with SDSS-III (Eisenstein et al. 2011). In this paper, we use data exclusively from SDSS-I/II, which we will refer to as SDSS for simplicity.
Galaxies were selected for spectroscopic follow-up mainly via two distinct algorithms. The MGS is a highly complete (>99 per cent)r-band selected sample of galaxies with rp>17.77 (rp is
the Petrosian magnitude; Petrosian 1976; Strauss et al. 2002) and a mean redshift ¯z≈0.1 (6 per cent of the galaxies in the sample do not have measured redshifts due to fibre collisions). The luminous red galaxy (LRG) sample targets mainly massive early-type galaxies with 0.15 < z < 0.5 and a lower number density. Spectra are obtained via optical fibres with a diameter of 3 arcsec.
The GZ project (Lintott et al. 2008)2made available images of
SDSS MGS galaxies via an internet tool and in its first version (GZ1, which ran in 2007/2008)3asked the public to classify the galaxies
simply as ‘spiral’, ‘elliptical’, ‘merger’ or ‘star/do not know’. In addition it asked them to identify the direction of rotation of the spiral arms (or indicate that they could not tell) for spiral galaxies. A median of 20 people classified each galaxy in GZ1 and these clas-sification probabilities (i.e.psprepresenting the weighted fraction of
classifiers who called the galaxy a spiral andpel: the corresponding
quantity for the elliptical classification, etc.) were made publicly available in Lintott et al. (2011). We impose a volume limit on the sample of 0.03< z <0.085 with the lower limit set to reduce the impact of peculiar velocities on distance errors, and the upper limit set to limit the redshift-dependent GZ classification bias discussed in the appendix of Bamford et al. (2009). MGS sample galaxies have
rp<17.77 so galaxies withMr<−20.17 are observable throughout this volume. In order to reduce the impact of inclination-dependent reddening moving intrinsically blue spirals observed at high incli-nations into the red spiral samples, we also impose an axial ratio limit of log (a/b)<0.2 that removes highly elongated objects (see also Masters et al. 2010a). Finally, we use only the ‘clean’ sample
2www.galaxyzoo.org
[image:3.595.310.547.55.223.2]3The original website is still available, at zoo1.galaxyzoo.org
Figure 1. The normalized distribution of colours of the six samples: late-type spiral galaxies in dashed lines, early-late-type galaxies in dot–dashed lines and elliptical galaxies in solid lines. The red and blue galaxies are shown in red and blue, respectively. The small black vertical lines show the median of each distribution, as tabulated in Table 1. We note how, even though we have only two labels for colour – red and blue – the range in colours within these labels is significant. In this paper, we used detailed spectral analyses to investigate the properties of these four samples in significantly more detail than what is allowed by using colour alone.
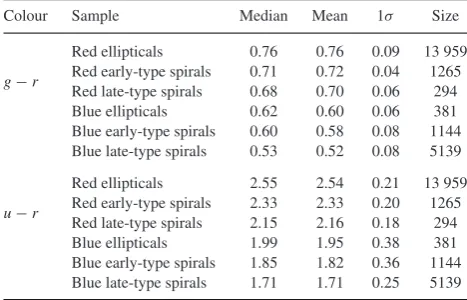
Table 1. Mean and median colours (k-corrected toz=0) of the six galaxy samples described in this paper, and the size of each sample. The full normalized colour distributions can be seen in Fig. 1.
Colour Sample Median Mean 1σ Size
Red ellipticals 0.76 0.76 0.09 13 959 Red early-type spirals 0.71 0.72 0.04 1265 g−r
Red late-type spirals 0.68 0.70 0.06 294 Blue ellipticals 0.62 0.60 0.06 381 Blue early-type spirals 0.60 0.58 0.08 1144 Blue late-type spirals 0.53 0.52 0.08 5139 Red ellipticals 2.55 2.54 0.21 13 959 Red early-type spirals 2.33 2.33 0.20 1265 u−r
Red late-type spirals 2.15 2.16 0.18 294 Blue ellipticals 1.99 1.95 0.38 381 Blue early-type spirals 1.85 1.82 0.36 1144 Blue late-type spirals 1.71 1.71 0.25 5139
of GZ (Lintott et al. 2011) to identify spirals or early-type galaxies, and remove any galaxy which does not have eitherpsp > 0.8 or
pel>0.8. Those withpsp>0.8 are identified as spirals and those
withpel>0.8 are identified as early types.
To define red or blue galaxies we use the fit to the red sequence of GZ ellipticals reported in Masters et al. (2010b) which gives (g− r)=0.73−0.02(Mr+20), with a 1σscatter of 0.1 mag4(colours and magnitudes have beenk-corrected toz=0). Following Masters et al. (2010b), we define a galaxy as ‘red’ if it has a (g−r) colour redder than 1σ blueward of the red sequence. Galaxies bluer than this we call ‘blue’. We show the normalized colour distributions (k -corrected toz=0) of all the samples used in this paper in Fig. 1 and Table 1 provides a summary. Fig. 2 shows the colour–magnitude relation and the colour–classification relation for all samples.
4SDSS recommends the use of model magnitudes to obtain the best colours of extended objects. All colours mentioned in this paper are SDSS model magnitude–colours.
[image:3.595.311.545.371.521.2]Figure 2. The colour–classification plane for the samples used in this paper. In all three panels the contours are the same, and show the location of all galaxies in the face-on (log (a/b)<0.2) volume limited ‘clean’ GZ1 sample described in Masters et al. (2010b). The solid line corresponds to the cut found in Masters et al. (2010b), and sits one standard deviation blueward of the fit to the GZ elliptical (pel>0.8) colour–magnitude relation. The different panels show the location of different morphological subsamples from GZ1 classifications in this diagram (specifically: ellipticals are defined as havingpel>0.8, spirals with psp>0.8 and visible spiral arms, and with early-/late-type spirals split byfracdev=0.5). Points are coloured red where they lie above the colour cut and blue below it.
The choice of magnitude used to construct the optical colour has an impact on which galaxies are selected as blue or red. We note that a selection based on Petrosian magnitude–colours, rather than model magnitude–colours, results in an overall shift of all galaxies towards the blue as this colour is less dominated by the bright central regions of galaxies which tend to be redder. Galaxies with the largest colour gradients have the bigger difference between model and Pet-rosian magnitude-based colours – resulting in a shift of late- and early-type spiral galaxies more to the blue than elliptical galaxies. In our specific case (when the dividing line is defined as 1σbluer than the elliptical red sequence), this reduces the size of the red spiral samples to by approximately half. The effect is the most pronounced for red early-type spirals which have the largest colour gradients. We have rerun all the analysis for this selection and can confirm that all qualitative conclusions based on the model magnitude se-lection are robust, and changes in the quantitative conclusions are negligible when compared to the uncertainty introduced by single stellar population (SSP) model selection, the effects of dust, and fibre aperture corrections.
Finally, in the spiral subset, in order to identify true spiral galaxies we require that the spiral arms were clearly visible to GZ volunteers (by imposingparms>0.8). These are then divided into two spiral
subsets: early- and type spirals, defined as follows. The late-type spirals consist of the ‘discy’ spiral subset discussed in Masters et al. (2010b), who used information from the light profile shape to remove spiral galaxies with a significant bulge component. This avoids selecting spiral galaxies that are primarily – or exclusively – red due to a strong bulge component. Nonetheless, early-type (or bulge-dominated) spirals form a significant part of the spiral-galaxy population, particularly at the higher mass end (e.g. Roberts & Haynes 1994; Bernardi et al. 2010) and it is interesting to compare our sample of late-type spirals to an equivalent sample of bulgy early-type spirals, with a prominent bulge component. Here, we define a bulge dominated spiral as a galaxy visually selected as a spiral by GZ, but having a light profile best fitted by a de Vaucouleur profile (i.e.fracdeV>0.5 from the SDSS pipeline).
These selections result in samples of 13 959 red ellipticals, 381 blue ellipticals, 5139 blue late-type spirals, 294 red late-type spirals, and finally 1144 blue early-type spirals and 1265 red early-type
spirals. Recall that all spirals are face-on and have visible arms, and therefore our six galaxy samples do not represent the full galaxy population. For example, we make no statement on edge-on galaxies of either colour, or featureless disc-like galaxies. These numbers also exclude any galaxies which have uncertain classifications from GZ (i.e.pel<0.8 andpsp<0.8). The red and blue late-type spiral
samples ate identical to those used in Masters et al. (2010b). Fig. 3 shows an example of each galaxy type.
Although we will refer to red ellipticals and red late-/early-type spirals, we note that they do not share the same colour properties: red elliptical are redder than red late- or early-type spirals. The same is true for our blue samples: blue late-type spirals are bluer than blue ellipticals or blue early-type spirals. Ing−rit remains true that red late-type spirals are redder than blue ellipticals (the overlap of the red and blue distributions in this plot is simply due to the magnitude dependence of the colour cut that defines the samples), but this separation becomes blurred inu−r. In this case, morphology alone separates these two ‘green-valley’ populations.
Fig. 4 shows the stacked spectra of the four samples. Red ellipti-cals show only very weak emission lines, but all other samples have visible [OII], Hβ, [OIII], Hα, [NII] and [SII] emission. As expected,
blue late-type spirals show the strongest lines, dominated by recent star formation. Note that emission lines arenotconsidered byVESPA,
which fits only absorption features and the shape of the continuum. The purpose of this paper is to turn these observed differences in the spectra of the galaxies into as detailed physical parameters as the data and modelling allow. Whereas these differences appear small to the eye, we will see that they are sufficient to reveal very different evolutionary scenarios behind each population of galaxies.
3 M E T H O D
We cross match the samples described above with the public data base of star formation and metallicity histories of Tojeiro et al. (2009); we find matches for over 90 per cent of the galaxies. The missing 10 per cent had too poor spectral quality to be analysed reliably (either because too many pixels were masked due to obser-vational issues, or the surface brightness of the galaxy was too low; these 10 per cent were not biased in any visible way in stellar mass
Figure 3. One example from each of the populations studied in this paper. To best showcase their morphology, these examples have some of the largest angular sizes in the samples; panels are 1× 1 arcmin square. In each panel, the green circle shows the size of the 3 arcsec spectroscopic fibre. The galaxies are: red elliptical – SDSS J153033.29−004833.5,z=0.077; blue elliptical – SDSS J111215.12+604847.8,z=0.036; red early-type spiral – SDSS J093937.98+594728.5,z=0.048; blue early-type spiral – SDSS J112816.39+005328.8,z=0.040; red late-type spiral – SDSS J144349.31+015533.5,z= 0.079; blue late-type spiral – SDSS J133406.07+014516.0,z=0.032.
Figure 4. The mean spectra of each of the six samples. All fluxes are offset to help visualize differences in emission and absorption features, and from top to bottom the spectra are ordered in mediang−rcolour (with reddest at the top).
[image:5.595.78.535.420.705.2]or redshift). The data base provides the stellar mass formed as a function of lookback time, the metallicity as a function of lookback time and the dust content of each galaxy as recovered with the full spectral-fitting codeVESPA(Tojeiro et al. 2007). In short,VESPAsplits
the lookback time of a galaxy in bins that span different ages and finds the best-fitting combination (in a least-squares sense) of SSPs of different metallicities to the observed spectra. The number of age bins is free to change according to the quality of the data, as is their width, and the metallicity is freely allowed to vary as a function of age. Additionally,VESPAfits for dust by using the mixed-slab model
of Charlot & Fall (2000), and up to two optical depth values: one for stars exclusively younger than 30 Myr (considered still to be enclosed within their birth dust cloud) and one applied to stars of all ages. In this paper, we use a one parameter dust model only, intrinsically assuming that the same dust extinction applies to stars of all ages.
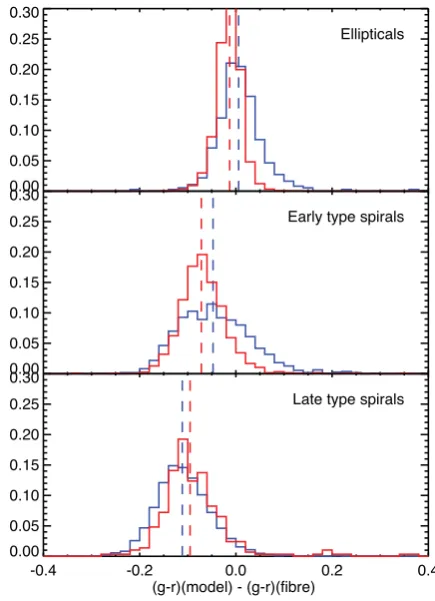
[image:6.595.62.280.368.669.2]The parameters recovered byVESPA unavoidably refer only to the region of the galaxy that falls within the 3 arcsec fibre. For a low-redshift sample such as the one we use here, this effect is im-portant – our results refer only to the central parts of the galaxies in our samples, and must be interpreted within that context. This is particularly relevant for late-type galaxies, where gradients in star formation and chemical content are more pronounced. Fig. 5 shows the difference ing−rcolour from model magnitudes (integrated photometry) and fibre magnitudes (from flux within a 3 arcsec aper-ture). The colour gradient is shallow for elliptical galaxies, and we observe no significant offset in the median colour difference (0.005 and−0.013 magnitudes for blue and red ellipticals, respectively).
Figure 5. The difference ing−rcolour using fibre and model photom-etry. A negative value corresponds to a redder colour within the 3 arcsec fibre aperture. This figure shows clearly the typical colour gradient of spiral galaxies, which is shown to be steepest for blue late-type spirals. Ellip-ticals galaxies show no significant offset from a zero mean, although the distribution of red ellipticals is slightly skewed towards negative values.
The distribution in colour difference for red ellipticals is, however, slightly tilted towards negative values (indicating a redder colour within the fibre aperture). As expected, spiral galaxies show a sig-nificant colour gradient, and they display a redder colour within the fibre aperture. The gradient is steepest for blue late-type spirals.
Total stellar masses are scaled up from the fibre aperture using the Petrosianz-band magnitude (see Tojeiro et al. 2009 for more details), and ignore the colour gradients displayed in Fig. 5. As the total stellar budget is dominated by old stellar populations in all samples, which are the dominant contributors toz-band flux, gradients in blue colours such asg−rare expected to have a minor effect in our correction for the total stellar mass. The median colour differences between model and fibre magnitudes ini−zare much smaller, with median values typically half of what is seen ing−r.
3.1 Stellar population models
Stellar population models are the building blocks of full spectral fitting analyses. They provide the spectral signature of an SSP of a given age and metallicity. To produce an SSP one must assume an initial mass function (IMF) that describes the stellar mass distribu-tion of an SSP, stellar tracks that model the different stages of stellar evolution and spectral libraries that model or empirically sample the spectral output of different types of stars. Each of these three main components is important, and affects the predicted spectrum of a single population of stars of a fixed age and metallicity.
Different authors have produced flexible and publicly available codes or sets of SSP models. They differ in one or more of the three components above, and these differences can have significant impact on science analyses (see e.g. Koleva, Prugniel & De Rijcke 2008; Tojeiro et al. 2009, 2011; Conroy & Gunn 2010; MacArthur et al. 2010). While it is important to be aware of the limitations of the SSP modelling, a number of robust conclusions can still be derived, which are not affected by these uncertainties.
To help answer some questions regarding SSP systematics, the
VESPAdata base was published using two sets of SSP models (Tojeiro
et al. 2009) and is in the process of being updated with more data and models (Tojeiro et al. in preparation). For this work, we use only publicly available results, using the SSP models of Maraston (2005, M05) and Bruzual & Charlot (2003, BC03).
With the BC03 models we adopt a Chabrier IMF (Chabrier 2003) and the Padova evolutionary tracks (Alongi et al. 1993; Bressan et al. 1993; Fagotto et al. 1994a,b; Girardi et al. 1996). We interpolate metallicities using tabulated values at:Z =0.0004, 0.004, 0.008, 0.02 and 0.05. We use the red horizontal branch models of Maraston (2005) with a Kroupa IMF (Kroupa 2001). Models are supplied at metallicities ofZ=0.0004, 0.01, 0.02 and 0.04. Both models are normalized to 1 Matt=0. M05 models are based on the BaSeL spectral library (Lejeune, Cuisinier & Buser 1997, 1998) and on empirical C,O stars (Lanc¸on & Wood 2000) for the thermally pulsating asymptotic giant branch (TP-AGB) phase; BC03 models are based on the STELIB spectral library (Le Borgne et al. 2003) in the range from 3200 to 9500 Å and in the BaSeL 3.1 library outwith this range. Note that the Chabrier and Kroupa IMFs do not differ significantly from one another.
Previous comparisons of these two sets of models have consis-tently shown that M05 give more physically motivated solutions in a variety of settings (see Tojeiro et al. 2009, 2011, where BC03 models result in unphysical dips and bumps in the average SFHs of galax-ies, and unphysical metallicity evolution trends in the populations of LRGs). In this paper, we will therefore focus our interpretation on the results obtained using the M05 models, but replicate all plots
using BC03 in Appendix A. This enables the effects of differences between SSP models to be observed, and should help with compar-ing our results to previous work (which is often based on the BC03 models).
4 R E S U LT S
4.1 Stellar masses and star formation histories
VESPArecovers the amount of star formation in up to 16 age bins, logarithmically spaced between 0.002 Gyr and the age of the Uni-verse (taken here to be 13.7 Gyr; Komatsu et al. 2011). All ages refer to the rest frame of the galaxy. We compute the present-day stellar mass in each galaxy by adding up the stellar mass formed in each age bin, taking into account stellar mass-loss to the interstel-lar medium due to stelinterstel-lar evolution (given explicitly by the stelinterstel-lar population models).
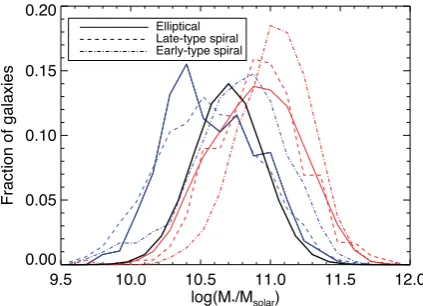
We show the distribution of stellar masses for the six samples in Fig. 6: as shown in Masters et al. (2010b), red galaxies tend to be more massive, independently of morphology. Blue early-type spi-rals, however, are more massive than any of the other blue samples. Early-type spirals (red or blue) are very rare at low stellar masses, which explains this trend – note that red early-type spirals are on average slightly more massive than blue early-type spirals. In order to retain as much signal as possible and yet compare samples that are equivalent in terms of stellar mass, we weight each galaxy sam-ple to the weighted stellar mass distribution shown by the black line in Fig. 6. The weights are computed by galaxy, and given by the ratio of the target distribution of logM∗/M(shown in the black line of Fig. 6) to a Gaussian fit to each of the population’s distribu-tions, at the stellar mass of each galaxy. Weights are normalized to add to unity for each galaxy population. In other words, our results are normalized for galaxy populations with consistent stellar mass distributions, with an effective stellar mass ofM∗∼1010.7M
. To compute the mean SFH of each galaxy sample we rebin the original 16 age bins into four wide age bins. Using just four age bins minimizes the correlations between adjacent bins of star formation, whilst still maintaining significant information about the SFH of each sample of galaxies. Note that we will work with mean star formationfractions(SFFs) – i.e. all SFHs shown add up to unity over all cosmic time.
Figure 6. The normalized distribution of stellar masses for the six samples of galaxies in this paper. The black curve shows the stellar mass distribution to which all samples are weighted, peaking and centred atM∗∼1010.7M
; this allows us to eliminate stellar mass as a driver of physical differences we observe between the four samples of galaxies.
Fig. 7 shows the SFHs of the six samples, and we give the average fraction of stellar mass formed in each age bin in Table 2. We can make the following observations.
(i) Red classical ellipticals consistently show the most steeply decaying SFH, and extremely low SFF (<1 per cent) in the two youngest bins (<0.5 Gyr).
(ii) Red late-type spirals show a lower amount of recent star formation than any of the blue samples, but only by up to a factor of 3, whereas they show around17 times more recent star formation than red ellipticals.
(iii) Red and blue late-type spirals’ histories depart from each other at young ages (<0.5 Gyr).
(iv) The SFHs of blue late- and early-type spirals are very similar. (v) Blue spirals and blue elliptical galaxies have remarkably sim-ilar SFHs, the exception being the youngest bin (<100 Myr), where blue spirals show a larger SFF by a factor of 2.
(vi) Red early-type spirals have around three times less recent star formation than red late-type spirals.
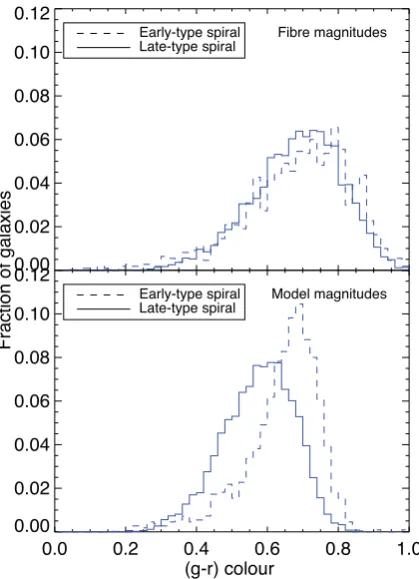
Point (iv) seems at odds with Fig. 1, which shows that blue early-and late-type spirals have different distributions ofg−rcolours. However, we note that the fibre aperture colours of the two blue spiral samples are identical – i.e. the difference in the colours from integrated photometry seen in Fig. 1 is dominated by the outer regions of the galaxies, as seen in Fig. 8. This gives a scenario where the main difference between the two samples is theextentof the bulge component, not its stellar content. The same cannot be said of the red late- and early-type spirals. Both their fibre colour and spectra suggest that early-type red spiral galaxies have weaker recent star formation (by roughly a factor of 3) than late-type red spirals.
We next look at the metallicity content of each of the four samples.
4.2 Stellar metallicity
VESPA returns a stellar metallicity for each age bin. Throughout
this paper we quote metallicity in units of the mass fraction of metals with respect to hydrogen; in these units solar metallicity is Z =0.02. Whereas in principleVESPAgives a metallicity history
for each galaxy type, the data quality is not good enough to yield reliable results – Tojeiro et al. (2009) showed in particular how metallicity was virtually unconstrained in age bins populated with small amounts of stellar mass, but was reliably recovered if one only considered the two most significant bins in terms of mass. We therefore compute a mass-weighted metallicity per galaxy, which automatically deals with this issue and retains most of the useful information. Using a mass-weighted metallicity also results in a continuous distribution of metallicity values – for age bins populated only with small amounts of stellar mass,VESPAis more likely to
[image:7.595.59.271.521.674.2]return a metallicity at the exact values provided by the SSP models, resulting in an artificially discrete distribution of metallicities.
Fig. 9 shows the distribution of mass-weighted metallicities for the six galaxy samples. We can make the following statements.
(i) Blue galaxies are on average marginally more metal poor than red galaxies. This statement is independent of morphology, but more significant for elliptical galaxies.
(ii) Red ellipticals are marginally more metal rich than red spirals. (iii) Red galaxies show a smaller spread in metallicity than blue galaxies, except in the case of late-type spirals.
(iv) There is no significant difference between metallicity distri-bution of early- and late-type spirals.
Figure 7. The average SFF as a function of lookback time (i.e. a SFH) for the six samples studies in this paper, computed in four age bins (defined in each panel by the dotted vertical lines) The error bars show the error on the mean. All values are given in Table 2. For reference, in all panels the grey lines show a SFH of the form SFR∝exp (τet), wheretis the lookback time and, from top to bottom,τeis 0.1, 0.15 and 0.3 Gyr−1– see Section 4.4 for more details.
Table 2. The mean SFF in each age bin for the six galaxy samples, as displayed in Fig. 7. The 1σcolumn gives the standard error on the mean for each bin. The SFF and 1σ errors are given in units of 10−3. To ease comparisonαis the ratio of each SFF to that of the red ellipticals.
0.01–0.074 Gyr 0.074–0.425 Gyr 0.425–2.44 Gyr 2.44–13.7 Gyr
SFF 1σ α SFF 1σ α SFF 1σ α SFF 1σ α
Red ellipticals 0.11 0.047 1 0.32 0.0052 1 33 1.0 1 966 2.89 1
Red ET spirals 0.65 0.45 5.9 2.4 0.023 7.5 36 3.8 1.1 960 8.40 0.96
Red LT spirals 1.9 1.18 17.3 5.6 0.0097 17.5 59 12 1.8 933 18.7 0.96
Blue ellipticals 2.5 1.3 22.7 11 0.30 34.4 52 11 1.6 934 17.2 0.96
Blue ET spirals 4.9 1.1 44.5 14 0.14 43.7 42 5.2 1.3 938 9.20 0.97
Blue LT spirals 6.1 1.4 55.5 11 0.34 34.4 43 12 1.3 939 19.3 0.97
The relationship between stellar mass and metallicity provides clues and constraints on the chemical enrichment processes within the galaxies. Now dropping the mass-weighting scheme used else-where in this paper, we show the mass–metallicity relation for the six samples in Fig. 10. The mass–metallicity relation seems steeper for blue galaxies independently of morphology, but this is a reflec-tion of the different range in stellar mass – the mass–metallicity relation is known to be steeper at lower masses (see Gallazzi et al. 2005, and the corresponding yellow line in both panels). There is an offset in metallicity between our results and the mass–metallicity relation found in Gallazzi et al. (2005). This is explained by the different stellar population models in the two analyses – Gallazzi et al. use BC03. See Fig. A4 for a comparison with the two sets of results using the BC03 models – the agreement is visibly good. Given the intrinsic scatter and the limited sizes of the samples, we observe no significant difference in the mass–metallicity relation of the six samples.
4.3 Dust
We model dust extinction using the mixed-slab model of Char-lot & Fall (2000) and an extinction curve of the form τλ =
τISM(λ/5500 Å)−0.7, whereτISMis the optical depth at a wavelength
of 5500 Å, and the only free parameter of our dust model. Fig. 11 shows the distribution ofτISMvalues for the six samples.
We can make the following statements.
(i) On average spiral galaxies are dustier than elliptical galaxies independently of colour.
(ii) The dust distribution of red and blue late-type spirals is re-markably similar, indicating that dust is unlikely to be the reason red spirals are red (recall these are face-on spirals only).
(iii) Blue ellipticals are dustier than red ellipticals but they show a bimodal distribution in dust extinction, with a highly obscured population that is present but less common in the population of red ellipticals.
Figure 8. The observedg−rcolours within the 3 arcsec fibre aperture (top panel) and computed using integrated photometry (bottom) for blue early- and late-type spiral galaxies. The fibre colour is nearly identical for the two samples of spiral galaxies, indicating the difference seen in integrated photometry colour in Fig. 1 is dominated by the outer regions of the galaxies. Coupled with the results in Fig. 7, these results suggest that the main difference between early- and late-type spirals lies in theextentof the bulge component, rather than in its stellar composition.
(iv) Red early-type spirals have a lower average dust extinction than blue late-type spirals (τISM≈0.8 versusτISM≈1, respectively).
This is due to the presence of a population of objects with very low extinction in the red population, which is not seen in the blue early-type spirals.
In the red population, we see a distinct increase of the presence of low-extinction objects with growing bulge size: late-type spirals, selected to havefracdeV < 0.5, have ∼10 per cent of objects withτISM < 0.5, with this fraction increasing just over 30 per
cent in early-type spirals (fracdeV>0.5) and to over 60 per cent in ellipticals. This result is consistent with larger bulges having a composition with decreasing dust extinction.
The small number of blue ellipticals (381) makes it difficult to reliably disentangle the dust bimodality observed in the upper panel using other properties. Stellar mass does not seem to be a factor, as the mass weighting brings little change to the dust distribution. A visual inspection of the objects did not uncover any obvious dif-ference between the blue ellipticals with high and low obscuration, nor does dust have a notable dependence on colour gradients.
4.4 Colours
The results in the previous section quantify differences in the phys-ical properties of the six samples of galaxies we consider. To create
Figure 9. The distribution of the mass-weighted stellar metallicity for red and blue galaxies for all three morphological samples, using M05 modelling. The vertical dashed line shows the mean value of each distribution. The error bars are Poisson errors.
some meaningful context in this section we consider how these physical properties affect the observed colours of galaxies.
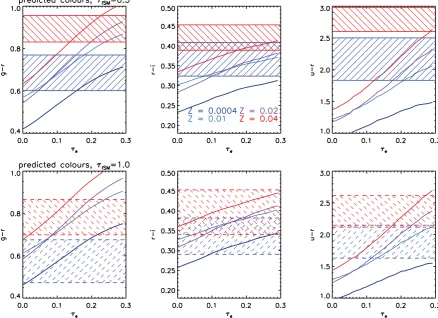
Fig. 12 shows the predicted observedg− r, r − i and u− r colours as a function of SFH and metallicity, computed using the M05 models. We parametrize the SFH with an exponentially decaying form as SFR∝ exp (τet), wheretis the lookback time in Gyr, and which loosely follows the behaviour of our samples. This is too simplistic a model to allow good fits in all cases, but it allows us to study the predicted colours as a function of a single, smooth parameter that roughly bridges the gap between the SFHs of our samples. For reference we plot the SFH corresponding toτe= 0.1, 0.15 and 0.3 Gyr−1as the grey lines in Fig. 7. Blue galaxies
haveτe≈0.1, red late-type spiralsτe≈0.15 and red early types
τe≈0.3.
Focusing first on red and blue ellipticals, the top-left panel of Fig. 12 shows that the expected difference in colour betweenτe∼ 0.1 and 0.3 is sufficient to explain the observed differences in colour at all metallicities except the very low or very high end. In other words, star formation alone (and in particular, recent star forma-tion) is sufficient to explain the different classification of these two samples.
The SFHs of blue (τe ∼ 0.1) and red (τe ∼ 0.15) late-type spirals are much more similar, but Fig. 12 shows that even such small differences can yield measurably different observed colours, at least ing−rthe colour that drives our classifications (see bottom-left panel). Our toy model suggests that blue early types are either slightly younger or more metal poor than the fully fitted SFHs presented in the previous section: indeed, our toy model poorly fits blue early types at ages younger than 100 Myr. Nonetheless, the take home message is that even small differences in recent SFRs can visibly impact the colours of the samples, and galaxy colour– classification.
[image:9.595.325.535.56.321.2]Figure 10. Stellar mass versus metallicity relation for the six samples. Left-hand side shows blue galaxies and right-hand side shows red galaxies. The orange solid and dashed lines show the stellar mass–metallicity relation measured by Gallazzi et al. (2005). The offset in metallicity between our mass versus metallicity relationship and that of Gallazzi et al. is explained by the stellar population models – Gallazzi et al. use BC03, and this offset is much reduced when we use the same set of models (see Fig. A4).
Note that the differences in metallicity measured in Section 4.2 are too small to produce visible differences in colour (given the scatter in colour and size of the sample).
5 S U M M A RY A N D C O N C L U S I O N S
We have used VESPAto study the stellar, chemical and dust
con-tent of six sample of galaxies, defined according to their colour and morphology. Our findings can be summarized in the following points.
(i) Red ellipticals consistently show the most steeply decaying SFH and extremely low SFF (<1 per cent) in the two youngest bins (<0.5 Gyr). They are the most metal rich of the six samples and display the lowest amount of dust obscuration. These results are consistent with red ellipticals having the reddest rest-frame colours, and with the typical view of early-type galaxies as being old, metal rich and dust-free objects.
(ii) Red late-type (disc-dominated) spirals show a lower amount of recent star formation than any of the blue samples, by up to a factor of 3. However, they show around17 times more recent star formation than red ellipticals. Red and blue spirals’ SFHs depart significantly only at young ages (<0.5 Gyr). The redder colour of red late-type spiral galaxies (when compared to blue late-type spirals) can be explained simply by this small difference in recent star formation. Red late-type spirals have a similar average metallicity
than blue spirals, but a larger scatter in metallicity values. The dust distribution of blue and red spirals, when observed in face-on orientation, is incredibly similar – both samples are highly obscured compared to ellipticals.
(iii) Blue ellipticals have remarkably similar fibre SFHs to blue spirals, the exception being the youngest bin (<100 Myr), where blue spirals show a larger SFF by a factor of 2. Blue spirals and ellipticals do not differ significantly in their chemical content, but they display largely different dust distributions – in the case of blue ellipticals this seems bimodal, with one population of dust-free objects (similar to red ellipticals) and one population of highly obscured objects (similar to blue spirals). We could not disentangle this bimodality using stellar mass, colour gradients, metallicity or visual inspection.
(iv) Blue late-type (disc-dominated) spirals have the flattest SFH, and the most recent star formation. They are on average the most metal poor of the four populations, and are on average more dust obscured than blue ellipticals.
(v) Red early-type (bulge-dominated) spirals have three times less recent star formation than red late-type spirals, and slightly lower dust extinction: in both cases they sit in between red late-type spiral and red elliptical galaxies.
(vi) Blue early-type (bulge-dominated) spirals have identical fi-bre SFHs to blue late-type spirals, in spite of the fact they display different colours in integrated photometry (blue early-type spirals are redder). Their fibre colour is, however, remarkably similar and
Figure 11. The distribution of the optical depth τISM for red and blue galaxies for all three morphological samples, using M05 modelling. The vertical dashed line shows the mean value of each distribution. The error bars are Poisson errors.
suggesting that the change in integrated photometry colours is driven by the regions outwith the radius probed by the spectro-scopic fibre, i.e. the extent of the bulge in these two samples differs, with it being more extended (but not necessarily of different stellar content) in early-type blue spirals.
Our results show that red late-type spiral galaxies are red because of a genuine decline in SFH in the last 0.5 Gyr: their SFH prior to that point, dust and chemical content is similar to blue late-type spirals. This is consistent with a scenario where red late-type spirals share a common evolutionary path with blue late-type spirals, and whatever mechanism causes a diminishing of their SFR must be gentle enough not to disturb their morphology, nor to substantially impact the dust and chemical content. According to our modelling,
this process must last around 0.5 Gyr– if it were significantly shorter (less than 100 Myr) or longer (more than 1 Gyr) we would expect the measured SFHs to depart significantly either at a younger or older age bin. Due to our stellar mass weighting scheme, our results effectively refer to a stellar massM∗∼1010.7M
, but it remains true that red late-type spirals are on average more massive than blue late-type spirals (see Fig. 6, and barring any selection effects not considered), suggesting that more massive blue late-type spirals must be more effective at turning red, if they do so at all. This is in agreement with the results of Skibba et al. (2009) and Bamford et al. (2009), who – albeit working on a sample of red spirals that included both highly inclined and bulge-dominated objects – found that red spirals are predominantly found in denser environments, which in turn is correlated with stellar (and halo) mass. Additionally they found that, at fixed stellar mass, environment drives colour more strongly than it drives morphology. They argue that colour changes due to environmental effects (‘strangulation’, ‘harassment’, etc.) affect colour in a shorter time-scale than they affect morphology; this is consistent with the results in this paper.
Whereas naively one could constrain the transition period be-tween blue late-type spiral and blue elliptical galaxies using an argument similar to the above, we note that this comparison is hin-dered by fibre aperture effects, which are much more pronounced for the spiral population relatively to the ellipticals (Fig. 5). The global recent-to-intermediate star formation of late-type spiral is likely larger than what we measure through the fibre, making it harder to discern how much of a history the two populations truly share. Whereas the two share a similar chemical content, they have sufficiently different dust contents to suggest that blue ellipticals are likely not the result of a direct transition from blue late-type spi-rals, or at least not exclusively. Indeed, it may be that the path that leads to the formation of blue ellipticals is not unique – the broad (marginally bimodal) dust distribution of this population leaves room for a scenario where blue ellipticals can come to be as rejuve-nated red ellipticalsoras truncated blue late- or early-type spirals (with this process leading to a change of morphology via something like a merger, but not truncating the star formation completely – see also Schawinski et al. 2009).
It is interesting that red elliptical galaxies lie isolated within the parameter space we explore – they uniformly show low dust extinction values, have extremely low recent-to-intermediate SFRs, and a very uniform distribution in metal content, that peaks at the largest value of all the populations we study. This is of course consistent with the well-known lower scatter of the red sequence when compared to the blue cloud; our work simply puts this result in terms of physical properties, rather than observed colours and magnitudes. From an evolutionary point of view, it suggests they are the end result of an evolutionary path that stabilized over at least 3 Gyr (and likely longer, but which we cannot probe with the time resolution used here), and that any mild events of star formation since then have not disrupted the galaxy’s morphology, dust or chemical composition in a significant way.
Finally, red early-type spiral galaxies lie between red late-type spirals and red ellipticals in terms of recent-to-intermediate SFR, dust content and morphology, making a scenario where upon they mark a transitional period that precedes red ellipticals very plausi-ble. We note they make better candidates for such an evolutionary link than red late-type spirals, which show a SFH and dust content much more similar to blue late-type spirals and very unlike red ellipticals. This is in agreement with Masters et al. (2010b) who, based on the fraction of galaxies with bars, suggest that early-type red spirals are more likely to evolve into red ellipticals than late-type red spirals.
A realistic galaxy evolution description likely involves a more complex link between these six populations of galaxies – a detailed study using the evolution of their number density, coupled with detailed fossil-record SFHs (that allow linking populations across different redshifts – see e.g. Tojeiro & Percival 2011) would provide further insight on to how all these links come together to produce the observed Universe; this is the topic of future work. The colour– classification in this paper is based on model magnitudes, but we note that qualitatively all of the conclusions we present in this section are robust to a change from model to Petrosian magnitudes.
AC K N OW L E D G E M E N T S
We would like to thank the anonymous referee for useful comments that led to visible improvements to this paper. RT and WJP are thankful for support from the European Research Council. JR is thankful for a Ogden Trust summer internship. KLM acknowledges
Figure 12. Smooth curves show the predictedobserved g−r(left),r−i(centre) andu−r(right) colours of our toy models of star formation for different metallicity values, assumingτISM=1 (top row) andτISM=0.5 (bottom row), and computed using the M05 SSP models. The age–metallicity degeneracy is clearly visible in this diagram. The horizontal bands show where the observed colours of the four samples lie (regions within±1σof the mean observed colour). In accordance to the extinction values found for each sample, on the top row we show the observed early-type galaxies, and on the bottom late-type galaxies. Values ofτeandZthat overlap with the regions of observed colour are the ones able to describe the samples, assuming our simple toy model.
funding from The Leverhulme Trust as a 2010 Early Career Fellow. SPB gratefully acknowledges an STFC Advanced Fellowship.
This publication has been made possible by the participa-tion of more than 160 000 volunteers in the first phase of the GZ project. Their contributions are individually acknowledged at http://www.galaxyzoo.org/volunteers.
Funding for the SDSS and SDSS-II has been provided by the Al-fred P. Sloan Foundation, the Participating Institutions, the National Science Foundation, the US Department of Energy, the National Aeronautics and Space Administration, the Japanese Monbuka-gakusho, the Max Planck Society and the Higher Education Funding Council for England. The SDSS website is http://www.sdss.org/. The SDSS is managed by the Astrophysical Research Consortium for the Participating Institutions. The Participating Institutions are the American Museum of Natural History, Astrophysical Institute Potsdam, University of Basel, University of Cambridge, Case West-ern Reserve University, University of Chicago, Drexel University, Fermilab, the Institute for Advanced Study, the Japan Participation Group, Johns Hopkins University, the Joint Institute for Nuclear As-trophysics, the Kavli Institute for Particle Astrophysics and Cosmol-ogy, the Korean Scientist Group, the Chinese Academy of Sciences (LAMOST), Los Alamos National Laboratory, the Max-Planck-Institute for Astronomy (MPIA), the Max-Planck-Max-Planck-Institute for As-trophysics (MPA), New Mexico State University, Ohio State Univer-sity, University of Pittsburgh, University of Portsmouth, Princeton
University, the United States Naval Observatory and the University of Washington.
R E F E R E N C E S
Abazajian K. N. et al., 2009, ApJS, 182, 543
Alongi M., Bertelli G., Bressan A., Chiosi C., Fagotto F., Greggio L., Nasi E., 1993, A&AS, 97, 851
Baldry I. K., Balogh M. L., Bower R. G., Glazebrook K., Nichol R. C., Bamford S. P., Budavari T., 2006, MNRAS, 373, 469
Bamford S. P. et al., 2009, MNRAS, 393, 1324
Bell E. F., Zheng X. Z., Papovich C., Borch A., Wolf C., Meisenheimer K., 2007, ApJ, 663, 834
Bernardi M., Shankar F., Hyde J. B., Mei S., Marulli F., Sheth R. K., 2010, MNRAS, 404, 2087
Blanton M. R. et al., 2003, ApJ, 594, 186
Bressan A., Fagotto F., Bertelli G., Chiosi C., 1993, A&AS, 100, 647 Bruzual G., Charlot S., 2003, MNRAS, 344, 1000 (BC03)
Bundy K. et al., 2006, ApJ, 651, 120 Bundy K. et al., 2010, ApJ, 719, 1969 Chabrier G., 2003, PASP, 115, 763 Charlot S., Fall S. M., 2000, ApJ, 539, 718 Cisternas M. et al., 2011, ApJ, 726, 57 Conroy C., Gunn J. E., 2010, ApJ, 712, 833 Conselice C. J., 2006, ApJ, 638, 686 Cortese L., 2012, A&AS, 543, A132 Eisenstein D. J. et al., 2011, AJ, 142, 72
Fagotto F., Bressan A., Bertelli G., Chiosi C., 1994a, A&AS, 104, 365 Fagotto F., Bressan A., Bertelli G., Chiosi C., 1994b, A&AS, 105, 29 Fukugita M., Ichikawa T., Gunn J. E., Doi M., Shimasaku K., Schneider
D. P., 1996, AJ, 111, 1748 Fukugita M. et al., 2007, AJ, 134, 579
Gallazzi A., Charlot S., Brinchmann J., White S. D. M., Tremonti C. A., 2005, MNRAS, 362, 41
Girardi L., Bressan A., Chiosi C., Bertelli G., Nasi E., 1996, A&AS, 117, 113
Gunn J. E. et al., 1998, AJ, 116, 3040 Gunn J. E. et al., 2006, AJ, 131, 2332
Holden B. P., van der Wel A., Rix H.-W., Franx M., 2012, ApJ, 749, 96 Holmberg E., 1958, Medd. Lunds Astron. Obs. Ser., 136, 1
Hubble E. P., 1922, ApJ, 56, 162 Hubble E. P., 1926, ApJ, 64, 321 Huchra J. P., 1977, ApJS, 35, 171
Koleva M., Prugniel P., De Rijcke S., 2008, Astron. Nachr., 329, 968 Komatsu E. et al., 2011, ApJS, 192, 18
Kroupa P., 2001, MNRAS, 322, 231
Lanc¸on A., Wood P. R., 2000, A&AS, 146, 217 Le Borgne J.-F. et al., 2003, A&AS, 402, 433
Lejeune T., Cuisinier F., Buser R., 1997, A&AS, 125, 229 Lejeune T., Cuisinier F., Buser R., 1998, A&AS, 130, 65 Lintott C. J. et al., 2008, MNRAS, 389, 1179
Lintott C. et al., 2011, MNRAS, 410, 166
MacArthur L. A., McDonald M., Courteau S., Jes´us Gonz´alez J., 2010, ApJ, 718, 768
Maller A. H., Berlind A. A., Blanton M. R., Hogg D. W., 2009, ApJ, 691, 394
Maraston C., 2005, MNRAS, 362, 799 (M05) Masters K. L. et al., 2010a, MNRAS, 404, 792 Masters K. L. et al., 2010b, MNRAS, 405, 783 Mignoli M. et al., 2009, A&AS, 493, 39 Oesch P. A. et al., 2010, ApJ, 714, L47
Panter B., Heavens A. F., Jimenez R., 2003, MNRAS, 343, 1145 Petrosian V., 1976, ApJ, 209, L1
Robaina A. R., Hoyle B., Gallazzi A., Jimenez R., van der Wel A., Verde L., 2012, MNRAS, 427, 3006
Roberts M. S., Haynes M. P., 1994, ARA&A, 32, 115 Schawinski K. et al., 2007a, ApJS, 173, 512
Schawinski K., Thomas D., Sarzi M., Maraston C., Kaviraj S., Joo S.-J., Yi S. K., Silk J., 2007b, MNRAS, 382, 1415
Schawinski K. et al., 2009, MNRAS, 396, 818
Schlegel D. J., Finkbeiner D. P., Davis M., 1998, ApJ, 500, 525 Skelton R. E., Bell E. F., Somerville R. S., 2012, ApJ, 753, 44 Skibba R. A. et al., 2009, MNRAS, 399, 966
Stoughton C. et al., 2002, AJ, 123, 485 Strateva I. et al., 2001, AJ, 122, 1861
Strauss M. A. et al., 2002, AJ, 124, 1810
Thomas D., Davies R. L., 2006, MNRAS, 366, 510
Thomas D., Maraston C., Schawinski K., Sarzi M., Silk J., 2010, MNRAS, 404, 1775
Tojeiro R., Percival W. J., 2011, MNRAS, 417, 1114
Tojeiro R., Heavens A. F., Jimenez R., Panter B., 2007, MNRAS, 381, 1252 Tojeiro R., Wilkins S., Heavens A. F., Panter B., Jimenez R., 2009, ApJS,
185, 1
Tojeiro R., Percival W. J., Heavens A. F., Jimenez R., 2011, MNRAS, 413, 434
van den Bergh S., 1976, ApJ, 206, 883
Williams R. J., Quadri R. F., Franx M., van Dokkum P., Labb´e I., 2009, ApJ, 691, 1879
Wolf C. et al., 2009, MNRAS, 393, 1302 York D. G. et al., 2000, AJ, 120, 1579
[image:13.595.321.535.294.446.2]A P P E N D I X A : R E S U LT S O B TA I N E D W I T H B C 0 3 S T E L L A R P O P U L AT I O N M O D E L S
Figure A1. The normalized distribution of stellar masses for blue elliptical (blue solid), blue spiral (blue dashed), red elliptical (red solid) and red spiral (red dashed) galaxies as per the data base of Tojeiro et al. (2009), computed using the SSP models of BC03. This figure shows clearly how stellar mass follows colour, rather than morphology. The black curve shows the stellar mass distribution to which all samples are weighted, peaking and centred atM∗∼1010.7M
; this allows us to eliminate stellar mass as a driver of physical differences we observe between the four samples of galaxies.
Figure A2. Same as Fig. 7, but computed using the BC03 SSP models. The striking dip seen at ages of roughly 1 Gyr in the average SFFs is a common feature of these models, and also seen in Panter, Heavens & Jimenez (2003) and Tojeiro et al. (2009).
Figure A3. The distribution of the mass-weighted stellar metallicity for red and blue galaxies for all three morphological samples, using BC03 modelling. The vertical dashed line shows the mean value of each distribution. The error bars are Poisson errors. The scatter is visibly larger in the case of BC03 models, and the mass-weighted metallicities are on average larger. This trend was already seen in Tojeiro et al. (2009, 2011), especially at solar metallicities and above.
[image:14.595.186.422.345.663.2]Figure A4. Stellar mass versus metallicity relation for the four samples. Left-hand side shows blue galaxies and right-hand side red galaxies. The orange solid and dashed lines show the stellar mass–metallicity relation measured by Gallazzi et al. (2005). The mass–metallicity relation is tighter in the case of the M05 models for all galaxy samples.
Figure A5. The distribution of the optical depthτISMfor red and blue galaxies for all three morphological samples, using BC03 modelling. The vertical dashed line shows the mean value of each distribution. The error bars are Poisson errors.
This paper has been typeset from a TEX/LATEX file prepared by the author.
[image:15.595.193.421.363.674.2]