The identification of post-starburst galaxies at
z
∼
1 using
multiwavelength photometry: a spectroscopic verification
David T. Maltby,
1‹Omar Almaini,
1Vivienne Wild,
2,3Nina A. Hatch,
1William G. Hartley,
4Chris Simpson,
5Ross J. McLure,
3James Dunlop,
3Kate Rowlands
2and Michele Cirasuolo
61School of Physics and Astronomy, University of Nottingham, University Park, Nottingham NG7 2RD, UK 2SUPA, School of Physics and Astronomy, University of St Andrews, North Haugh, St Andrews KY16 9SS, UK 3SUPA, Institute for Astronomy, University of Edinburgh, Royal Observatory, Blackford Hill, Edinburgh EH9 3HJ, UK 4ETH Z¨urich, Institut f¨ur Astronomie, Wolfgang-Pauli-Str. 27, CH-8093 Z¨urich, Switzerland
5Gemini Observatory, Northern Operations Center, 670 N. A’ohoku Place, Hilo, HI 96720, USA 6UK Astronomy Technology Centre, Royal Observatory, Blackford Hill, Edinburgh EH9 3HJ, UK
Accepted 2016 March 30. Received 2016 March 29; in original form 2015 December 22
A B S T R A C T
Despite decades of study, we still do not fully understand why some massive galaxies abruptly switch off their star formation in the early Universe, and what causes their rapid transition to the red sequence. Post-starburst galaxies provide a rare opportunity to study this transition phase, but few have currently been spectroscopically identified at high redshift (z >1). In this paper, we present the spectroscopic verification of a new photometric technique to identify post-starbursts in high-redshift surveys. The method classifies the broad-band optical–near-infrared spectral energy distributions (SEDs) of galaxies using three spectral shape parameters (supercolours), derived from a principal component analysis of model SEDs. When applied to the multiwavelength photometric data in the UKIDSS Ultra Deep Survey, this technique identified over 900 candidate post-starbursts at redshifts 0.5< z <2.0. In this study, we present deep optical spectroscopy for a subset of these galaxies, in order to confirm their post-starburst nature. Where a spectroscopic assessment was possible, we find the majority (19/24 galaxies;
∼80 per cent) exhibit the strong Balmer absorption (Hδ equivalent widthWλ >5 Å) and Balmer break, characteristic of post-starburst galaxies. We conclude that photometric methods can be used to select large samples of recently-quenched galaxies in the distant Universe.
Key words: methods: statistical – galaxies: fundamental parameters – galaxies: high-redshift – galaxies: photometry – galaxies: statistics – galaxies: stellar content.
1 I N T R O D U C T I O N
Deep surveys have transformed our view of the distant Universe, allowing us to observe the process of galaxy assembly over the last 13 billion years of cosmic history. However, despite much progress, many crucial aspects of galaxy formation and evolution remain poorly understood. In particular, we still do not understand the mechanisms responsible for quenching star formation in massive galaxies, as required to produce both the ‘red nuggets’ observed at high redshift (e.g. Trujillo et al.2006) and the quiescent galaxies we observe today (e.g. Baldry et al.2004).
To terminate star formation in galaxies, several mechanisms have been proposed. These include, gas stripping (e.g. Gunn & Gott1972), morphological quenching (Martig et al.2009), AGN or starburst-driven superwinds (Hopkins et al.2005; Diamond-Stanic et al. 2012), shock heating of infalling cold gas by the hot halo
E-mail:[email protected]
(Dekel & Birnboim2006), and an exhaustion of the gas supply (e.g. Larson, Tinsley & Caldwell1980). Furthermore, to keep star forma-tion suppressed, radio-mode AGN feedback may also be required (Best et al.2005).
To disentangle the relative roles of these processes at high red-shift, we require a large sample of galaxies that are caught in the act of transformation. The rare class of ‘post-starburst (PSB)’ galaxies is potentially ideal for such studies. Otherwise known as ‘E+A’ or ‘k+a’ galaxies, PSBs represent transition systems in which a major burst of star formation was quenched within the last few hun-dred Myr, leaving a characteristic A-star imprint of strong Balmer lines on an otherwise passive-looking galaxy spectrum (Dressler & Gunn1983; Wild et al.2009). However, due to their very red spectral energy distributions (SEDs) and intrinsic short-lived na-ture, only a handful have been spectroscopically identified atz >1; e.g. 3 galaxies in zCOSMOS (Vergani et al.2010) and 5 galaxies in the spectroscopic component of the Ultra Deep Survey (UDSz; Wild et al.2014).
2016 The Authors
at University of Nottingham on January 12, 2017
http://mnrasl.oxfordjournals.org/
In order to increase the number of PSB galaxies identified at high redshift, two photometric methods have recently been developed. Whitaker et al. (2012) use medium-band infrared imaging to identify ‘young red-sequence’ galaxies via rest-frameUVJcolour–colour di-agrams. Wild et al. (2014), however, use an alternative approach and classify galaxies based on a principal component analysis (PCA) of their SEDs. When this latter method is applied to the multiwave-length photometry of the Ultra Deep Survey (UDS; Almaini et al., in preparation), it transpires that just three shape parameters (i.e. eigenspectra) provide a compact representation of a wide variety of SED shapes. This enables the identification of several galaxy populations, including PSBs which have formed>10 per cent of their mass in a recently-quenched starburst event.
Using photometry for over 130 000K-band selected UDS galax-ies, this PCA method has identified over 900 candidate PSBs at 0.5< z <2.0 (Wild et al., in preparation). Such a large sample of high-redshift PSBs will enable a wide range of scientific studies and provide crucial insight into the quenching of star formation in galaxies at high redshift. At present, however, the spectroscopic confirmation rests on a limited number of low-resolution spectra from UDSz (5 PSBs; Wild et al.2014). In this study, we provide a more robust assessment using medium-resolution deep-optical spectroscopy for a much larger sample of PSB candidates. This pro-vides the crucial validation required to unlock a wealth of science on high-redshift PSBs selected from the UDS and other photometric surveys.
The structure of this paper is as follows. In Section 2, we give a brief description of the UDS data and VIMOS spectroscopy upon which this work is based, outlining the photometric identification of PSB candidates and our selection of spectroscopic targets in Section 2.2. In Section 3, we present the reduced VIMOS spectra for PSB candidates and classify the galaxies using standard spectroscopic criteria. Finally, we draw our conclusions in Section 4.
2 D E S C R I P T I O N O F T H E DATA
2.1 The UDS
The UDS is the deepest component of the UKIRT (United King-dom Infra-Red Telescope) Infrared Deep Sky Survey (UKIDSS; Lawrence et al.2007) and the deepest degree-scale near-infrared survey to date.1The survey comprises extremely deep UKIRTJHK
photometry, covering an area of 0.77 deg2. The work presented here is based on the eighth UDS data release (DR8) where the limiting depths areJ=24.9;H=24.4 andK=24.6 (AB; 5σ in 2 arcsec apertures). In addition, the UDS is complemented by extensive mul-tiwavelength observations including deep-opticalBVRiz photom-etry from the Subaru–XMM–NewtonDeep Survey (SXDS; Furu-sawa et al.2008) and mid-infrared coverage (3.6 and 4.5μm) from theSpitzerUDS Legacy Program (SpUDS; PI: Dunlop). Further-more, deepu-band photometry is also available from the Canada– France–Hawaii Telescope (CFHT) Megacam. The complete extent of the UDS field with full multiwavelength coverage (optical–mid-infrared) is∼0.62 deg2. For a complete description of these data,
including a description of the catalogue construction, see Hartley et al. (2013) and Simpson et al. (2012). In this work, where appro-priate, we use the photometric redshifts described in Simpson et al. (2013).
1http://www.nottingham.ac.uk/astronomy/UDS/
2.2 The supercolour method and target selection
To identify high-redshift PSB candidates in the UDS, we use the PCA technique of Wild et al. (2014). We provide a brief description of the method below.
Wild et al. (2014) begin by building a large library of∼44 000 ‘stochastic burst’ model SEDs, generated from Bruzual & Char-lot (2003) stellar population synthesis models with stochastic star-formation histories. These model SEDs are convolved with the pho-tometric filter set of the UDS and progressively shifted to cover the redshift range of interest (e.g. 0.5< z <2.0). A PCA analysis is then applied to all model SEDs in order to establish a mean SED (mλ) and a series ofpeigenvectors (eigenspectra;eiλ) from which any normalized SED (fλ/n) can be approximately reconstructed:
fλ
n =mλ+
p
i=1
aieiλ. (1)
The principal component amplitudes (ai), indicate the ‘amount’ of each eigenspectrum contained within a galaxy’s SED and can be used to uniquely define its shape. Referred to assupercolours (SCs), these amplitudes combine data from multiple filters using an optimally defined weighting scheme (the eigenspectra) and allow for all key information available from multiwavelength photometry to be retained. In fact, it transpires that only the first three SCs (a1=SC1;a2=SC2;a3=SC3) are required in order to provide a
compact representation of a wide variety of SED shapes, accounting for>99.9 per cent of the variance in the models of Wild et al. (2014). For these SCs, several useful correlations exist with the star-formation histories of the model SEDs. For example, SC1 correlates with both mean stellar age and dust content; SC2 and SC3 correlate with metallicity; and SC2 correlates with the fraction of stellar mass formed in bursts in the last Gyr. These key correlations enable the separation of a tight red-sequence from star-forming galaxies and also help identify three unusual populations: very dusty star-forming galaxies, metal poor quiescent dwarf galaxies, and PSBs that have formed>10 per cent of their mass in a recently quenched starburst (see Wild et al.2014).
For real galaxies, a PCA analysis is used to project their SEDs into SC space, with a comparison to the SCs of the model SEDs used in order to determine their probable nature (e.g. red-sequence, star-forming, PSB). The benefit of this approach is that no model SED orK-correction is assumed in determining the SCs of the actual galaxies themselves. In the UDS, this PCA analysis was performed using 8 UDS filters (VRizJHK, 3.6µm), and on all galaxies with KAB<24 and 0.5< z <2.0 (48 713 galaxies; Wild et al., submitted).
From this analysis, a parent sample of 4249 red-sequence galaxies, 39 970 star-forming galaxies and 921 PSB candidates have been identified.
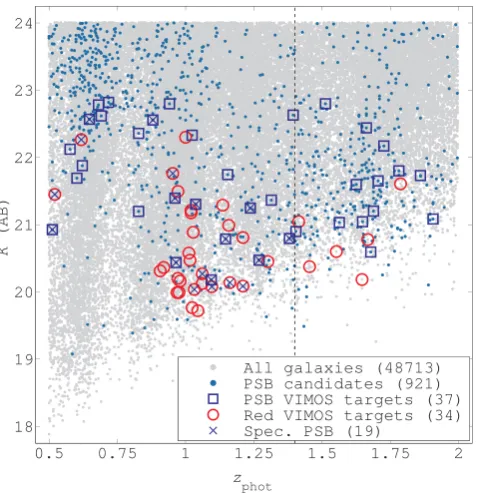
To verify the identification of PSB galaxies, we select spectro-scopic targets from this parent sample covering a wide range in redshift and magnitude (see Fig.1). Note, however, that selection was based on preliminary catalogues to a limit ofKAB<23, and
that targets were chosen withi<24.5 to ensure adequate signal-to-noise (S/N) in the optical spectra. Red-sequence galaxies were also selected, with priority given to those near the SC classifica-tion boundary with PSBs, to allow for a robust calibraclassifica-tion of the boundary’s position. A total of 88 targets were selected, including 37 PSB candidates and a comparison sample of 34 red-sequence galaxies. Spectra for an additional 11 forming, 2 dusty star-forming and 4 low-metallicity galaxies were also taken, but these are not considered in this paper.
at University of Nottingham on January 12, 2017
http://mnrasl.oxfordjournals.org/
Figure 1. K-band magnitude versus photometric redshift for UDS galaxies (0.5< z <2.0;KAB<24), showing the supercolour selected post-starburst
(PSB) candidates (blue points). Spectroscopic targets from our new medium-resolution spectroscopy (see Section 2.3) are shown: PSB candidates (blue squares) and red-sequence galaxies (red circles). Respective sample sizes are shown in the legend. Also indicated are the upper redshift limit for our spectroscopic PSB classification (z=1.4; black dashed line) and the PSBs identified from the spectroscopy of these targets (blue crosses; see Section 3 and Table1). Note that spectroscopic candidates were selected from an early version of the SC catalogue toKAB<23.
2.3 VIMOS spectroscopy and data reduction
Spectroscopic observations were taken with the VIMOS spectro-graph at the European Southern Observatory’s Very Large Telescope (ESO programme 094.A-0410). Observations were performed in multi-object spectroscopy (MOS) mode. Spectroscopic data were taken with a single VIMOS mask and with total on-source expo-sures of∼4 h, which were divided over 7 observing blocks (OBs) and four nights (data taken in Nov/Dec 2014). Each individual OB had an exposure time of ∼35 min (2088 s) and was observed in a pattern of three 1.2 arcsec dithered exposures. All observations were performed in dark time, under clear conditions, with a see-ing of<1 arcsec and with an airmass<1.2. Standard calibration data were also taken as part of the observing programme; including detector biases, screen flat-fields, arc-lamp exposures and spectro-photometric standards.
We use VIMOS with the medium-resolution grism (MR) and GG475 order sorting filter; a configuration that provides a wide wavelength coverage (4800–10 000 Å) and a dispersion of 2.6 Å pixel−1. The field of view for VIMOS is separated into four
quadrants, each of which is 7×8 arcmin2. For our MOS
obser-vations, we use slit masks with 20–25 slits per quadrant, yielding spectra for a total of 88 galaxies in the UDS field (see Section 2.2). The masks use slits of 1 arcsec width, resulting in a typical spectral resolution ofR=580.
Raw spectra were reduced using the VIMOS MOS pipeline (ver-sion 2.9.16) and within the ESO REFLEXenvironment (Freudling
et al. 2013). Standard data reduction procedures were followed, leading to flux- and wavelength-calibrated spectra with a mean rms
in the residuals of the wavelength calibration<0.7 Å. Finally, the 1D spectra for each individual target from all 7 OBs were normalized and combined in a median stack.
From the reduced spectra, we determine spectroscopic redshifts
zspecusing theEZandSGNAPSpackages (Garilli et al.2010; Paioro
& Franzetti2012). WithEZ, redshifts are determined using a
cross-correlation of spectral templates. Here we use the default templates, but also include the additional templates of Bradshaw et al. (2013), constructed for UDSz. Optimal solutions were confirmed via spec-tral line identification inSGNAPS. Overall, the spectra had sufficient
S/N to determinezspecin∼70 per cent of cases.
3 R E S U LT S
To confirm the nature of our PSB candidates, we determine the pres-ence of strong Balmer absorption lines (e.g. Hδ λ4102 Å) combined with a strong Balmer break (Wild et al.2009). An equivalent width in Hδ >5 Å is generally considered diagnostic of a PSB galaxy (although often combined with a lack of significant emission lines; e.g. Goto2007). Equivalent width (Wλ) is defined as
Wλ=
λ2
λ1
1−F(λ)/Fc(λ) dλ, (2)
whereF(λ) is the spectral flux and Fc(λ) is the continuum
emis-sion. We compute the rest-frame Hδequivalent width (WHδ) using a
non-parametric approach based on that used by previous works (e.g. Goto et al.2003). First,zspecis used to transform the spectrum into
the rest-frame. Then continuum emission is estimated across Hδ using a linear interpolation between the continuum measured in nar-row intervals on either side (4030–4082 and 4122–4170 Å). These intervals are chosen for their lack of significant absorption/emission lines and their continuum is modelled by a linear regression that in-cludes both intervals, weighted by the inverse square error in the flux. A 3σ rejection to deviant points above/below an initial con-tinuum model is also used to minimize the effect of noise. Finally, WHδis determined using the ratioF(λ)/Fc(λ) across an interval that
encapsulates Hδ(λ1=4082 toλ2=4122 Å).
In this study, the need to identify Hδ(λ4102 Å) restricts unam-biguous PSB classification toz <1.4, where Hδis within spectral reach of VIMOS. This is the case for 24/37 of our PSB candidates (see Fig.1). In this regime, due to the faintness of our targets the S/N was only sufficient for a securezspecandWHδmeasurement in
15/24 of cases. For one of these cases, an anomaly in the contin-uum region made the measurement ofWHδ problematic, possibly
due to a close/projected companion. This candidate is consequently removed from our sample. From the remaining ‘good’ candidates, we find that the majority (11/14;∼80 per cent) do exhibit the strong Balmer absorption (WHδ>5 Å) and a Balmer break, characteristic
of PSB galaxies. This result demonstrates the overall effectiveness of the Wild et al. (2014) PCA technique for selecting high-redshift PSBs atz <1.4. For the three candidates that were not confirmed, all exhibit significant but weaker H δabsorption (WHδ ∼ 3 Å).
Details of our confirmed PSBs, including their diagnosticWHδ, are
presented in Table1.
We also determineWHδfor our red-sequence targets. Of the cases
where a measurement was possible (26/34 galaxies), we confirm that the majority (18/26;∼70 per cent) exhibit either very weak or insignificant Hδabsorption (WHδ < 5 Å; see Fig.2, for
ex-amples). For the remaining cases (8 galaxies;∼30 per cent), PSB signatures were actually observed (WHδ>5 Å; see Table1). Some
overlap between the populations is not surprising, however, since
at University of Nottingham on January 12, 2017
http://mnrasl.oxfordjournals.org/
Table 1. Post-starbursts (PSBs) classified from the new higher-resolution VIMOS spectroscopy. PSBs identified from both the SC-selected PSB and red-sequence samples are shown, corresponding to the filled blue circles in Fig.3. Errors inWHδ(1σ) are determined from theWHδvariance between simulated stacks of the 7 OB spectra generated via a bootstrap method.
DR8 ID RA Dec zspec KAB WHδ(Å)
SC-PSB
68 297 34.557 07 −5.218 42 1.122 20.2 6.3±0.3 68 884 34.361 23 −5.214 09 0.913 22.6 9.5±3.3 75 927 34.368 46 −5.181 22 0.651 22.6 7.2±0.9 76 989 34.388 89 −5.176 62 0.987 21.4 10.1±0.4 96 124 34.308 28 −5.088 44 1.147 20.8 8.2±0.5 96 779 34.584 38 −5.085 98 1.003 20.4 6.5±0.4 97 148 34.333 52 −5.084 09 1.273 20.5 15.2±0.4 102 822 34.305 97 −5.056 90 0.539 20.9 8.9±0.6 105 014 34.395 62 −5.046 24 1.193 21.2 10.5±0.9 118 108 34.327 20 −4.984 63 1.398 20.8 9.6±1.6 118 145 34.583 69 −4.983 89 1.095 21.3 9.3±0.5 SC-Red
[image:4.595.50.286.113.703.2]67 085 34.422 45 −5.222 67 0.643 22.3 6.6±0.9 80 264 34.373 55 −5.163 23 1.091 20.0 6.3±0.8 83 492 34.546 93 −5.147 07 1.138 20.3 8.0±0.5 86 288 34.584 42 −4.133 21 0.571 21.4 7.5±0.7 98 931 34.527 46 −4.076 77 1.270 20.1 9.8±0.8 105 911 34.357 17 −5.042 53 1.148 20.1 5.2±0.7 118 886 34.341 84 −4.981 42 1.097 20.1 7.4±0.5 119 803 34.358 94 −4.976 03 1.024 21.8 8.1±1.7
Figure 2. Example VIMOS spectra for post-starburst (PSB) and red-sequence galaxies in the UDS. The PSBs all exhibit the strong Balmer absorption (WHδ>5 Å) and Balmer break, characteristic of this population.
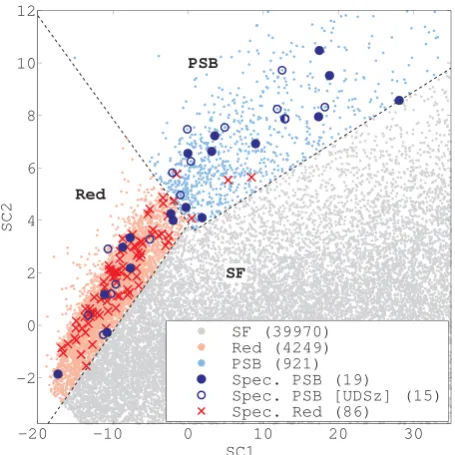
Figure 3. A supercolour (SC) diagram for galaxies in the UDS field (0.5 < z < 2.0), showing our spectroscopically confirmed post-starbursts (PSB). The photometrically-selected populations (star-forming, red-sequence and PSB) are indicated by small grey, red and blue points, respectively. We also highlight: (i) confirmed PSBs from the latest VI-MOS spectroscopy (WHδ>5 Å; filled blue circles); (ii) confirmed PSBs
from UDSz (open blue circles); and (iii) confirmed red-sequence galaxies (WHδ<5 Å; red crosses). Sample sizes are shown in the legend. photometric methods for identifying PSBs will be less sensitive to PSB signatures than using spectroscopy.
For further verification, we also determineWHδ for additional
PSB/red-sequence candidates using the lower resolution spectra available from UDSz (the spectroscopic component of the UDS; see Bradshaw et al.2013; McLure et al.2013). Wild et al. (2014) used UDSz for the initial verification of the SC method, but only used spectra from a limited redshift range (0.9< z <1.2; 5 PSBs). Here, however, we re-analyse the UDSz data using spectra from a wider redshift range (0.5< z <1.4). Using only good-quality spectra (S/N>7), we find that the majority (9/11;∼80 per cent) of PSB candidates exhibit strong Balmer absorption (WHδ>5 Å),
whereas the majority (64/70;∼90 per cent) of red-sequence galaxies do not. These UDSz results are in strong agreement with those from our new higher-resolution VIMOS spectroscopy.
In Fig.3, we show the SC1–SC2 diagram used to identify PSB candidates in the UDS, and highlight the location of our spec-troscopically confirmed candidates (based onWHδonly). Overall,
confirmed PSBs span the full range of SC space used for their photometric selection, with the low contamination level in this re-gion indicating the general effectiveness of the demarcations be-tween PSBs, red-sequence galaxies (Red), and star-forming galaxies (SF). Combining results from our new spectroscopy with UDSz, we confirm that 19/24 (∼80 per cent) of our photometrically selected PSB candidates exhibit PSB spectral signatures (note: there is min-imal overlap between these spectroscopic samples; 1 PSB and 1 Red). We also determine that the overall completeness in photo-metric PSB selection is∼60 per cent, with some spectroscopically confirmed PSBs appearing in the photometric red-sequence popu-lation. However, as previously noted, this level of completeness is not unexpected, since the photometric PCA method will naturally be less sensitive to PSB signatures than using spectroscopy.
at University of Nottingham on January 12, 2017
http://mnrasl.oxfordjournals.org/
With respect to these results, an important consideration is that we do not impose a lack of [O II] emission in our PSB criteria.
[O II] emission is not considered typical for PSBs; however, we
do not use this as a classification criterion to avoid a potential bias against PSBs hosting AGN (Yan et al. 2006). In addition, some [OII] emission may actually be expected in PSBs where star
formation was not quenched on a rapid time-scale. For our con-firmed PSBs, a small number do exhibit significant [OII] emission (W[OII]<−10 Å; 3 galaxies – #68884, #75927, and one candidate
from UDSz). However, if we exclude these cases, our confirma-tion rate for photometrically selected PSBs only drops to 16/24 (∼65 per cent). Furthermore, even using a much stricter criterion for [OII] emission (W[OII]<−5 Å; e.g. Tran et al.2003), we still
find that 14/24 (∼60 per cent) can be confirmed as genuine PSBs. From these results, we conclude that the photometric selection of PSB galaxies is highly effective with, depending on the precise clas-sification criteria used, between 60–80 per cent of the candidates showing spectral signatures characteristic of this population.
Taken together, our results show that the PCA selection of PSBs is highly successful for candidates within the magnitude range of our spectroscopic samples (KAB<23). However, we note that the
PCA selection currently yields PSB candidates down toKAB=24
(see Fig.1). At present, we do not have spectra for these fainter candidates to confirm their nature. However, based on their super-colour distributions (i.e. SC1, SC2), there is no indication that these fainter candidates are intrinsically different to those withKAB<23.
Consequently, provided sufficient S/N in the spectra, we anticipate a similar success rate among this fainter population.
4 C O N C L U S I O N S
We present spectroscopic verification of the selection of high-redshift (z >0.5) PSB galaxies from a new photometric technique, based on the PCA analysis of galaxy SEDs. Using deep-optical spec-troscopy, we demonstrate the overall effectiveness of this method, with the majority of PSB candidates targeted (∼80 per cent) exhibit-ing the strong Balmer absorption (WHδ>5 Å) and Balmer break,
characteristic of this population. Furthermore, using stricter criteria, excluding those with significant [OII] emission (W[OII]<−5 Å),
we still find a significant fraction of PSB candidates (∼60 per cent) can be classified as genuine PSBs. However, we caution that using the latter criteria may bias against PSBs hosting AGN, or those with residual star formation. We conclude that the PCA technique and its application to the UDS field are highly-effective in selecting large samples of PSBs at high redshift.
The verification presented of the photometric selection of high-redshift PSBs will enable a wide range of science in both the UDS and other deep surveys from large photometric samples. Such stud-ies will be the subject of forthcoming publications, including ex-plorations of their large-scale clustering (Wilkinson et al.2016), environments (Socolovsky et al., in preparation), mass-functions (Wild et al., submitted) and morphology (Almaini et al., submitted; Maltby et al., in preparation).
From our new higher-resolution spectroscopy, we also provide a secure sample of 19 high-redshift PSB spectra for future study. In addition, our re-analysis of the lower-resolution UDSz spectra has yielded an additional 14 PSB spectra, increasing the number of PSBs spectroscopically classified in the UDS field from 5 to 33 galaxies. A full analysis of the spectral features for these PSBs is beyond the scope of this study, and will be the subject of future publications. However, we do make one initial observation. Although we do observe some PSBs with significant [OII] emission, we observe
no significant signs of AGN activity in the spectra of our PSB galaxies (i.e. no high-ionization emission lines, e.g. [Ne V]). For some quenching models, the presence of an AGN is required to linger past the termination phase to sweep up any remaining gas (e.g. Hopkins2012). At present we find no evidence for lingering AGN activity in our data, but further work will be necessary to determine the prevalence of obscured and/or low-luminosity AGN in this important transition population.
AC K N OW L E D G E M E N T S
This work is based on observations from ESO telescopes at the Paranal Observatory (programmes 094.A-0410 and 180.A-0776). RJM acknowledges the support of the European Research Council via the award of a Consolidator Grant (PI McLure). We thank the staff at UKIRT for their efforts in ensuring the success of the UDS project.
R E F E R E N C E S
Baldry I. K., Glazebrook K., Brinkmann J., Ivezi´c ˇZ., Lupton R. H., Nichol R. C., Szalay A. S., 2004, ApJ, 600, 681
Best P. N., Kauffmann G., Heckman T. M., Brinchmann J., Charlot S., Ivezi´c ˇ
Z., White S. D. M., 2005, MNRAS, 362, 25 Bradshaw E. J. et al., 2013, MNRAS, 433, 194 Bruzual G., Charlot S., 2003, MNRAS, 344, 1000 Dekel A., Birnboim Y., 2006, MNRAS, 368, 2
Diamond-Stanic A. M., Moustakas J., Tremonti C. A., Coil A. L., Hickox R. C., Robaina A. R., Rudnick G. H., Sell P. H., 2012, ApJ, 755, L26 Dressler A., Gunn J. E., 1983, ApJ, 270, 7
Freudling W., Romaniello M., Bramich D. M., Ballester P., Forchi V., Garc´ıa-Dabl´o C. E., Moehler S., Neeser M. J., 2013, A&A, 559, A96 Furusawa H. et al., 2008, ApJS, 176, 1
Garilli B., Fumana M., Franzetti P., Paioro L., Scodeggio M., Le F`evre O., Paltani S., Scaramella R., 2010, PASP, 122, 827
Goto T., 2007, MNRAS, 381, 187 Goto T. et al., 2003, PASJ, 55, 771 Gunn J. E., Gott III J. R., 1972, ApJ, 176, 1 Hartley W. G. et al., 2013, MNRAS, 431, 3045 Hopkins P. F., 2012, MNRAS, 420, L8
Hopkins P. F., Hernquist L., Cox T. J., Di Matteo T., Martini P., Robertson B., Springel V., 2005, ApJ, 630, 705
Larson R. B., Tinsley B. M., Caldwell C. N., 1980, ApJ, 237, 692 Lawrence A. et al., 2007, MNRAS, 379, 1599
Martig M., Bournaud F., Teyssier R., Dekel A., 2009, ApJ, 707, 250 McLure R. J. et al., 2013, MNRAS, 428, 1088
Paioro L., Franzetti P., 2012, SGNAPS: Software for Graphical Navigation, Analysis and Plotting of Spectra, Astrophysics Source Code Library (ascl:1210.005)
Simpson C. et al., 2012, MNRAS, 421, 3060
Simpson C., Westoby P., Arumugam V., Ivison R., Hartley W., Almaini O., 2013, MNRAS, 433, 2647
Tran K.-V. H., Franx M., Illingworth G., Kelson D. D., van Dokkum P., 2003, ApJ, 599, 865
Trujillo I. et al., 2006, MNRAS, 373, L36 Vergani D. et al., 2010, A&A, 509, A42
Whitaker K. E., van Dokkum P. G., Brammer G., Franx M., 2012, ApJ, 754, L29
Wild V., Walcher C. J., Johansson P. H., Tresse L., Charlot S., Pollo A., Le F`evre O., de Ravel L., 2009, MNRAS, 395, 144
Wild V. et al., 2014, MNRAS, 440, 1880
Wilkinson A. et al., 2016, preprint (arXiv:1604.00018)
Yan R., Newman J. A., Faber S. M., Konidaris N., Koo D., Davis M., 2006, ApJ, 648, 281
This paper has been typeset from a TEX/LATEX file prepared by the author.
at University of Nottingham on January 12, 2017
http://mnrasl.oxfordjournals.org/