DOI:10.1051/0004-6361/201014326 c
ESO 2010
Astrophysics
&
An improved method for estimating the masses of stars
with transiting planets
B. Enoch
1, A. Collier Cameron
1, N. R. Parley
1, and L. Hebb
21 School of Physics and Astronomy, University of St. Andrews, North Haugh, St Andrews, KY16 9SS, UK
e-mail:[email protected]
2 Vanderbilt University, Department of Physics and Astronomy, Nashville, TN 37235, USA
Received 26 February 2010/Accepted 6 April 2010
ABSTRACT
Context.To determine the physical parameters of a transiting planet and its host star from photometric and spectroscopic analysis, it is essential to independently measure the stellar mass. This is often achieved by the use of evolutionary tracks and isochrones, but the mass result is only as reliable as the models used.
Aims.The recent paper by Torres et al. (2010, A&ARv, 18, 67) showed that accurate values for stellar masses and radii could be obtained from a calibration usingTeff, loggand [Fe/H]. We investigate whether a similarly good calibration can be obtained by
substituting logρ– the fundamental parameter measured for the host star of a transiting planet – for logg, and apply this to star-exoplanet systems.
Methods.We perform a polynomial fit to stellar binary data provided in Torres et al. (2010) to obtain the stellar mass and radius as functions ofTeff, logρand [Fe/H], with uncertainties on the fit produced from a Monte Carlo analysis. We apply the resulting equations to measurements for seventeen SuperWASP host stars, and also demonstrate the application of the calibration in a Markov Chain Monte Carlo analysis to obtain accurate system parameters where spectroscopic estimates of effective stellar temperature and metallicity are available.
Results.We show that the calibration using logρproduces accurate values for the stellar masses and radii; we obtain masses and radii of the SuperWASP stars in good agreement with isochrone analysis results. We ascertain that the mass calibration is robust against uncertainties resulting from poor photometry, although a good estimate of stellar radius requires good-quality transit light curve to determine the duration of ingress and egress.
Key words.planetary systems
1. Introduction
There are currently over 400 known exoplanets, of which more than 60 transit their host stars1. This important transiting subset are the only planets for which the orbital inclination, and hence precise stellar and planetary parameters, may be determined. The fundamental parameters found for the host star and transiting planet are stellar density (see below) and planetary surface grav-ity (Southworth et al. 2004). To convert these into values for the radii of both, it is necessary to find the stellar mass. This is often arrived at iteratively via deriving a stellar density from the lightcurve analysis and a stellar effective temperature from spectroscopy and using these with model evolutionary tracks and isochrones of appropriate metallicity to find a stellar mass and age (Sozzetti et al. 2007). Further photometric and spectro-scopic analysis may then be performed to arrive at final values for the masses and radii of the star and planet, see e.g.Hebb et al.(2009). The resulting values for masses and radii are there-fore only as reliable as the evolutionary models used. A recent study by Southworth(2009) highlighted the fact that discrep-ancies between different sets of evolutionary models represent the dominant source of systematic uncertainty in planetary pa-rameters. For example, they find that the spread of mass values obtained for HD 209458 using different models is around 4%.
1
www.exoplanet.eu
Here we develop a new one-step approach to determin-ing the masses of exoplanet host stars from their effective temperatures, metallicities and photometric bulk densities. We base our method on the recent study byTorres et al.(2010) of the masses and radii of a large sample of well-characterised main-sequence stars belonging to non-interacting, eclipsing spectro-scopic binaries.Torres et al.(2010) showed that accurate stellar masses and radii could be obtained using a calibration of stellar surface gravity, effective temperature and metallicity. They used a set of well-determined measurements of logg,Teff, [Fe/H],M andR from binary stars to obtain coefficients that allow mass and radius to be calculated directly for any normal star, without isochrone fitting.
Recently, the use of logρin place of loggin the determina-tion of star-planet system parameters has become widespread, see for example Sozzetti et al. (2007), Winn et al. (2008), Sozzetti et al.(2009) andFernandez et al.(2009). Where high quality photometric data can be obtained of the transit event, the stellar parameters can be obtained more precisely using the lar density value derived from the lightcurve than using the stel-lar surface gravity value from spectral analysis (Sozzetti et al. 2007).
In Sect. 2 we review the methodology for determining ex-oplanet host-star densities from the transit geometry. We re-determine the mass and radius calibrations ofTorres et al.(2010) using their data, and obtain comparably tight mass and radius
(Seager & Mallén-Ornelas 2003): the ratio of semi-major axis to stellar radius depends on the ratio of transit duration to orbital period via
a R∗ =
⎡ ⎢⎢⎢⎢⎢ ⎢⎣(1+
√
ΔF)2−b21−sin2πT P
sin2πTP
⎤ ⎥⎥⎥⎥⎥ ⎥⎦
1/2
(1) whereΔF =(F−Ftransit)/F,bis the impact parameter,T is the transit duration andPis the orbital period.
Combining this with Kepler’s Third Law,
P2= 4π
2a3
G(M∗+Mp)
(2) whereGis the gravitational constant, leads to an expression for the stellar density (Seager & Mallén-Ornelas 2003)
ρ∗ ρ =
4π2
P2G
⎡⎢⎢⎢⎢⎢⎢⎢⎢⎣1+√ΔF2−b21−sin2πTP sin2πTP
⎤ ⎥⎥⎥⎥⎥ ⎥⎥⎥⎦
3/2
(3)
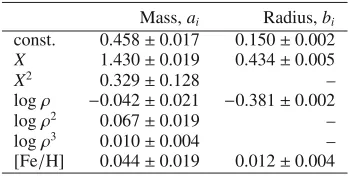
sinceM∗Mp(this is strictly true for planets on circular orbits only). Thus the stellar density may be obtained directly from pa-rameters measurable from a high-quality lightcurve: the duration and depth of transit, the impact parameter and the orbital period. We used a Singular Value Decomposition (SVD) fit, weighted by error on the mass or radius measurements, to ob-tain coefficients on significant variables. The final fit gives co-efficients forX(=log(Teff)−4.1),X2, logρ, logρ2, logρ3 and [Fe/H] for mass, and X, logρand [Fe/H] for radius (the sec-ondary terms are insignificant for the radius fit). Thus the mass or radius may be computed by
logM = a1+a2X+a3X2+a4logρ+a5logρ2
+a6logρ3+a7[Fe/H] (4) logR=b1+b2X+b3logρ+b4[Fe/H]. (5) To obtain 1σ errors on the coefficients, we carried out a Monte Carlo analysis of 50 000 runs in which, for each run, each value forTeff, logρ, [Fe/H] andMorRwere perturbed randomly on a gaussian with standard deviation the 1σerror for that mea-surement. The set of 50 000 resulting coefficients were recorded, and the standard deviation of each coefficient within that set gave the error value for that coefficient. The fitted and error values for each of the mass and radius fits are given in Table1. The result-ing scatter in fitted less measured values is logM = 0.023 and logR=0.009. Figure1shows calibrated versus measured mass and radius.
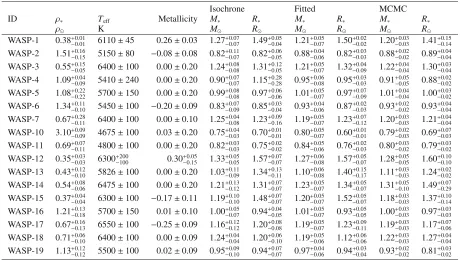
to calculate the mass and radius of each, and compare these to the values obtained from isochrone interpolations. WASP-1 data was obtained fromCameron et al.(2007),Stempels et al. (2007), Charbonneau et al. (2007) and Shporer et al. (2007), WASP-2 data from Cameron et al. (2007) and Charbonneau et al.(2007), WASP-3 data fromPollacco et al.(2008), WASP-4 data fromWilson et al. (2008), WASP-5 data from Anderson et al.(2008), WASP-6 data fromGillon et al.(2009), WASP-7 data fromHellier et al.(2009b), WASP-10 data fromJohnson et al. (2009) and Christian et al.(2009), WASP-11 data from West et al.(2009b) andBakos et al.(2009), WASP-12 data from Hebb et al.(2009), WASP-13 data fromSkillen et al.(2009), WASP-14 data from Joshi et al. (2009), WASP-15 data from West et al. (2009a), WASP-16 data fromLister et al. (2009), WASP-17 data fromAnderson et al.(2010), WASP-18 data from Hellier et al.(2009a) and WASP-19 data fromHebb et al.(2010). Table2shows that the agreement in results from the two meth-ods is very good, demonstrating that computing stellar masses and radii from these coefficients is a valid, and simple, alterna-tive to isochrone interpolation.
The only values in Table2 that do not quite agree, within errors, are the results for the radius of WASP-10.Johnson et al. (2009) find a radius of 0.70+0.01
−0.01R, whereas the calibration pro-ducesR = 0.60+0.01
−0.01R. WASP-10 is an unusual host star, with a high density of 3.10ρ(Johnson et al. 2009) and a high level of activity (Smith et al. 2009). Such calibration discrepancies in low-mass, high-activity stars are discussed in Sect. 6 ofTorres et al.(2010).
4. Application to Markov Chain Monte Carlo analysis
Having established that our modification of the Torres calibra-tion yields stellar masses that agree well with those obtained from isochrone fitting, we now describe its implementation in our Markov-chain Monte Carlo (MCMC) parameter fitting code. This is followed by a discussion of a Main Sequence mass-radius constraint generally imposed on the parameter fitting, and ob-jects for which this constraint is removed. We also discuss the effect on the final mass and radius values of uncertainty in ec-centricity due to imperfect radial velocity and photometry.
[image:2.595.354.528.98.186.2](a) (b)
Fig. 1.Shows the scatter in fitted (calibrated) and measureda)mass andb)radius values for the 38 stars used in the calibration.
Table 2.Comparison of mass and radius values obtained from isochrone fitting with those from the calibrated equations and from an MCMC analysis using those equations.
Isochrone Fitted MCMC
ID ρ∗ Teff Metallicity M∗ R∗ M∗ R∗ M∗ R∗
ρ K M R M R M R
WASP-1 0.38+0.01
−0.01 6110±45 0.26±0.03 1.27+
0.07
−0.07 1.49+
0.05
−0.04 1.21+
0.05
−0.07 1.50+
0.02
−0.02 1.20+
0.03
−0.03 1.41+
0.15 −0.14
WASP-2 1.51+0.16
−0.15 5150±80 −0.08±0.08 0.82+
0.11
−0.07 0.82+
0.06
−0.05 0.88+
0.04
−0.06 0.82+
0.03
−0.03 0.88+
0.02
−0.02 0.89+
0.04 −0.04
WASP-3 0.55+0.15
−0.05 6400±100 0.00±0.20 1.24+
0.08
−0.08 1.31+
0.12
−0.05 1.21+
0.05
−0.07 1.32+
0.04
−0.09 1.22+
0.04
−0.04 1.30+
0.03 −0.04
WASP-4 1.09+0.04
−0.09 5410±240 0.00±0.20 0.90+
0.07
−0.07 1.15+
0.28
−0.28 0.95+
0.06
−0.08 0.95+
0.03
−0.03 0.91+
0.05
−0.05 0.88+
0.02 −0.02
WASP-5 1.08+0.22
−0.22 5700±150 0.00±0.20 0.99+
0.08
−0.08 0.97+
0.06
−0.06 1.01+
0.05
−0.07 0.97+
0.07
−0.09 1.01+
0.04
−0.04 1.00+
0.03 −0.02
WASP-6 1.34+0.11
−0.10 5450±100 −0.20±0.09 0.83+
0.07
−0.09 0.85+
0.03
−0.04 0.93+
0.04
−0.06 0.87+
0.02
−0.03 0.93+
0.02
−0.02 0.93+
0.04 −0.04
WASP-7 0.67+0.28
−0.11 6400±100 0.00±0.10 1.25+
0.04
−0.08 1.23+
0.09
−0.16 1.19+
0.05
−0.07 1.23+
0.07
−0.12 1.20+
0.03
−0.03 1.21+
0.04 −0.04
WASP-10 3.10+0.09
−0.09 4675±100 0.03±0.20 0.75+
0.04
−0.03 0.70+
0.01
−0.01 0.80+
0.05
−0.07 0.60+
0.01
−0.01 0.79+
0.02
−0.03 0.69+
0.07 −0.03
WASP-11 0.69+0.07
−0.11 4800±100 0.00±0.20 0.82+
0.03
−0.03 0.75+
0.02
−0.02 0.84+
0.05
−0.06 0.76+
0.02
−0.03 0.80+
0.03
−0.02 0.79+
0.03 −0.02
WASP-12 0.35+0.03
−0.03 6300+
200
−100 0.30+
0.05
−0.15 1.33+
0.05
−0.05 1.57+
0.07
−0.07 1.27+
0.06
−0.08 1.57+
0.05
−0.07 1.28+
0.05
−0.05 1.60+
0.10 −0.10
WASP-13 0.43+0.12
−0.10 5826±100 0.00±0.20 1.03+
0.11
−0.09 1.34+
0.13
−0.11 1.10+
0.06
−0.08 1.40+
0.15
−0.17 1.11+
0.03
−0.03 1.24+
0.02 −0.02
WASP-14 0.54+0.08
−0.06 6475±100 0.00±0.20 1.21+
0.13
−0.12 1.31+
0.07
−0.07 1.23+
0.05
−0.07 1.34+
0.05
−0.07 1.31+
0.05
−0.10 1.49+
0.07 −0.29
WASP-15 0.37+0.04
−0.04 6300±100 −0.17±0.11 1.19+
0.10
−0.10 1.48+
0.07
−0.07 1.20+
0.05
−0.07 1.52+
0.05
−0.07 1.18+
0.03
−0.03 1.37+
0.10 −0.14
WASP-16 1.21+0.13
−0.18 5700±150 0.01±0.10 1.00+
0.05
−0.07 0.94+
0.04
−0.05 1.01+
0.05
−0.07 0.93+
0.05
−0.05 1.00+
0.03
−0.03 0.97+
0.03 −0.03
WASP-17 0.67+0.16
−0.13 6550±100 −0.25±0.09 1.16+
0.12
−0.12 1.20+
0.08
−0.08 1.19+
0.05
−0.07 1.23+
0.09
−0.11 1.19+
0.03
−0.03 1.17+
0.07 −0.06
WASP-18 0.71+0.06
−0.10 6400±100 0.00±0.09 1.24+
0.04
−0.04 1.20+
0.06
−0.10 1.19+
0.05
−0.06 1.12+
0.06
−0.06 1.22+
0.03
−0.03 1.27+
0.04 −0.04
WASP-19 1.13+0.12
−0.12 5500±100 0.02±0.09 0.95+
0.09
−0.10 0.94+
0.07
−0.07 0.97+
0.04
−0.06 0.94+
0.03
−0.04 0.93+
0.02
−0.02 0.81+
0.03 −0.02
periastron, while the transit is modelled using the formulation ofMandel & Agol(2002) incorporating the 4-coefficient limb-darkening model ofClaret(2000). The form of the transit profile is determined by five parameters: the epoch of transit, orbital period, duration and depth of transit and the impact parameter of orbit. The best model is found using a constrained optimiza-tion ofχ2 for both photometric and radial velocity data, com-bined with Bayesian priors on epoch, period, transit duration and depth, impact parameter, stellar mass, radial velocity semi-amplitude, eccentricity and the longitude of periastron.
Here, we adapted this analysis to take the spectralTeff and
metallicity as input values when modelling all available pho-tometry and radial velocity observations of a host star. The MCMC code determines the stellar density value for the calcu-lations from the observations at each step in the chain, now us-ing Bayesian priors on the temperature and metallicity also, and
uses the equations and coefficients above to calculate the stellar mass. These modifications make the MCMC analysis more ro-bust since the stellar mass is now a derived quantity in the chain instead of a jump parameter constrained by a prior.
Where there is high-quality follow-up photometry of a transit event, the duration of ingress and egress, and hence the impact parameter, are tightly constrained. However, where such pho-tometry is not available and thus the duration of ingress and egress cannot be accurately measured, an additional constraint is needed in the MCMC analysis. In such a case, the transit ingress and egress durations are overestimated in modelling the photometry since the sharp transitions to ingress and egress be-come blurred, allowing a shallower slope to be fitted. This leads to an underestimation of the impact parameter,b, from
b≈1−√δT
[image:3.595.57.517.330.590.2]χ2 add=
(Rstep−M∗ ) σ2
R
(8) whereRstepis the stellar radius value for the current step in the Monte Carlo chain, M∗ is the stellar mass of this chain step andσ2
Ris the estimated uncertainty on the power-law estimate of
the stellar radius. Thisχ2penalty is added to theχ2value for the chain step, giving the model a lower chance of being accepted.
However, WASP-1, 12 and 15 have this Main Sequence con-straint relaxed due to being more evolved stars, each with an es-timated age greater than their expected Main Sequence lifetime. WASP-1 and 12 are late F-type stars with an estimated main se-quence lifetime of≤1 Gyr but estimated ages of around 2 Gyr. The high-quality photometry ofCharbonneau et al.(2007) and Shporer et al.(2007) (for WASP-1) andHebb et al.(2009) (for WASP-12) constrains the impact parameter and stellar density satisfactorily, allowing a good estimate of stellar age, and at the same time removing the need for the additional MCMC con-straint. WASP-15 is an F5 star of around 3.9 Gyr compared to a normal F5 age of 3.6 Gyr, also with high-quality photometry (West et al. 2009a) which again constrains the impact parameter and stellar density. Restraining the radii of these stars to lower values with the Main Sequence constraint on leads to an over-estimation of their density. In addition, we used the very high-quality photometry for WASP-10 given inJohnson et al.(2009), and therefore had no need for the Main Sequence constraint in that case. For all other objects, without extremely high quality follow-up data and expected to be on the Main Sequence, the constraint was kept.
With high precision photometry the precise shape of the tran-sit would help constrain the eccentricity of the planetary orbit through the measured duration of transit. A planet moving on an eccentric orbit has its velocity modified by (1+esinω)/(√1−e2) compared to an identical planet on a circular orbit. Therefore for a planet on an eccentric orbit, the duration of transit,T, given by the length of the chord crossed in front of the star divided by the planet’s velocity, is modified by (√1−e2)/(1+esinω) compared to the duration in a circular orbit. Without very high quality photometry, a source of uncertainty in the stellar density can arise from the fitting of the eccentricity of the planet‘s orbit from the radial velocity measurements. With stellar density as an input, this leads to uncertainty in the results for stellar mass and radius using the calibrated equations and coefficients. This may especially be an issue for low mass planets which have a lower ratio of radial velocity amplitude to scatter than more massive planets, making an accurate determination of orbital eccentricity more difficult. Using the simplified version of the equation for
only.
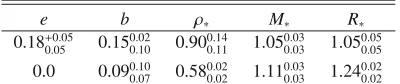
As an example, WASP-13b is a planet of mass 0.46MJ orbiting a G1 type star with a radial velocity semi-amplitude of 56 m s−1 (Skillen et al. 2009). The only transit photometry available is from SuperWASP and the 0.87 m James Gregory Telescope in St Andrews, Scotland. Running the MCMC anal-ysis as described above results in an eccentricity value ofe =
0.18±0.05, withχ2 =15 136. However, holding the eccentric-ity fixed at 0 and repeating the analysis leads to an output with a very slightly higherχ2 value of 15 140, so clearly the larger eccentricity value is not a secure result. The difference in result-ing parameters are given in Table3, showing that there is only a small effect of about six percent on the final stellar mass value despite a change of over 50% in the stellar density. Therefore it may be concluded that the effect of the uncertainty in eccentric-ity on the final fitted mass value is small. The stellar radius is altered by around 18%, due to the change in density value.
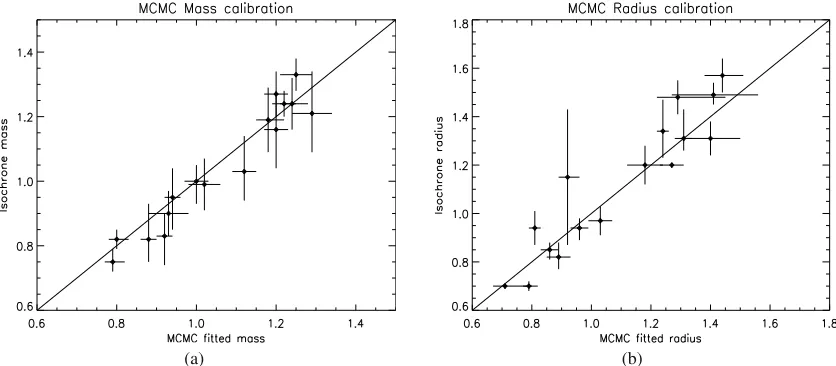
The results of the MCMC analysis on each of the 17 SuperWASP host stars are also presented in Table2, and are shown in Fig.2. Eccentricities are held fixed at 0 in all cases where this was done in the original papers WASP-3, 4, 5, 7, 11, 13, 15, 16 and 19). Almost all mass and radius values from the MCMC analysis agree with the isochrone values, within errors; the MCMC mass and radius ranges of WASP-6 and the radius range of WASP-19 do not quite overlap with the isochrone val-ues, but all these values agree at the 2σlevel.
5. Summary
We have presented a new calibration for stellar masses and radii based on stellar effective temperature, metallicity and stellar density. We have shown that the resulting equations provide a good fit to data for 38 stars fromTorres et al.(2010), and also to values for masses and radii of exoplanet host stars obtained from isochrone analyses. We have demonstrated that accurate stellar masses may be obtained for such exoplanet host stars via a Markov-chain Monte Carlo analysis of photometric and spec-troscopic data, using specspec-troscopically determined temperatures and metallicities as input.
[image:4.595.341.541.99.141.2](a) (b)
Fig. 2.Shows the scatter in isochronea)mass andb)radius values versus values from MCMC analysis for 17 SuperWASP host stars.
Acknowledgements. The WASP Consortium consists of astronomers primarily from the Queen’s University Belfast, Keele, Leicester, The Open University, and St Andrews, the Isaac Newton Group (La Palma), the Instituto de Astrofisica de Canarias (Tenerife) and the South African Astronomical Observatory. The SuperWASP-N and WASP-S Cameras were constructed and operated with funds made available from Consortium Universities and the UK‘s Science and Technology Facilities Council.
References
Anderson, D. R., Gillon, M., Hellier, C., et al. 2008, MNRAS, 387, L4 Anderson, D. R., Hellier, C., Gillon, M., et al. 2010, ApJ, 709, 159 Bakos, G. Á., Pál, A., Torres, G., et al. 2009, ApJ, 696, 1950
Cameron, A. C., Bouchy, F., Hébrard, G., et al. 2007, MNRAS, 375, 951 Charbonneau, D., Winn, J. N., Everett, M. E., et al. 2007, ApJ, 658, 1322 Christian, D. J., Gibson, N. P., Simpson, E. K., et al. 2009, MNRAS, 392, 1585 Claret, A. 2000, VizieR Online Data Catalog, 336, 31081
Collier Cameron, A., Wilson, D. M., West, R. G., et al. 2007, MNRAS, 380, 1230
Cox, A. N. 2000, Allen’s Astrophysical Quantities, 4th edn. (Berlin: Springer) Fernandez, J. M., Holman, M. J., Winn, J. N., et al. 2009, AJ, 137, 4911 Gillon, M., Anderson, D. R., Triaud, A. H. M. J., et al. 2009, A&A, 501, 785 Hebb, L., Collier-Cameron, A., Loeillet, B., et al. 2009, ApJ, 693, 1920 Hebb, L., Collier-Cameron, A., Triaud, A. H. M. J., et al. 2010, ApJ, 708, 224
Hellier, C., Anderson, D. R., Cameron, A. C., et al. 2009a, Nature, 460, 1098 Hellier, C., Anderson, D. R., Gillon, M., et al. 2009b, ApJ, 690, L89
Johnson, J. A., Winn, J. N., Cabrera, N. E., & Carter, J. A. 2009, ApJ, 692, L100 Joshi, Y. C., Pollacco, D., Cameron, A. C., et al. 2009, MNRAS, 392, 1532 Lister, T. A., Anderson, D. R., Gillon, M., et al. 2009, ApJ, 703, 752 Mandel, K., & Agol, E. 2002, ApJ, 580, L171
Pollacco, D., Skillen, I., Collier Cameron, A., et al. 2008, MNRAS, 385, 1576 Seager, S., & Mallén-Ornelas, G. 2003, ApJ, 585, 1038
Shporer, A., Tamuz, O., Zucker, S., & Mazeh, T. 2007, MNRAS, 376, 1296 Skillen, I., Pollacco, D., Collier Cameron, A., et al. 2009, A&A, 502, 391 Smith, A. M. S., Hebb, L., Collier Cameron, A., et al. 2009, MNRAS, 398,
1827
Southworth, J. 2009, MNRAS, 394, 272
Southworth, J., Zucker, S., Maxted, P. F. L., & Smalley, B. 2004, MNRAS, 355, 986
Sozzetti, A., Torres, G., Charbonneau, D., et al. 2007, ApJ, 664, 1190 Sozzetti, A., Torres, G., Charbonneau, D., et al. 2009, ApJ, 691, 1145 Stempels, H. C., Collier Cameron, A., Hebb, L., Smalley, B., & Frandsen, S.
2007, MNRAS, 379, 773
Torres, G., Andersen, J., & Giménez, A. 2010, A&ARv, 18, 67 West, R. G., Anderson, D. R., Gillon, M., et al. 2009a, AJ, 137, 4834 West, R. G., Collier Cameron, A., Hebb, L., et al. 2009b, A&A, 502, 395 Wilson, D. M., Gillon, M., Hellier, C., et al. 2008, ApJ, 675, L113 Winn, J. N. 2009, in IAU Symp., 253, 99