Automatic Generation of Statistical Pose and Shape
Models for Articulated Joints
Xin Chen, Jim Graham,
Member, IEEE,
Charles Hutchinson, and Lindsay Muir
Abstract—Statistical analysis of motion patterns of body joints is potentially useful for detecting and quantifying pathologies. However, building a statistical motion model across different subjects remains a challenging task, especially for a complex joint like the wrist. We present a novel framework for simultaneous registration and segmentation of multiple 3D (CT or MR) volumes of different subjects at various articulated positions. The framework starts with a pose model generated from 3D volumes captured at different articulated positions of a single subject (template). This initial pose model is used to register the template volume to image volumes from new subjects. During this process, the Grow-Cut algorithm [1] is used in an iterative refinement of the segmentation of the bone along with the pose parameters. As each new subject is registered and segmented, the pose model is updated, improving the accuracy of successive registrations. We applied the algorithm to CT images of the wrist from 25 subjects, each at five different wrist positions and demonstrated that it performed robustly and accurately. More importantly, the resulting segmentations allowed a statistical pose model of the carpal bones to be generated automatically without interaction. The evaluation results show that our proposed frame-work achieved accurate registration with an average mean target registration error of 0.34±0.27 mm. The automatic segmentation results also show high consistency with the ground truth obtained semi-automatically. Furthermore, we demonstrated the capability of the resulting statistical pose and shape models by using them to generate a measurement tool for scaphoid-lunate dissociation diagnosis, which achieved 90% sensitivity and specificity.
Index Terms—Wrist, Carpal bones, 3D image registration, segmentation, statistical pose model, statistical shape model, articulated joint.
I. INTRODUCTION
A
Number of recent studies have made use of statistical models for determining and quantifying abnormal artic-ulated motion of anatomical joints (e.g. in the spine [2], [3], the femur [4] and inferring 3D motion from 2D video se-quences in the wrist [5]). The principal underlying problem in building such statistical models is to establish correspondences representing important features across populations.Davies et al [6] have shown how such correspondences can be achieved automatically, given a segmented training set.
Copyright c⃝2013 IEEE. Personal use of this material is permitted. However, permission to use this material for any other purposes must be obtained from the IEEE by sending a request to [email protected].
X. Chen and J. Graham are with the Centre for Imaging Sciences, Institute of Population Health, The University of Manchester, U.K. (e-mail: [email protected])
C. Hutchinson is with the Division of Healthsciences, University of War-wick, U.K.
L. Muir is with the Department of Hand Surgery, Salford Royal NHS Foundation Trust, Salford, U.K.
This work was supported by Medical Research Council, U.K., under Grant 87997.
However, for a complex joint like the wrist, segmentation of the wrist bones from CT volumes is a challenging task. They suffer from variation in intensity due to the nature of the trabecular bone and indistinct boundaries due to partial volume effects and the narrow gap between adjacent surfaces ( [7]–[10]). It is a common experience, which we share, that ‘automatic’ segmentation methods do not produce sufficiently accurate results and that ‘semi-automatic’ methods such as those based on Graph-cuts often require complex interac-tions for every training example. The problem is frequently solved by tedious manual segmentation. Furthermore, once segmentation is achieved further registration is required to align different articulated positions of different subjects [11]. This is complicated in articulated joints as the relative poses of different components vary throughout the motion of the joint. The wrist is a particularly challenging example as it comprises 8 carpal bones, the radius and the ulna (see figure 2) moving in a complex 3D pattern. Recently, Cootes et al. [12] introduced a framework to compute dense correspondences across groups of images based on groupwise image registration, which has been successfully applied to face and brain images. However, for the registration of bones, the features mainly lie on the surface of the bone and the pose variation involves significant articulation of rigid parts. This is not accommodated well in [12].
method that exploits the fact that identical bones from the same individual occur in different poses in the same data set. The different examples of these bones adopt different poses relative to the other bones as the joint moves. Examples of similar bones in similar poses are observed for different individuals. We have previously presented a framework for combined segmentation and registration [15]. That work is extended here by removal of the requirement for initial manual alignment prior to registration and incorporating the SPM building process into the framework.
The main contributions of this paper, distinguishing it from the aforementioned studies, are: (1) it is an automatic frame-work where a statistical pose model (SPM) and a statistical shape model (SSM) can be generated via integrated segmen-tation and registration methods. (2) A consistent global scale factor is estimated by simultaneous registration performed on all articulated positions of the same subject, which leads to an accurate and compact SPM. (3) In contrast to [13], a statistical description of the global motion pattern of all carpal bones is calculated, from which the local pattern of motion between adjacent bones can also be described directly. Additionally, the SPM parameters can be used to align different wrist positions from different subjects, without the requirement (as in [13]) for a set of predefined positions. (4) The segmentation results are produced by a combination of data from all the wrist positions, which produces more reliable and consistent results than only using one wrist position for segmentation (e.g. [15]). (5) We avoid the requirement for interactive alignment (as in [15]) by basing the registration and segmentation on the pose model. This model, initially based on a single subject, grows incrementally as further subjects are registered and segmented. This results in fully automatic registration and segmentation. (6) The use of SPM and SSM as a measurement tool for pathology detection is demonstrated based on the Scaphoid-lunate dissociation condition.
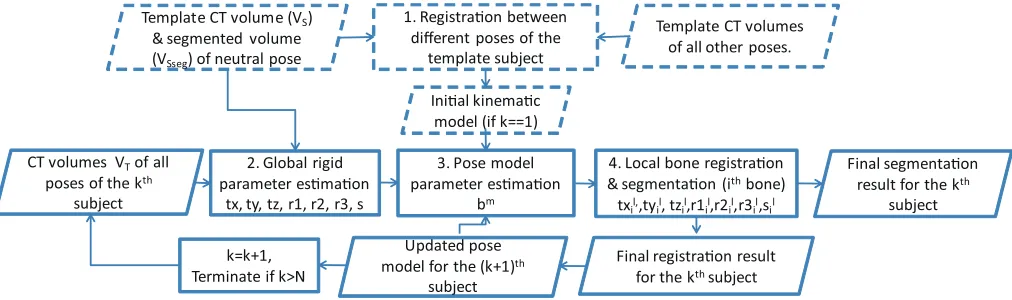
The proposed framework, illustrated in outline in Fig. 1, is designed to align a template volumeVS toN target subjects,
each with a number of different wrist positions. In our training datasets, CT data from 25 subjects, each at five different wrist positions were used (neutral position and four extreme positions in radial-ulnar and flexion-extension movement). The process consists of four steps. Step 1 is a pre-processing step that only needs to be done once. We randomly select one subject from the training data sets as the template, and segment a CT volume from one of the wrist positions (e.g. neutral position) using the grow-cut interactive segmentation method [1]. The segmented position is then registered to other positions within the template subject using the method described in [15] (see section IV(A,B)). The registration result is used to derive a pose model (described in section III). In steps 2 to 4, the template is propagated to all the positions of the kth target subject simultaneously, providing estimates of
the global rigid parameters, pose model parameters and local rigid parameters of each bone. In step 4, the Grow-Cut multi-label segmentation method is integrated with the registration process, which improves the robustness of the registration [15] and also generates a final segmentation. The successful registration result is then used together with the previously
available (k-1) registration results to produce an updated pose model for the next iteration. An outlier rejection strategy is used for pose model updating. The whole process is terminated when all subjects in the training data set are registered to the template. Detailed descriptions of each step are given in the following sections.
II. PROBLEMPARAMETERISATION
A coordinate system is defined (see figure 2) across all the subjects, in order to represent a consistent wrist motion. The origin of the coordinate system is defined with respect to the centroid of the radius bone. The X and Y coordinates are the corresponding coordinates of the centroid. As the length of the radius present in the image varies from subject to subject, the Z-coordinate (along the length of the radius) is defined, arbitrarily, to be 30 voxels above the lowest point in the radius of the template subject. The orientations of the X, Y and Z axis are defined by the original CT volume coordinate system. All bone motions are represented relative to the origin. Three sets of parameters need to be estimated during image registration in order to interpret the true 3D pose of each carpal bone: (1) Global wrist pose which is estimated by aligning the radius. It includes rigid transformation parameters and a global scale factor, denoted by θ={tx, ty, tz, r1, r2, r3, s}. t=[tx, ty, tz]T denotes the global translations, and r=[r1, r2, r3]T is the Rodrigues parameter
[13], [16] representing the global orientations. scontrols the distance from the centroid of each bone to the origin in the radius, and the global size of the bones. (2) Poses of the carpal bones that are controlled by the statistical pose model parametersbm(Eqn.(6),mis a notation indicating the model
parameters), which provides a rough alignment of the carpal bones. (3) Local rigid transformation parameters and a local scale factor for each boneβi={txli,tyil,tzli,r1li,r2li,r3li,sli}
(iis an index identifying each of the carpal bones, the radius and ulna), which provide refined alignment of bones based on the results from (2).
Using homogenous coordinates, theithbone in the template volume coordinate system can be transformed to the target volume coordinate system by,
Ai =P Di
[ ssl
iQi
1 ]
(1)
where Qi indicates the coordinates for the region of theith
bone in the template volume with respect to its own centroid. Ai is the transformed coordinates of theithbone in the target
volume. sli is the local scale factor that controls the size of theithbone.D
i is the pose matrix of the ithbone estimated
using the pose model and the local pose refinement.P is the global rigid transformation matrix defined by equation (2).
P = [
R t
0 1
]
(2)
where t is the translation vector [tx, ty, tz]T. R is the 3×
3 rotation matrix represented by Rodrigues parameters [13], [16], calculated as
Template CT volume (VS) & segmented volume (VSseg) of neutral pose
CT volumes VTof all poses of the kth
subject
2. Global rigid parameter es!ma!on
tx, ty, tz, r1, r2, r3, s
3. Pose model parameter es!ma!on
bm
4. Local bone registra!on & segmenta!on (ithbone) txil,,tyil, tzil,r1il,r2il,r3il,sil 1. Registra!on between
different poses of the template subject
Template CT volumes of all other poses.
Ini!al kinema!c model (if k==1)
Updated pose model for the (k+1)th
subject
Final registra!on result for the kthsubject k=k+1,
Terminate if k>N
Final segmenta!on result for the kth
[image:3.612.54.560.52.202.2]subject
Fig. 1. Overview of the proposed system. The dashed boxes represent the initial registration and segmentation of the randomly selected template volume. The solid boxes represent the iterative registration and segmentation of the remaining examples.
where |r| is the magnitude of the rotation vector [r1,r2,r3]T.
I is the identity matrix, andK is the skew-symmetric matrix normalised by|r|, expressed as
K=
−0r3 r03 −rr12 r2 −r1 0
/|r| (4)
In equation (1),Di is calculated as,
Di=
[
Rgi tgi
0 1
]
(5)
wheretgi=s[txm
i , tyim, tzim]T+[txli, tyil, tzli]T is the summation
of translation vectors estimated from the pose model and local bone refinement. Rgi = Rm
i Rli is the 3×3 rotation
matrix that combines the rotations estimated from the pose model and local bone refinement respectively. Rm
i and Rli
can be calculated individually by equation (3) using their corresponding Rodrigues parameters.
The use of Rodrigues parameters to represent bone orien-tations is convenient for pose model building and parameter optimisation. More importantly, unlike the quaternion repre-sentation, it does not require vector normalisation. Nor does it suffer from the singularity problem raised by the Euler angle rotations.
In the first step illustrated in figure 1, the template volume (VS) is randomly selected from the training data sets. VS is
then segmented semi-automatically using the multi-label grow-cut method [1]. By usingVS and its corresponding
segmenta-tion result VSseg, each bone inVS can be registered to other
volumes at different wrist positions within the same subject using the method described in [15]. First, we manually adjust the transformation parameters of each bone inVSsegto roughly
align with the target volume, and then automatically refine the transformation parameters via intensity based registration [17]. The refinement is iterated until an acceptable alignment is achieved. The bones to be registered belong to the same subject, so there are no significant shape differences. While the bone poses may be very different in different wrist positions, the initial rough interactive alignment makes it easy to achieve accurate registration. The interaction for each wrist position is also quick and efficient. This interactive step is carried out only
once for a given template volume. The result is an initial pose model, which is used for subsequent automatic registration.
III. STATISTICALPOSEMODELGENERATION
The kinematics of the carpal bones is complex and signif-icant pose difference can be introduced as the joint adopts different positions. In this section, we introduce a method for constructing the pose model of the carpal bones that enables the reproduction of valid poses with a small number of parameters. When carpal bones from different wrist positions of the same and different subjects are aligned, the pose model can be constructed from the transformation parameters of each bone with respect to a common reference coordinate system. The method of registration is described in sections IV and V. After the registration, we use the six rigid transformation parameters for each bone to train the SPM. The common coordinate system for all bone poses has an origin in the radius of the template volume (section II). Hence, for the SPM building, the transformation parameters for radius are always zero. The sizes of all the wrists are normalised to the template volume scale by using the estimated global scale factor. The pose of one subject is described by (tx1, ty1, tz1,r11,r21,
r31, ..., tx10, ty10,tz10, r110, r210,r310)t. (8 carpal bones,
1 radius and 1 ulna). Based on a set of training subjects, the pose model can be parametrised as,
h=µm+νmbm (6)
where the mean pose µm (m is a notation indicating the
model parameters) and the principal subspace matrix νm are
computed using PCA. The vector bm represents the pose
−60 −40 −20 0 20 40 60 80 100 −120
−100 −80 −60 −40 −20 0 20
−80 −60 −40 −20 0 20 40 60 80 −120
−100 −80 −60 −40 −20 0 20
Z
Y
−100 −80 −60 −40 −20 0 20 40 60
−120 −100 −80 −60 −40 −20 0 20
−80 −60 −40 −20 0 20 40 60 80 −120 −100 −80 −60 −40 −20 0 20
-1.5 s.d.
−80 −60 −40 −20 0 20 40 60 80 −120 −100 −80 −60 −40 −20 0 20
Radius
Scaphoid
Trapezium
Trapezoid Capitate Hamate Pisiform Triquetrum
Ulna
Lunate
mean Z
X
−80 −60 −40 −20 0 20 40 60 80 −120 −100 −80 −60 −40 −20 0 20
+1.5 s.d.
(a)
[image:4.612.77.559.53.269.2](b)
Fig. 2. (a) The poses of the first component (top row, lateral view) and the second component (bottom row, AP view) of the simple pose model. In each case the mean±1.5s.d. are shown. (b) X-ray image showing the anatomical context of the carpal bones
IV. GLOBALRIGIDPARAMETER ANDPOSEMODEL
PARAMETERESTIMATION
As illustrated in figure 1, by usingVS,VSseg and the pose
model, the global rigid pose and poses of the individual carpal bones can be estimated in sequence, aligning the correspond-ing bones in VS and VT (target volumes). The registration
process is to find the pose parameters that best align the corresponding bones inVS andVT by producing an optimum
similarity value. The cost function that measures the similarity, and optimisation method for estimating the pose parameters are described in the following subsections.
A. Similarity Measurement
To evaluate the similarity between the corresponding bone regions inVSandVT, we investigated several forms of the cost
function (normalised correlation coefficient, sum of squared differences and mutual information based on intensities), achieving the best results from the one shown in equation (7), based on the difference of the normalised gradient magnitude of the two images. We define the Normalised Sum of Squared Difference (NSSD) between two images GS andGT as:
E = ( ∑
j∈C(GS(T(j))−GT(j))
2
w )
0.5
(7)
whereCrepresents the region of interest (ROI) corresponding to each specific bone and j indexes the voxels of C inGT.
The ROI is a region slightly larger than the bone volume, obtained by a dilation of 10 voxels along the three axis. w is the total number of voxels in C.GS(T(j))andGT(j)are
the normalised values derived from the image gradient in the transformed template ROI image and the corresponding target image respectively, which are generated by equation (8).
GS(T(j)) =
1
(1 +µMS(T(j)))
, GT(j) =
1 (1 +µMT(j))
(8)
whereT is the transformation (inverse to our estimated pose transformations) applied toC from target volume to template volume.MS andMT represent the gradient magnitude of the
smoothed VS and VT respectively. VS andVT are smoothed
by a 7x7x7 Gaussian kernel with variance equal to 1 voxel (0.5 mm).µ was experimentally set to 0.1. Example images of the original CT slice and corresponding normalised gradient magnitude images are shown in figure 3.
Fig. 3. top: CT slice, bottom: corresponding normalised gradient magnitude.
B. Optimisation
[image:4.612.322.550.424.569.2]simultaneously at each iteration (Step 3 in figure 1) When the translation and rotation parameters are estimated, only the volume with corresponding wrist position is used to evaluate the cost function. In estimating the scale factor,s, on the other hand, volumes from all wrist positions are used to evaluate the cost function (summation of the cost function values). At the end of the registration, a set of translation and rotation parameters are obtained that correspond to the poses of the individual bones, and a single global scale factor is calculated for all wrist positions of the same subject. Individual scale factors for each bone are calculated in the local refinement stage (section V). Scale invariance is important for pose model generation.
The optimization method we use is a simplified version of the Brent-Powell method [18], requiring a smaller number of optimisation steps. We use parabola fitting to replace the Brent line search in the Brent-Powell method. The multi-dimensional search space (θ={tx, ty, tz, r1, r2, r3, s} andbm) is explored by iterative individual 1D line searches. For each parameter search, the cost function is evaluated at the current position, positive and negative neighbour positions (defined by a search range), then an optimum is found by fitting a parabola to the 3 evaluated positions. The optimum is iteratively refined by reducing the search range until convergence. More details can be found in [19].
V. SIMULTANEOUSREGISTRATION ANDSEGMENTATION FORLOCALPOSEREFINEMENT
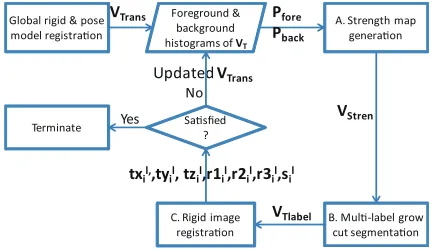
After performing the global rigid and pose model transfor-mation, the template bones are approximately aligned with the bones in the target volume. Some local misalignment may still remain requiring a further step to refine the local pose of each bone. In this section, we introduce an integrated segmentation and registration method, which combines the multi-label Grow-Cut segmentation [1] and intensity-based registration. This method, illustrated in Fig. 4, is developed from that described in our previous paper [15], improved in several respects. To make this paper self contained, the fol-lowing description includes details of the previously published version.
The main objective of the method is to estimate βi={txli,
tyl
i,tzil,r1li,r2il,r3li,sli}for theithbone, improving its
regis-tration accuracy. The use of combined segmentation and rigid registration is preferred over non-rigid registration methods for this application. Finding the accurate pose parameters to align the bones is important for the SPM building. Non-rigid registration tends to deform the shape rather than finding the optimum pose. If rigid registration is performed individually, the topology of the bones may not be preserved and the bone volumes may overlap. This is overcome by combining the registration with multi-label Grow-Cut segmentation. In Grow-Cut, multiple labels are calculated simultaneously at each iteration and region overlapping is forbidden. It helps to make the registration more robust to the initial starting pose, and also acts as a soft constraint to preserve the topology of the bones. Subsequently, the segmentation results VT labelcan
be used to build the statistical shape model of each bone. The
overview of the framework is illustrated in figure 4; each of the key steps is described in the following subsections.
Global rigid & pose model registra!on
VTrans A. Strength map
genera!on
B. Mul!-label grow cut segmenta!on Pfore
Pback
VStren
C. Rigid image registra!on
VTlabel
Updated VTrans
No
Sa!sfied ? Terminate Yes
Foreground & background histograms of VT
[image:5.612.329.546.92.217.2]txil,,tyil, tzil,r1il,r2il,r3il,sil
Fig. 4. Overview of the integrated segmentation and registration system corresponding to box 4 in figure 1.
A. Strength Map Generation
There are two key elements in Grow-Cut segmentation [1]. They are the current label at each voxel and a strength map associated with the image. The strength map indicates the ‘energy’ of the corresponding voxel, which is used to determine if the corresponding label can be propagated to its neighbours at each iteration. Since each labeled bone from VSseg(segmentation ofVS) has been roughly aligned with the
target volumeVT through previous registrations, the labels for
VT can be therefore initialised using the transformed VSseg,
denoted asVT rans. InVT rans, all overlapped bone areas are set
to zero, as new labels shouldn’t be introduced. The initial label
VT rans will be evolved according to the associated strength
map.
Here we present a novel method for initialising the strength
map VStren for Grow Cut. The objective is to initialise this
map with values of 1 (high certainty) and 0 (low certainty) of being either bone or non-bone. To obtain theVStren, an initial
binary volume, VbwT rans (bone=1, non-bone=0) is generated
from VT rans. The normalised foreground and background
histograms calculated from the overlap of VbwT rans and the
target volume VT allow us to calculate the probability that
a voxel belongs to the foreground (Pf ore) or background
(Pback). Using Eqn. (9), we calculate the likelihood (VL)
of classifying each voxel as bone (positive) or non-bone (negative), from which Eqn. (10) and (11) generate new binary volumes (VbwL1,VbwL2) representing high certainty regions of
bone and non-bone respectively. The thresholds of 0.9 and -0.5 were determined empirically.VbwL3(Eqn. (12)) represents the
region ofVT that is not classified as bone either inVbwT ransor
VbwL1. Equation (13) identifies the regions that are identified
with certainty to be bone or non-bone, based on the histograms (Pf oreandPback), constrained to be within the respective bone
and non-bone regions defined byVbwT rans. Following Grow
Cut relabelling,VbwT rans andVStren are calculated for each
iteration step.
VL =
(Pf ore(VT)−Pback(VT))
max(Pf ore(VT), Pback(VT)))
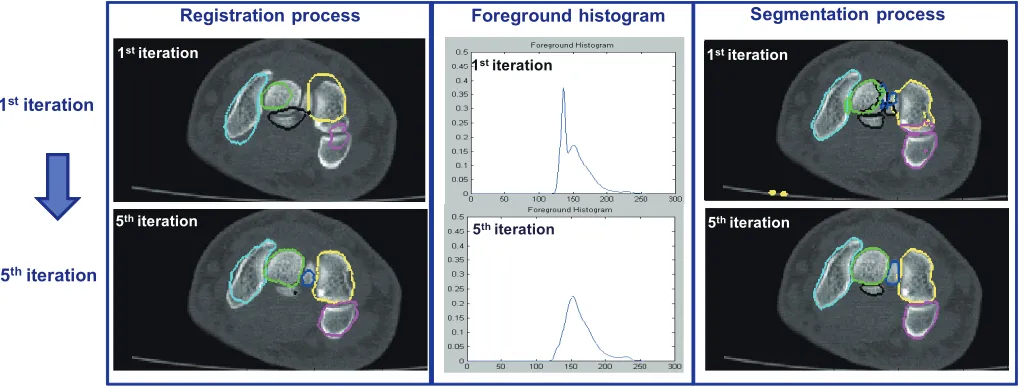
Foreground histogram
Registration process Segmentation process
1stiteration
5thiteration
1stiteration 1stiteration
5thiteration 5thiteration
1stiteration
[image:6.612.52.562.53.247.2]5thiteration
Fig. 5. Process of integrated segmentation-registration iteration for registering the template volume (coloured contours) to a target volume of a different subject. At first (global) registration the correspondence between the template and target volumes is poor resulting in the inclusion of a significant region of background in the foreground histogram. The segmentation step improves the correspondence of the bones. At a later iteration the registration and the foreground histogram are improved. The resulting segmentation step results in good agreement between the segmentation and the target volume.
VbwL1={
1 if VL>0.9
0 otherwise (10)
VbwL2={
1 if VL<−0.5
0 otherwise (11)
VbwL3= 1−(VbwT rans∪VbwL1) (12)
VStren= (VbwL2∩VbwL3)∪(VbwT rans∩VbwL1) (13)
B. Multi-class Grow Cut Segmentation
The advantages of Grow Cut in this application are its ability to obtain a multi-label solution in simultaneous iteration, and the capacity for fast parallel implementation. The segmentation labels of ten bones (carpal bones plus radius and ulna) need to be updated simultaneously, helping to preserve bone topology. For efficiency the Grow Cut code was parallelised using NVidia Quadro FX 3800 Graphic Card via the CUDA API [20].
In our proposed framework, the strength map VStren is
initialised automatically in step A (Fig. 4), andVT rans (from
step A or updated from step C) is used as the labeled volume. Since, there is only a small number of uncertain voxels with
VStren = 0 at each iteration, it takes less than 2 seconds to
complete the segmentation of a141×268×169volume. The segmentation volume is denoted asVT label.
C. Rigid Image Registration
Following the segmentation, rigid image registration is performed. The cost function expressed in equation (14) is used as the similarity measurement in which a new term is added to the cost function described in equation (7). Since each bone has a unique label, the new cost function term tends to ‘drag’ the template bones to the corresponding segmented regions, which preserves the topology of the bones.
Elocal =E+ (
∑
j∈C(BS(T(j))−BT(j))
2
w )
0.5
(14)
E is the gradient-based cost function in equation (7). BS
and BT are the ROI binary image obtained from VSseg
and the corresponding binary image obtained from VT label
respectively. Other notations are the same as in equation (7). The optimisation method is the same as described in section IV-B. A new VT rans is then obtained by using the updated
transformation parameters.
D. Iteration and Termination
Step A to C are repeated; the segmentation volume, reg-istration parameters and the intensity histograms coherently improve each other until the termination conditions are satis-fied (the difference of the segmented volumeVT label between
−30 −20 −10 0 10 20 30 −30 −20 −10 0 10 20 30 −30
−20 −10 0 10 20 30
-1.5 s.d.
−30 −20 −10 0 10 20 30 −30 −20 −10 0 10 20 30 −30
−20 −10 0 10 20 30
mean
−30 −20 −10 0 10 20 30 −30 −20 −10 0 10 20 30 −30
−20 −10 0 10 20 30
[image:7.612.92.521.53.166.2]+1.5 s.d.
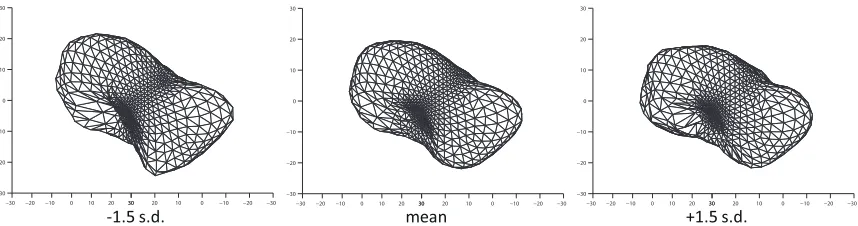
Fig. 6. The first component of the shape model of the scaphoid. The mean±1.5s.d. are shown.
the registration only method, in terms of the sensitivity to the initial bone pose. This was evaluated in [15].
VI. STATISTICALSHAPEMODELGENERATION
The shape of the bones varies among different subjects. A SSM of each bone in the wrist is also important for pathology diagnosis. The key step of generating a SSM is to establish correspondences across subjects. In some approaches this has been achieved using deformable registration (e.g. [12], [21], [22]). However, in these studies the principal aim is to establish shape, rather than pose correspondence. In the context of our framework, it is important to determine the correct relative bone poses, and deformable registration would tend to change the shape of the bones rather than finding the correct pose. This would result in a less accurate SPM, so rigid registration is preferred. It would be possible to apply deformable registration after rigid alignment. In this case the computational cost depends on the selected deformable model. The final result is highly dependent on the regularisation method applied, and may be difficult to correct if increased accuracy is required. In our proposed framework, the shape differences between the corresponding bones of different individuals are accommo-dated by the segmentation process. Following the automatic registration and segmentation framework, the segmentation result can be directly used for the SSM construction. Our SSM is based on the Point Distribution Model (PDM- for example [23]). This requires the establishment of point correspondences between bones of different subjects, for which we use the well-known minimum description length (MDL) algorithm [6]. One training example is described by (x1, y1, z1, ...x1002,y1002,
z1002) t (1002 points on each bone). The coordinates of the
shape points of each bone are expressed with respect to its own centroid. The statistical shape model,oi, is then described as,
oi=µ q
i +ν
q ib
q
i (15)
whereµqi andνiq (qis a notation indicating the shape parame-ters) are the mean shape and the principal subspace matrix for the ith bone.bqi is the shape model parameter for generating new valid bone shapes. Figure 6 shows the shapes that arise by varying the first component of SSM of the scaphoid.
VII. FRAMEWORKINTEGRATION
Each part of the framework (figure 1) has been described in previous sections. Two important issues need to be further explained to complete the framework.
Firstly, in order to increase the robustness of the framework, the CT volumes are pre-processed to construct a multi-scale pyramid (downsampled by a factor of 2 at each level). In the optimisation procedure, the same set of initial search ranges is used at each level for both the global and local registrations (described in section VIII). The search ranges are divided by 2 each time the criteria are met, and the whole process is terminated when the maximum value of the search ranges is smaller than a pre-set threshold. To avoid the optimisation becoming trapped in local minima, a stochastic optimisation procedure is used for global parameter (wrist pose and scale factor) and pose model parameter (carpal bone pose) estimation, as follows:
1) Starting from zero transformation and orientation, opti-mise the poses of the bones of all input wrist volumes. 2) Record the best cost function value for each pose. 3) Randomly alter the starting value of the parameters for
unsatisfied poses (defined in step 4) within the possible parameter space, and optimise again.
4) Repeat steps 2 and 3. Terminate the random process for the pose if the best function value of that pose remains unchanged for 5 times or the number of iterations exceeds 20.
This stochastic process is only performed on the lowest pyramid level for computational efficiency and robustness.
VIII. EVALUATION
We evaluated our framework based on CT data from 25 subjects (10 female and 15 male, median age 51, age range 25 - 72 years), recruited from the hand clinic at Salford Royal Hospital, Greater Manchester, UK. Eight of these subjects were diagnosed radiologically as suffering from scaphoid-lunate dissociation (referred to as the ‘abnormal’ group in the following discussion), the remainder being assessed not to have this condition (referred to as the ‘normal’ group). Each subject was imaged at five different wrist positions: neutral, and four extreme positions in radial-ulnar and flexion-extension movement. The wrist positions were held on a specially designed foam. Each of the CT volumes is captured by a GE LightSpeed VCT machine with a very low-dose exposure. The exposure from all 5 scans was 20 mGy. The acquisition parameters were: tube voltage of 80kV, focal spot of 0.7 mm, slice thickness of 0.625 mm, pixel spacing of 0.29×0.29 mm2. The volumes were re-sampled by tri-linear interpolation to iso-cubic volumes of 0.5×0.5×0.5mm3prior to the registration and segmentation. We found that higher resolution (e.g. 0.25×0.25×0.25 mm3) did not produce a much better accuracy of the segmentation and registration but required much larger memory and longer computational time. Using the interactive method described in [15] we obtained the segmentation of each of these subjects in the neutral position and the transformation parameters that relate the neutral position to the extreme positions for that subject. The segmentations at each position were validated by an experienced clinician. These segmented and registered images were used as ground truth in the evaluation of the automated framework described here.
In our experiments, each of the 25 subjects was selected as the template and registered with the remaining 24 subjects in turn. The registration order to other subjects was randomly sequenced. In the optimisation procedure, the same set of fixed initial search ranges was used at each level for both the global and local registrations (4 voxels for translation, 4π/180 for rotation, 0.2 for scale and one standard deviation for pose model parameters). The framework terminated when the largest search range was smaller than 0.1.
A. Registration Results
To evaluate the registration results, we transformed the mesh points of each bone in neutral position to other positions using the ground truth registration parameters and our esti-mated registration parameters respectively, for each subject. Then the 3D Euclidean distances of each corresponding mesh point between the two transformed meshes for each bone are measured (known as mean target registration error (mTRE) [24]). The registration errors are presented in table I, showing the measurements from 25 (different initial template) × 24 (subjects) ×5 (positions) tests. The errors were only calcu-lated based on successful registrations, defined by the outlier rejection scheme (section VII). Specifically, for each bone, the successful registration rate is the total number of instances of that bone included by the outlier rejection algorithm divided by the total number of tested volumes. As shown in table I,
registration achieved sub-voxel accuracy (mean error of 0.34
±0.27 mm). The successful registration rate of each bone across all tests are also presented in table I. The successful registration rate for most bones is very high. The main exception is the ulna which is much lower than the others. The shape of the ulna is highly symmetric and its movement varies greatly between individuals. In some individuals, there is relatively little movement, while in others there may be significant movement. Of the others, the lowest successful registration rate occurred in the trapezoid. This bone has a nearly spherical shape, making calculation of the orientation rather unstable. It is also the smallest of the carpal bones.
The standard deviation of the success rate indicates that the success rate and registration error are not very sensitive to the selection of initial template, as the SPM is updated each time a new subject is included, and the failed registrations are revisited in a larger loop. In our 25 independent tests, based on different initial template, 19 or 20 out of 25 subjects were consistently successfully registered (all positions successfully aligned) and used for final SPM generation. Subjects were excluded from model building if any of the positions for that subject were rejected by the automatic framework. In each rejected subject the failed positions arose because of misalignment of either the ulna or trapezoid (or both).
TABLE I
MEAN AND STANDARD DEVIATION REGISTRATION ERRORS(MEASURED BY MEANTARGETREGISTRATIONERROR IN MM)AND THE SUCCESSFUL
REGISTRATION RATE OF EACH BONE BASED ON USING EACH OF THE25 SUBJECTS IN TURN AS THE INITIAL TEMPLATE.
Bones Ulna Radius Triquetrum Lunate Scaphoid mTRE (mm) 0.29±0.24 0.22±0.17 0.33±0.26 0.42±0.34 0.43±0.33 SucRate (%) 80.2±3.7 99.8±0.5 95.6±3.1 96.7±2.0 97.3±2.2 Bones Pisiform Hamate Capitate Trapezoid Trapezium mTRE (mm) 0.39±0.30 0.28±0.21 0.4±0.34 0.38±0.33 0.30±0.25 SucRate (%) 95.3±3.1 97.1±1.0 93.1±7.6 90.9±3.1 97.1±1.9
B. Statistical Pose Model Updating
Only the first two significant components of the SPM were used throughout the whole registration across all subjects. When the SPM is updated at each iteration, the percentage of variations captured by the first two significant components decreases. The percentage variation represented by the first two components in the evolving process of the SPM over the 25 independent tests is shown in figure 7. This converged to 92% to 93% variation, irrespective of the registration sequence and initial template selection. An animation of generating intermediate poses by varying the first two components of the final SPM can be found in the supplementary material. In our experiments, including more PCA components did not increase the registration accuracy. This also indicates that the integrated registration and segmentation local refinement step works very well based on the starting pose provided by the pose model.
C. Segmentation Result
0 2 4 6 8 10 12 14 16 18 20 0.91
0.92 0.93 0.94 0.95 0.96 0.97 0.98 0.99 1
Number of subjects included for SPM generation
Perc
en
tage of var
[image:9.612.70.282.56.223.2]iations covered by the first two components
Fig. 7. The percentage of variation covered by the first two significant components in SPM updating process. Each line represents the use of a different subject as the template.
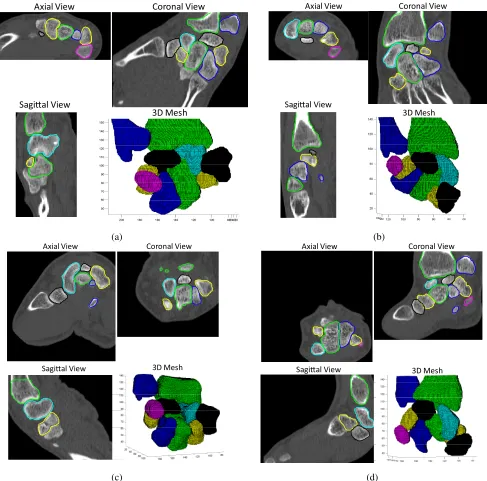
the Jaccard similarity coefficient [26]), presented in table II, showing the mean and standard deviation from 25 independent tests using different initial template subjects. The Tanimoto coefficient measures similarity between two sample sets, and is defined as the size of the intersection divided by the size of the union of the sample sets. The coefficient is between [0,1], where 1 indicates perfect overlap of the compared images. These segmentation results, arising entirely from the automated framework without further refinement, show a high level of segmentation accuracy and repeatability. An example of the automatically segmented carpal bones is presented in figure 8, showing the sagittal, axial and coronal view with the 3D mesh model.
TABLE II
THETANIMOTO COEFFICIENT COMPARING THE GROUND TRUTH SEGMENTATION AND AUTOMATICALLY CALCULATED SEGMENTATION FOR
EACH BONE. THE MEAN AND STANDARD DEVIATION ARE SHOWN,BASED ON25INDEPENDENT TESTS USING DIFFERENT INITIAL TEMPLATE
SUBJECTS.
Bones Ulna Radius Triquetrum Lunate Scaphoid TC 0.86±0.10 0.88±0.06 0.90±0.06 0.88±0.10 0.87±0.09 Bones Pisiform Hamate Capitate Trapezoid Trapezium TC 0.90±0.10 0.91±0.03 0.83±0.10 0.82±0.09 0.90±0.10
D. Pathology Detection
In previous sections, we presented a complete framework for automatically generating a SPM and SSM across subjects at different positions. In this section, we demonstrate the effectiveness of the SPM and SSM by applying them to pathology detection and quantification. Using a ‘standard’ SPM and SSM, the relative poses of the carpal bones can be measured and recorded as ‘standard’. One condition that may be assessed using this measurement is bone dissociation, where the 3D distance between the bones is larger than normal. Scaphoid-Lunate dissociation is one of the most common of these and we use it as an example to demonstrate the method of using the SPM and SSM for diagnosis.
Since the bone spaces may vary at different wrist positions, the constructed ‘standard’ measurement tool needs to be position dependent. One major advantage of using the SPM is that the wrist from different positions can be aligned directly based on the SPM values. The first two components of our SPM cover more than 90% of the observed variation in the full range of flexion-extension and radial-ulnar movements. The combination of the two components is also able to generate interpolated positions within the motion range. To simplify the problem, here we only demonstrate the pathology detection tool based on radial-ulnar deviation movement, which is the most appropriate for diagnosing Scaphoid-Lunate dissociation. 1) Building the ‘Standard’ Scaphoid/Lunate Model: 14 subjects in the normal group, each at 3 different positions (neutral and extreme radial-ulnar deviation), were used to build the ‘standard’ measurement model. Each of the 14×3 target volumes is aligned with the final SPM (based on 25 subjects, each at 5 wrist positions) from the registration framework (section VII) to obtain the poses of the individual bones, and hence the scaphoid-lunate distance. Since there are not enough samples that cover the full range of continuous positions, we interpolated (cubic spline) the positions at integer intervals of the pose model parameter (Fig. 2) between the neutral position and two extreme positions of radial-ulnar deviation for each subject. This results in the training volumes being grouped at each integer interval of the 2nd component of the
SPM parameter. (The second component of the SPM mainly represents radial-ulnar movement- see Fig. 2).
To diagnose the Scaphoid-Lunate dissociation conditions, the ‘standard’ range of distances between these two bones need to be calculated and recorded. The ‘standard’ SSM represents a range of shapes for each bone. To maintain consistency in the measurement of distances, each carpal bone is represented by its mean shape. The SSM has the same number of surface points (1002) on each bone. The point correspondences between different bones are established by using the index of the mesh points on the surface. Here we used evenly down-sampled number of surface points N (N=100 in our case) to reduce the memory usage and improve the computational efficiency. If each of thejthselected surface points on the Lunate and Scaphoid of thekth sample volume
at position ϕ are represented as lk
ϕ,j and s
k
ϕ,j respectively,
the relative distance between the Scaphoid and Lunate was calculated as,
dkϕ,j=lkϕ,j−skϕ,j (16)
dk
ϕ,j is a 3 ×1 vector (X,Y and Z axis). Then the mean
differencesmϕ,j and covariance matrixCϕ,j of thejth point
pair based on all k samples at position ϕ can be obtained. Equation 16 shows that we calculate and record the distances for each pair of points. Subsequently, the average Mahalanobis distance (MD) between the newly accessed data and the model is calculated using equation (17).
mϕ=
1 N
N
∑
j=1
√ (dnew
ϕ,j −mϕ,j)TCϕ,j−1(d new
Axial View Coronal View
Sagial View
3D Mesh
(a)
Axial View Coronal View
Sagial View
3D Mesh
(b)
Axial View Coronal View
Sagial View 3D Mesh
(c)
Axial View Coronal View
Sagial View 3D Mesh
[image:10.612.58.545.52.533.2](d)
Fig. 8. The axial view, coronal view, sagittal view and 3D mesh model of automatically segmented wrists at (a) Radial deviation (b) Ulnar deviation (c) flexion (d) Extension positions of different subjects. The unlabelled bones that appear in some images are parts of the metacarpal bones which are not included in the segmented template. The coloured lines of the 2D-slices correspond to the colours in the 3D mesh models.
2) Wrist Diagnosis: To assess a new wrist, the image is firstly registered to the template volume using the proposed framework. After the SPM parameters are estimated, the measurement of the input image can be compared with the ‘standard’ model at the corresponding wrist positions. Addi-tionally, the mean shape of the SSM is used to represent each of the assessed carpal bones, where the point correspondences between Scaphoid and Lunate were already established. The MD (Eqn. (17)) is then calculated to indicate the degree of abnormality of the subject. Seventy-five volumes (three wrist positions from each of the 25 subjects) were registered by the proposed framework. The MDs of 64 automatically and successfully registered volumes are presented in figure 9. The
positive rate (FPR) in identifying individual abnormal wrist position.
−400 −30 −20 −10 0 10 20 30 40
1 2 3 4 5 6
2nd component of SPM parameter (radial−ulnar motion)
[image:11.612.53.294.97.289.2]Mahalanobis distance
Fig. 9. The Mahalanobis distances of 22 subjects at a range of wrist positions for Scaphoid-Lunate measurement. Red squares represent abnormal subjects; black crosses are normal subjects.
0 0.1 0.2 0.3 0.4 0.5 0.6 0.7 0.8 0.9 1 0
0.1 0.2 0.3 0.4 0.5 0.6 0.7 0.8 0.9 1
False positive rate (1−Specificity)
True positiv
e rate (Sensitiv
ity)
ROC curve
Fig. 10. ROC curve for individual wrist position diagnosis.
IX. DISCUSSION
Statistical pose models of articulated joints in 3D are potentially highly useful in imaging studies aimed at assessing abnormal kinematics [4], [13], [27]. We have previously described [27] the use of models built in this way for in-ference of 3D kinematics based on 2D image sequences, and demonstrated that this can be achieved with sufficient accuracy to allow meaningful clinical measurements to be
made. However, the task of building such a model, requiring accurate segmentation of each bone in a complex joint in several articulated positions, is a daunting one. We argue that the model needs to incorporate the position variation arising from the articulation (kinematics) and the variation in shape of bones between individuals. In this study we have demonstrated a method for building such models, which exploits the facts that identical bones from the same individual are represented in different positions, and that the positions are similar between individuals. The method learns a statis-tical pose model, while simultaneously generating accurate segmentations. The use of rigid registration integrated with segmentation has allowed us to decouple the issues of pose and shape, as it is only the latter that is relevant for segmentation. Convergence of the iterative framework is assisted by using the evolving model to constrain the registration. This approach has something in common with combined group-wise registration and model building [12], where the registration avoids the selection of an arbitrary template. In this case the number of articulated components adds several degrees of freedom to the problem, and we have based the registration on a single template example. However, we have demonstrated that the combined registration and segmentation is insensitive to the template selection. The variation in pose of the bones at different joint positions results in a requirement for interactive initiation of the registration in the template example. The segmentation step works by having an initial approximate segmentation from the registration of the bones across different positions, which suggests the use of methods developed for semi-interactive segmentation (e.g. Graph-Cut [28], Grow-Cut [1] and Random Walker [29]). We evaluated some such methods; the efficient multi-label propagation of segmentation provided by grow-cut made it ideal for this purpose. The iterative refinement of the grow-cut strength map means that, should further interactive segmentation prove necessary after the final convergence, this can easily be accommodated within the framework. Our observed segmentations were sufficiently good to make this step unnecessary in this case. The segmenta-tion showed high consistency with ground-truth and sub-voxel registration accuracy was achieved.
We demonstrate the effectiveness of the statistical pose and shape model built using our automatic framework by using it to identify scaphoid-lunate dissociation. Scaphoid-lunate dissociation is most apparent in wrist positions along the radial-ulnar movement. The model was able to represent the kinematics with sufficient precision to allow the abnormal cases to be identified with high sensitivity and specificity. The use of a SPM for this purpose allows images from different sets of articulated positions to be aligned directly with the model using the SPM values. This confers an advantage over, for example, the method described in [11], where comparisons are made by aligning the wrists at a limited number of pre-defined positions.
REFERENCES
[1] V. Vezhnevets and V. Konouchine,Grow-Cut - Interactive Multi-Label
[image:11.612.57.293.359.601.2][2] J. Boisvert, F. Cheriet, X. Pennec, H. Labelle and N. Ayache,Geometric variability of the scoliotic spine using statistics on articulated shape
models, IEEE Trans. Med. Imag., vol. 27, no. 4, pp. 557C568, Apr.
2008.
[3] A. Rasoulian, R. N. Rohling and P. Abolmaesumi, A statistical
multi-vertebrae shape+pose model for segmentation of CT images,
Proc. SPIE 8671, Medical Imaging 2013: Image-Guided Procedures, Robotic Interventions, and Modeling, 86710P (March 12, 2013); doi:10.1117/12.2007448.
[4] N. Baka, M. de Bruijne, T. van Walsum, B. L. Kaptein, J. E. Giphart, M. Schaap, W. J. Niessen and B. P. F. Lelieveldt,statistical shape model
based femur kinematics from biplane fluoroscopy, IEEE Trans. Med.
Imag., vol. 31, no. 8, pp. 1573C1583, Aug. 2012.
[5] X. Chen, J. Graham, C. E. Hutchinson and L. Muir, Inferring 3D
kinematics of carpal bones from single view fluoroscopic sequences,
MICCAI 2011, volume 6892/2011, pp. 680-687, 2011.
[6] R. H. Davies, C. Twining, T. F. Cootes and C. J. Taylor,Building 3-D
Statistical Shape Models by Direct Optimisation, IEEE Transactions on
Medical Imaging, 29(4), pp. 961-980, 2010.
[7] T. B. Sebastian, H. Tek, J. J. Crisco and B. B. Kimia,Segmentation of carpal bones from CT images using skeletally coupled deformable
models, Medical Image Analysis, 7(1), pp. 21-45, 2003.
[8] M. Koch, A. G. Schwing, D. Comaniciu and M. Pollegeys,Fully
au-tomatic segmentation of wrist bones for arthritis patients, International
Symposium on Biomedical Imaging: From Nano to Macro, pp. 636-640, 2011.
[9] J. Duryea, M. Magalnick, S. Alli, L. Yao, M. Wilson and R. Goldbach-Mansky, Semiautomated three-dimensional segmentation software to quantify carpal bone volume changes on wrist CT scans for arthritis
assessment, Medical Physics, 35(6), pp. 2321-2330, 2008.
[10] A. Zhang, A. Gertych and B. Liu,Automatic bone age assessment for
young children from newborn to 7-year-old using carpal bones, Comput
Med Imaging Graph, 31(4-5), pp. 299-310, 2007.
[11] M. van deGiessen, G. J. Streekstra, S. D. Strackee, M. Maas, K. A. Grimbergen, L. J. van Vliet and F. M. Vos,Constrained Registration
of the Wrist Joint, IEEE Transactions on Medical Imaging, 28(12), pp.
1861-1869, 2009.
[12] T. F. Cootes, C. J. Twining, V. S. Petrovic, K. O. Balalola, C. J. Taylor:
Computing Accurate Correspondences across Groups of Images, IEEE
Transactions on Pattern Analysis and Machine Intelligence, vol 32, pp.1994-200, 2010.
[13] M. van deGiessen, M. Fournani, F. M. Vos, S. D. Strackee, M. Maas, L. J. van Vliet, K. Grimbergen and G. J. Streekstra,A 4D statistical
model of wrist bone motion patterns, IEEE Transactions on Medical
Imaging, 31(3), pp. 613-625, 2012.
[14] G. E. Marai, D. H. Laidlaw, J. J. Crisco,Super-Resolution Registration
Using Tissue-Classified Distance Fields, IEEE Transactions on Medical
Imaging, 25(2), pp. 177-187, 2006.
[15] X. Chen, J. Graham and C. E. Hutchinson, Integrated framework for
simultaneous segmentation and registration of carpal bones, the18th
IEEE International Conference on Image Processing (ICIP), pp. 433-436, Belgium, 2011.
[16] J. J. Craig,Introduction to Robotics: Mechanics and Control, Addison-Wesley Publishing Company, Inc., 1989.
[17] G. P. Penney, J. Weese, J. A. Little, P. Desmedt, D. Hill, D. Hawkes,
A comparison of similarity measures for use in 2D-3D medical image
registration, MICCAI, vol 1496, pp. 1153-1161, 1998.
[18] W. H. Press, S. A. Teukolsky, W. T. Vetterling, and B. P. Flannery,
Numerical Recipes in C++, 2nd ed. Cambridge, U.K.: Cambridge Univ.
Press, 2002.
[19] X. Chen, M. Varley, L. Shark, G. Shentall and M. Kirby,A computa-tionally efficient method for automatic registration of orthogonal X-ray
images with volumetric CT data, Physics in Medicine and Biology, vol
53, 967-983, 2008.
[20] www.nvidia.com/object/cuda home new:html
[21] J. P. Thirion,Image matching as a diffusion process: an analogy with
Maxwell’s demons, Medical Image Analysis, vol. 2, pp. 243-260, 1998.
[22] D. Rueckert, L. I. Sonoda, C. Hayes, D. L. G. Hill, M. O. Leach and D. J. Hawkes,Nonrigid registration using free-form deformations: application
to breast MR images, IEEE Transactions on Medical Imaging, vol. 18(8),
pp. 712-721, 1999.
[23] T. F. Cootes, D. Cooper, C. J. Taylor and J. Graham, Active Shape
Models - Their Training and Application., Computer Vision and Image
Understanding. 61(1), pp. 38-59, 1995.
[24] E. B. van de Kraats, G. P. Penney, D. Tomazevic, T. van Walsum, and W. J. Niessen,Standardized evaluation methodology for 2-d -
3-d registration, IEEE Transaction on Medical Imaging, vol. 24(9), pp.
1177C1189, 2005.
[25] D. W. Shattuck, G. Prasad, M. Mirza, K. L. Narr, A. W. Toga,Online
Resource for Validation of Brain Segmentation Methods, Neuroimage,
vol. 45(2), pp. 431-439, 2008.
[26] P. Jaccard, The distribution of the flora in the alpine zone, New Phytologist, vol. 11(2):37-50, 1912.
[27] X. Chen, J. Graham, C. Hutchinson and L. Muir,Automatic Inference and Measurement of 3D Carpal Bone Kinematics from Single View
Fluoroscopic Sequences, IEEE Transactions on Medical Imaging, Vol
32(2), pp.317-328, 2013.
[28] Y. Boykov and M. P. Jolly,Interactive graph cuts for optimal boundary
and region segmentation of objects in n-d images, In Proc. of the
International Conference on Computer Vision, vol. 1, pp. 105C112, 2001.