Cell Reports
Resource
High-Resolution Replication Profiles Define
the Stochastic Nature of Genome Replication
Initiation and Termination
Michelle Hawkins,1,4Renata Retkute,1,4Carolin A. Mu¨ller,1Nazan Saner,2Tomoyuki U. Tanaka,2
Alessandro P.S. de Moura,3and Conrad A. Nieduszynski1,*
1Centre for Genetics and Genomics, School of Life Sciences, Queen’s Medical Centre, The University of Nottingham,
Nottingham NG7 2UH, UK
2Centre for Gene Regulation and Expression, The University of Dundee, Dow Street, Dundee DD1 5EH, UK
3Institute for Complex Systems and Mathematical Biology, SUPA, King’s College, The University of Aberdeen, Aberdeen AB24 3UE, UK 4These authors contributed equally to this work
*Correspondence:[email protected] http://dx.doi.org/10.1016/j.celrep.2013.10.014
This is an open-access article distributed under the terms of the Creative Commons Attribution License, which permits unrestricted use, distribution, and reproduction in any medium, provided the original author and source are credited.
SUMMARY
Eukaryotic genome replication is stochastic, and
each cell uses a different cohort of replication
ori-gins. We demonstrate that interpreting
high-resolu-tion
Saccharomyces cerevisiae
genome replication
data with a mathematical model allows
quantifica-tion of the stochastic nature of genome replicaquantifica-tion,
including the efficiency of each origin and the
distri-bution of termination events. Single-cell
measure-ments support the inferred values for stochastic
origin activation time. A strain, in which three origins
were inactivated, confirmed that the distribution of
termination events is primarily dictated by the
sto-chastic activation time of origins. Cell-to-cell
vari-ability in origin activity ensures that termination
events are widely distributed across virtually the
whole genome. We propose that the heterogeneity
in origin usage contributes to genome stability by
limiting potentially deleterious events from
accumu-lating at particular loci.
INTRODUCTION
DNA replication initiates at sites called origins of replication and must be completed before cell division. Eukaryotes depend on multiple origins to complete replication of their large linear chro-mosomes in a timely manner (Me´chali, 2010; Siow et al., 2012). Origins are licensed to make them competent to activate by the assembly of a prereplication complex during late mitosis and G1 phase. During the subsequent S phase, a subset of these licensed origins initiates replication (Labib, 2010). Remaining licensed origins, called dormant origins, serve as backups, available to complete replication if required (Blow et al., 2011; Newman et al., 2013).
these TER sites and the genome-wide distribution of replication termination have not been determined.
Here, we present the dynamics of genome replication in S. cerevisiaeat high spatial and temporal resolution. We show that mathematical analysis of ensemble time-course data allows estimation of the stochastic properties of genome replication, such as the efficiency of each origin and the distribution of replication termination events. Independent experimental data, including single-cell measurements, support the inferred sto-chastic properties. Replication termination events are found to be widely distributed over virtually the whole genome. Previously reported TER sites correspond to maxima in the estimated distri-bution but to a minority of total termination events. A strain, in which three origins were inactivated, confirms that the location
0 1 2
Chromosome 14 position (kb)
Relative copy
number
A 15 30
20 35 25 40
Min postrelease
C D
E
F
G
DNA content
90 60 45
5 10 12.5 15 17.5 20 22.5 25 27.5 30 32.5 35 37.5 40 42.5
Asynchronous Alpha arrest cdc7-1 arrest
Min postrelease
Copy number
1 1.2 1.4 1.6 1.8 2
0 10 20 30 40 50 60 70 80 90
Time postrelease(min)
Orc1-6 Mcm2-7 Mcm2-7
Origin activation Origin licensing G1 phase
S phase
ARS606 ARS1412
0 0.01 0.02 0.03 0.04 0.05
0 20 40 60 80 100
Time
0 5 10 15 20 25 30
0 10 20 30 40 50
Tw
(min)
T1/2 (min)
Probability
H
0 1 2
500
100 200 300 400 600 700
Relative copy
number
15
35 25
Minutes postrelease
0 100 200 300 400 500 600 700
10
20
30
40
50
T
rep (minutes)
Chromosome 14 position (kb)
B
Chromosome 14 position (kb) 500
100 200 300 400 600 700
Figure 1. A High Spatial and Temporal Res-olution View of Genome Replication (A) Replication profiles for chromosome 14. The six S phase time points (15, 20, 25, 30, 35, and 40 min)
are relative to release from thecdc7-1zero time
point. Each data point represents the extent of DNA replication in a 1 kb window. Circles on the x axis represent the location of replication origins. (B) Median replication time, Trep, derived from the time-course data shown in (A).
(C) Flow cytometry data for the time-course
experiment (see alsoFigure S1).
(D) Quantification of the flow cytometry data that were used to normalize the deep sequencing data presented in (A).
(E) The two temporally separate stages of repli-cation origin function, licensing and activation, that the mathematical model captures.
(F) Representative origin activation probability
curves for an early activating origin (ARS606) and a
late activating origin (ARS1412; see alsoTable S1).
(G) Median origin activation time correlates with the width of the activation distribution (see also
Figure S2).
(H) Model fit (continuous line) to experimental replication-time-course data (points) for three representative time points.
of termination events is primarily dictated by stochastic origin activation time. In summary, this study demonstrates that high-resolution ensemble methods can be used to quantify the heterogeneity of cellular processes.
RESULTS
High-ResolutionS. cerevisiae
Replication Profiles
We measured the replication dynamics of theS. cerevisiaegenome (Figures 1A and 1B). Deep sequencing was used to measure the DNA copy number change, at 1 kb resolution, as each region of the genome was replicated. A highly syn-chronous S phase was achieved using a double arrest and release protocol (Figure 1C). Samples for deep sequencing were taken at 5 min intervals during S phase, with time points selected to maximize the information about S phase dynamics. Two nonreplicating samples (alpha factor arrest and cdc7-1 arrest) were also sequenced to serve as controls. The extent of DNA replication at each time point was determined by compar-ison to the nonreplicating control samples.
temperature from which the majority of cells released synchro-nously (Figure S1). Comparison of nonreplicating samples (cdc7-1arrest normalized to the alpha factor arrest) showed no evidence of escape replication. Therefore, each of the S phase samples was normalized to thecdc7-1nonreplicating control. Flow cytometry data were used to measure the change in copy number over time (Figures 1C and 1D) and to normalize the deep sequencing data (Yabuki et al., 2002).
The DNA copy number at each S phase time point allowed the extrapolation of the time at which each chromosomal coordi-nate had been replicated in half of the cells, Trep (Figure 1B). Previously, we have shown that sharp peaks in profiles are a consequence of defined replication origin positions. In contrast, smooth valleys result from the range of termination sites that are a consequence of stochastic origin activation time (de Moura et al., 2010; Retkute et al., 2011). However, the resolution of pre-vious studies required smoothing that obscures the sharp origin peaks and could have contributed to the smooth termination val-leys (de Moura et al., 2010). The high spatial resolution of the deep sequencing data negated the need for smoothing. Therefore, the sharp peak signatures of discrete origins can be resolved in
the Trep data. The Trep profiles also showed smooth valleys, consistent with stochastic origin activation time and dispersed termination sites. Consequently, this ensemble data may allow quantification of the stochastic properties of genome replication.
Quantitative Interpretation of Replication-Time-Course Data
An established model (de Moura et al., 2010; Retkute et al., 2011, 2012) was used to quantitatively interpret the genome-wide replication data and determine the stochastic properties. The model incorporates the temporally separated stochastic steps of origin licensing and activation (Figure 1E). Each origin is described by four properties: position, competence (p), median activation time (T1/2), and the width of the activation distribution
(Tw). Here, competence refers to the proportion of cells in which
an origin is licensed. The stochastic activity of an origin is described by an activation curve (Figure 1F).
Using previously determined replication origin locations (Siow et al., 2012), the remaining origin properties could be derived by fitting the model to the experimental replication profiles ( Fig-ure 1H;Table S1). In this analysis, the average replication fork velocity was assumed to be constant and estimated to be 1.6 kb/min—comparable to independent estimates (de Moura et al., 2010; Sekedat et al., 2010; Tuduri et al., 2010; Yang et al., 2010). Analyses of the inferred origin properties showed that there is a positive correlation between T1/2and Tw (
Fig-ure 1G); i.e., the later an origin activates, the more stochastic the activation time (Yang et al., 2010). No significant correlations were observed between other combinations of origin properties (Figure S2). Therefore, combining a mathematical model with high-resolution replication-time-course data allowed the estima-tion of stochastic origin properties.
Stochastic DNA Replication Origin Activity
Single-cell measurements of locus replication times were used to validate the stochastic origin activation times derived from whole-genome replication-time-course data. The replication time of specific loci were assessed using fluorescence micro-scopy (Kitamura et al., 2006; Saner et al., 2013). Origin-proximal loci (ARS727andARS731) were marked bytetandlacoperator arrays, and the binding of fluorescent proteins allowed replica-tion to be assayed by the increase in fluorescent dot intensity. Loci could either be replicated from the proximal origin (active replication) or by forks emanating from a more distant origin (passive replication). Note that ARS726 is just 6 kb from ARS727and may have contributed to the early replication time of the nearby tetoperator array. In each cell, both origin loci were marked and their replication time in multiple individual cells was determined (Figure 2A). From these measurements, we observed that each locus has a variety of replication times, thus providing direct evidence for stochastic origin activation time. Comparison of these single-cell measurements with equiv-alent values derived from the whole-genome time-course exper-iment revealed strikingly similar levels of stochasticity. These single-cell experiments confirmed the degree of stochastic origin replication time at several loci, providing support for the genome-wide values obtained from the ensemble time-course experiment.
C
B
0 50 100 150 200 250 300
0 20 40 60 80 100
Time (min)
Number of forks
0 0.005 0.01 0.015
20 40 60 80 100
0 50 100 150 200 250
Interorigin distance (kb)
Probability
Frequency
ARS727 ARS731
Time after cdc7-1 release (min)
Time after α factor release (min)
Probability
Frequency
Time after cdc7-1 release (min)
Time after α factor release (min)
Probability
Frequency
A
0 0.01 0.02 0.03 0.04 0.05
0 4 8 12 16
0 20 40 60 80 100
20 40 60 80 100 120
0 0.02 0.04 0.06 0.08
0 4 8 12
0 20 40 60 80 100
20 40 60 80 100 120
Standard deviation Time course - 11 min
Single cells - 6 min
Standard deviation Time course - 10 min
[image:3.603.61.296.96.352.2]Single cells - 6 min
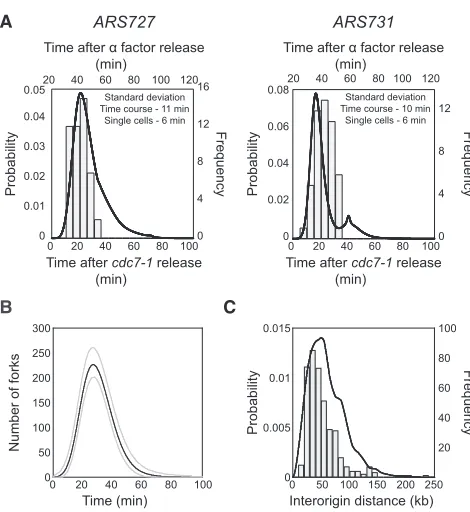
Figure 2. Origin Replication Time Is Stochastic
(A) Replication time ofARS727(left) andARS731(right) are shown as inferred
from time-course data (continuous line; time relative tocdc7-1release shown
on lower x axis) and single-cell measurements (histogram; time relative toa
factor release shown on upper x axis). Equivalent S phase time points for
cdc7-1andafactor release were determined by flow cytometry (data not
shown). For the single-cell data, n = 48 (see alsoFigure S2C).
(B) The mean number of replication forks during S phase (min. post-cdc7-1)
inferred from the time-course data (gray lines represent the range covering 95% of the population).
(C) Distance between active replication origins inferred from time-course data (continuous line; probability distribution) and from published DNA-combing
Stochastic origin activation time gives rise to significant cell-to-cell variability in the pattern of genome replication. The data from the ensemble time-course experiment allowed the quantifi-cation of this variability and its comparison to independent experimental measures. For example, the number of active repli-cation forks varies throughout S phase and across a population due to cell-to-cell differences in origin usage (Figure 2B). These derived fork numbers are consistent with biological estimates for the number of replisomes based on protein abundance in yeast cells (Ghaemmaghami et al., 2003; Mantiero et al., 2011; Tanaka et al., 2011). Furthermore, the stochastic activity of origins can cause occasional large distances between active origins. The population distribution for the distances between active origins was calculated from the whole-genome time-course data. The resulting distribution shows that large interactive origin distances are very rare, and it closely mirrors independent experimental estimates from published single-molecule experiments (Tuduri et al., 2010;Figure 2C).
In summary, the stochasticity observed in the whole-genome replication timing data can be accounted for by stochastic origin activity. Here, we provide direct supporting evidence for stochastic origin activation time from single-cell measurements. Furthermore, this variability in origin activity gives rise to vari-ability in the number of replication forks and a range of distances between active origins, both of which we estimate and find to be comparable to independent experimental measurements.
Genome-wide Quantification of Origin Efficiency
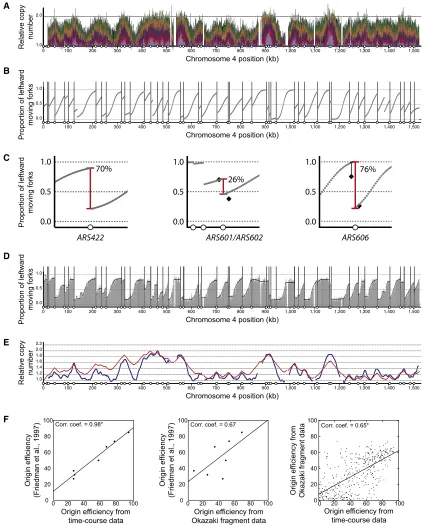
One consequence of stochastic origin activity is that each cell uses a different cohort of origins in S phase. Interpretation of the replication-time-course data allowed the estimation of the efficiency of each origin in the genome. The gradient in replication time-course profiles (Figure 3A) corresponds to the proportion of forks that were moving left/rightward at each location in the genome (Baker et al., 2012; de Moura et al., 2010). Steep gradi-ents indicate that a large proportion of forks were moving in one direction, whereas shallow gradients resulted from a mixture of left- and rightward-moving forks. Therefore, genome-wide fork direction can be determined from the replication profiles. In Fig-ure 3B, the gray curve indicates the proportion of leftward-moving forks; regions above 0.5 (e.g., 845–900 kb) contained predominantly leftward-traveling forks, whereas regions below 0.5 resulted from a majority of forks moving rightward. Each of the data points contains analogous information to a fork-direction gel. Variations in the proportion of leftward-moving forks are a consequence of replication initiation or termination events. Active replication origins give rise to sharp changes in the predominant fork direction (Figure 3C). Therefore, these data allowed the determination of the efficiency of initiation and termination events. For example, upstream of originARS422,90% of forks were traveling leftward, whereas downstream of the same origin, 20% were traveling leftward. Therefore, we can conclude that ARS422was active in70% of cells (Figure 3C, left). The ampli-tude of these step sizes allows the determination of the efficiency of every genomic replication origin.
We compared inferred replication fork-direction data with direct experimental measurements. Fork-direction gels have been used to systematically determine the proportion of forks
moving in each direction at a range of locations across chromo-some 6 (Friedman et al., 1997). InFigure 3C, measurements from fork-direction gels are shown by black diamonds for locations flanking two example origins (ARS601/ARS602 andARS606). In each case, despite the difference in experimental approach, remarkably similar values for fork direction were obtained. Consequently, these independent approaches give near iden-tical estimates of origin efficiency (see below).
A recent genome-wide study measured the density of Okazaki fragments (Smith and Whitehouse, 2012). These data provide a further independent experimental measure of fork direction ( Fig-ure 3D). In these experiments, Okazaki fragments were purified from cells undergoing a perturbed S phase (checkpoint-inacti-vated strain with a period of DNA ligase depletion). To test whether these perturbations altered global replication dynamics, we compared it with a replication-timing experiment that used an unperturbed S phase and was performed in the same strain background (Mu¨ller and Nieduszynski, 2012). Just as the gradi-ents of replication profiles indicate the proportion of forks mov-ing in each direction, the reciprocal mathematical transformation allowed relative replication time to be derived from fork-direction data (Baker et al., 2012; Retkute et al., 2012). In this way, relative replication time was directly compared between an Okazaki fragment purification experiment and a sort-seq experiment ( Fig-ure 3E). The positive correlation (correlation coefficient of 0.83) between the two measurements of relative replication time provides clear evidence that the perturbations employed to isolate Okazaki fragments do not dramatically alter the kinetics of DNA replication. Therefore, the whole-genome Okazaki frag-ment data provide a reliable measure of replication fork direction from which the efficiency of each origin can be estimated.
We compared the three independent experimental measures of replication origin efficiency: calculated from fork-direction gels (Friedman et al., 1997); inferred from the replication time-course experiment; and inferred from the mapping of Okazaki fragments (Smith and Whitehouse, 2012). Clear and statistically significant positive correlations were observed for the compari-sons between origin efficiencies inferred from the time-course data and each of the other experimental measures (Figure 3F). The lack of a statistically significant correlation between fork-direction gels and the Okazaki fragment data may be a conse-quence of differences in the strain background (A364a and S288c, respectively), experimental noise, and/or the low number of data points. Comparison of the two independent genome-wide estimates of origin efficiencies revealed a notable number of outliers. These outliers might be explained by the strain differ-ences or the difficulty in determining the efficiency of two closely spaced origins. There are examples where one approach called one member of an origin pair active and the other inactive and vice versa. Despite these caveats, there is a clear positive corre-lation between the independent approaches to determining origin efficiency, demonstrating that it is possible to quantify the variability in origin usage resulting from stochastic origin activity.
A
B
C
D
E 0.0 0.5 1.0
0 100 200 300 400 500 600 700 800 900 1,100 1,200 1,300 1,400 1,500
Proportion of leftward
moving forks
Chromosome 4 position (kb)
0 100 1.0 2.0
200 300 400 500 600 700 800 900
Chromosome 4 position (kb)
Relative copy
number
0.0 0.5 1.0
0 100 200 300 400 500 600 700 800 900 1,000 1,100 1,200 1,300 1,400 1,500
Proportion of leftward
moving forks
Chromosome 4 position (kb)
1.0 1.2 1.4 1.6 1.8 2.0 2.2
0 100 200 300 400 500 600 700 800 900 1,000 1,100 1,200 1,300 1,400 1,500
Relative copy
number
Chromosome 4 position (kb)
0 20 40 60 80 100
0 20 40 60 80 100
Origin efficiency from time-course data
Origin ef
ficiency
(Friedman et al., 1997)
Corr. coef. = 0.98*
0 20 40 60 80 100
0 20 40 60 80 100
Origin ef
ficiency
(Friedman et al., 1997)
Origin efficiency from Okazaki fragment data
Corr. coef. = 0.67
0 20 40 60 80 100
0 20 40 60 80 100
Origin ef
ficiency from
Okazaki fragment data
Origin efficiency from time-course data
Corr. coef. = 0.65*
1.0
0.0 0.5
ARS422
70%
ARS601/ARS602
1.0
0.0 0.5
26%
ARS606
1.0
0.0 0.5
76%
F
Proportion of leftward
moving forks
1,000 1,100 1,200 1,300 1,400 1,500
[image:5.603.93.519.101.626.2]1,000
Figure 3. Genome-wide Replication Fork Direction and Origin Efficiency from Time-Course Data
(A) Replication profile for chromosome 4 (as described forFigure 1A).
(B) Proportion of leftward-moving forks across chromosome 4 inferred from replication-time-course data. Vertical lines mark the location of active origins, at each of which there is a sharp transition from leftward- to rightward-moving forks.
(C) Proportion of leftward-moving forks for 50 kb regions centered onARS422(left),ARS601/ARS602(center), andARS606(right). Red vertical lines indicate the
magnitude of the transition from leftward- to rightward-moving forks and the efficiency of the origin. Black diamonds indicate the proportion of leftward-moving
forks at four chromosome 6 locations as previously determined by fork-direction gels (Friedman et al., 1997); for the location to the left ofARS606, the value was
determined to be >75% and origin activity was estimated to be 74%.
(D) Proportion of leftward-moving forks across chromosome 4 derived from mapping Okazaki fragments. Grey shading indicates the raw data with a fitted curve
shown in black (origin locations are marked as in [B];Smith and Whitehouse, 2012).
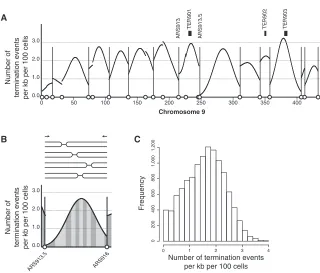
100 cells across chromosome 9. Termination events are widely distributed rather than located at a small number of isolated high-probability termination sites. Regions between active ori-gins (marked with vertical lines inFigure 4A) contain a greater probability of termination events, but these are also spread over large ranges. A previous study mapped 71 termination sites (TERs) that together cover3% of the genome (Fachinetti et al., 2010). These TERs coincide with loci identified as having a greater than average probability of a termination event ( Fig-ure 4A). However,182 termination events (excluding telomeric events) were estimated per cell from the time-course data, of which only8.7 (4.8% of the total) are within the TER sites. Therefore, these data are consistent with previously character-ized TER sites, but the TER sites represent only a minority of all termination events.
[image:6.603.53.373.94.367.2]Two stochastic components of replication origin activity give rise to a range of termination sites. First, variable origin efficiency results in different cohorts of origins being used between cells. Second, the relative activation time of two neighboring origins varies (Figure 2A), giving rise to a range of termination sites be-tween active origins. For example, the active originsARS913.5 and ARS916 (active in 74% and 56% of cells, respectively) gave rise to a dispersed distribution of replication termination events between them. The probability of a termination event is equal within each of the alternately shaded areas shown in Figure 4B. Across the whole genome, there is a similar pattern with replication termination events at virtually every location
(E) Replication time expressed as relative copy number derived from Okazaki fragment data (red;Smith and Whitehouse, 2012) or directly by deep sequencing
(blue;Mu¨ller and Nieduszynski, 2012).
(F) Pairwise comparisons of origin efficiency determined from the time-course data, from fork-direction gels (Friedman et al., 1997), and from mapping Okazaki
fragments (Smith and Whitehouse, 2012). Pearson correlation coefficients are given (*p < 0.0001).
0.0 1.0 2.0 3.0
0 50 100 150 200 250 300 350 400
Chromosome 9 A
B
TER901 TER90
2
TER90
3
0.0 1.0 2.0 3.0
ARS913.5 ARS916
Number of termination events per kb per 100 cells
Frequency
0 1 2 3 4
0
200
400
600
800
1,000
1,200
C
ARS913.5
ARS913
Number of
termination events per kb per 100 cells
Number of
termination events per kb per 100 cells
Figure 4. Replication Termination Events Are Dispersed Across the Genome (A) The distribution of replication termination events across chromosome 9 inferred from repli-cation-time-course data. Replication origins are
marked as inFigure 3B with two origins discussed
in the main text labeled; previously described
termination sites are marked (Fachinetti et al.,
2010). Genome-wide data are shown inFigure S3.
(B) Termination events between ARS913.5and
ARS916 are shown using exemplars above the
inferred distribution. Alternately shaded areas each have an equal probability of a termination event (one termination event in every ten cells). (C) The genome-wide frequency distribution for the probability of termination events per kb per 100 cells.
(Figure 4C). This dispersed distribution is consistent with replication termination sites being a consequence of stochastic origin activity, rather than sequences that favor termination.
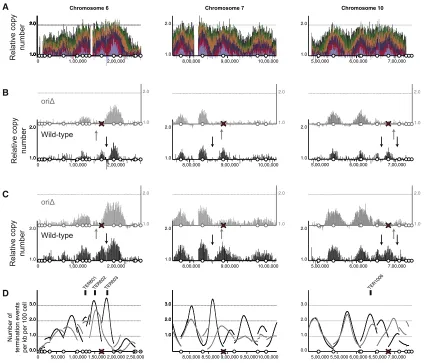
To test whether replication origin activ-ity is responsible for the location of termi-nation events, we inactivated three active origins:ARS606,ARS731.5, andARS1021(Figure 5A). At each of these origins, origin recognition complex (ORC) binding was abolished by introducing a four-base-pair mutation in the ORC-binding site at the native chromosomal loci. The introduced mutations eliminate origin activity on a plasmid (Figure S4). The replication dynamics of this triple-origin mutant were character-ized as described above for the wild-type. The profiles show that unperturbed chromosomes replicate similarly to the wild-type (Figure S5). Regions of chromosomes 6, 7, and 10, that are distant from the inactivated origins, also replicate with similar kinetics to the wild-type (Figures 5B and 5C). Comparison of early S phase time points from the wild-type and origin mutant revealed the lack of copy number peaks associated with the mutated origins (Figures 5B and 5C). Therefore, the ORC-bind-ing site mutations abolished chromosomal origin function.
events at this location (Figure 5D, left). Furthermore, there is no evidence for a delay in replication fork progression through this region (gray data in Figures 5B and 5C). Inactivation of ARS731.5 and ARS1021 alter the distribution of termination events in an analogous manner. In each case, when origins are inactivated, the most probable location for termination events clearly moves (Figure 5D). We conclude that particular genomic features do not fix the location of termination events; instead, they are determined by the activity of the flanking origins.
DISCUSSION
Here, we show that deep sequencing measurements of copy number changes during a synchronous S phase produce the spatial and temporal resolution required to perform a highly quantitative analysis of genome replication. Combining
experi-mental data with a mathematical model (Retkute et al., 2011) enabled the estimation of the behavior of individual origins, including the stochastic properties. This demonstrates that the stochastic characteristics of individual genomic loci can be inferred from high-resolution ensemble data.
The mathematical model used to interpret the data made the assumption that replication fork velocity is on average constant, an assumption with wide experimental support (de Moura et al., 2010; Sekedat et al., 2010; Tuduri et al., 2010; Yang et al., 2010). This model allowed the inference of the stochastic properties of genome replication, including variation in origin activation time and competence, from high-resolution population ensemble time-course data. These stochastic properties leave a signature in the ensemble data that is not altered by the degree of cell-cycle synchronization within the population (de Moura et al., 2010; Retkute et al., 2011). Single-cell and single-molecule A
B
C
D
Relative copy
number
oriΔ
Chromosome 6
1.0 1.0 1.0 1.0 1.0 1.0 1.0 1.0 1.0 1.0 1.0 1.0 1.0 1.0 1.0 1.0 1.0 1.0 1.0 1.0 1.0 1.0 1.0 1.0 1.0 1.0 1.0 1.0 1.0 1.0 1.0 1.0 2.0 2.0 2.0 2.0 2.0 2.0 2.0 2.0 2.0 2.0 2.0 2.0 2.0 2.0 2.0 2.0 2.0 2.0 2.0 2.0 2.0 2.0 2.0 2.0 2.0 2.0 2.0 2.0
0 1,00,0000 2,00,00022 0
0 1,00,000 2,00,00022 1.0
1.0 2.0 2.0
1.0 2.0
1.0 2.0
0 1,00,0000 2,00,0000
1.0 2.0
8,00,0000 9,00,000 10,00,000 1.0
2.0
1.0 2.0
8,00,000 9,00,000 10,00,000 1.0
2.0
Chromosome 7
8,00,000 9,00,000 10,00,000 1.0
2.0
1.0 2.0
Relative copy
number
Relative copy
number
1.0 2.0 2.0 3.0 3.0
8,00,000 8,50,000 9,00,000 9,50,00010,00,000
5,00,000
5 6,00,0006 7,00,000 2.0
1.0
1.0 2.0 Chromosome 10
5,00,0000
5 6,00,0006 7,00,000 1.0
2.0
5,00,000 5,50,000 6,00,000 6,50,000 7,00,000 0.0
1.0 2.0 3.0
5,00,0000 6,00,000 7,00,000 1.0
2.0
1.0 2.0
0 50,000 1,00,000 1,50,000 2,00,000 2,50,000 0.0
0.0 1.0 1.0 2.0 2.0 3.0 3.0
TER603
TER601TER602 TER1006
Number of
termination events per kb per 100 cell
Wild-type
oriΔ
[image:7.603.94.518.100.463.2]Wild-type
Figure 5. Inactivation of Replication Origins Results in Redistribution of Termination Events
(A) Replication profile for chromosome 6 and regions of chromosomes 7 and 10 (as described forFigure 1A).
(B and C) Comparisons of equivalent time points from the wild-type (black data) and origin mutant (gray data) are shown for each chromosomal region. Time points were selected to ensure equivalent levels of genome-wide DNA synthesis; time points are 15 and 20 min (wild-type) and 20 and 25 min (origin mutant) in (B) and (C), respectively. Vertical arrows indicate the inferred location of the highest probability termination sites.
(D) The inferred distribution of replication termination sites for the wild-type (black) and the origin mutant (gray). Data displayed as inFigure 4A. A red cross marks
measurements were consistent with the estimated variability in origin activity (Figure 2). As reported previously (Yang et al., 2010), there is greater variability in the activation time of later-activating origins. This is consistent with origin activation time being a stochastic process, for example determined by affinity for a limited number of activating molecules (Douglas and Diffley, 2012). Crucially, stochastic origin activity is responsible for vari-ability in genome replication, including differences in origin us-age and sites of replication termination. As discussed below, these differences can contribute to genome stability, thus under-lining the importance of stochastic origin activity.
We have estimated the proportion of S phases in which each replication origin activates, referred to as the efficiency of an origin. There is a strong correlation between these estimates and those previously determined for origins on chromosome 6 (Figures 3C and 3F). Across the genome, 459 origin sites (Siow et al., 2012) were considered, of which an estimated average of 285 sites are licensed and 198 activated per cell (Table S1). Those licensed sites that do not activate (dormant origins) are passively replicated and are potential backup origins, available to rescue replication if forks stall irreversibly (Blow et al., 2011; Newman et al., 2013). Therefore, the stochastic nature of origin activation time gives rise to dormant origins that can contribute to surviving replicative stress and ensuring genome stability.
Replication initiation sites are discrete chromosomal loci defined by the binding of the ORC and the Mcm2-7 complex. By contrast, replication termination events are widely distrib-uted (Figure 4). In a population of cells, the majority of the genome (>75%;Figure 4C) is within 1 kb of a termination event in at least 1% of cells. For context, the most probable termina-tion sites will only experience a terminatermina-tion event per kb in 3.9% of cells. The distribution of termination sites that we find is consistent with and greatly extends previously reported termi-nation (TER) sites (Fachinetti et al., 2010). Those TER sites were found to colocate with particular chromosomal features, including tRNAs and centromeres. However, our observation that these sites constitute only a small minority of all termination events, combined with observations that such sites do not pause replication forks (Azvolinsky et al., 2009), suggest that they do not directly influence termination, although we note that the current available resolution does not rule out the possi-bility that particular sequence properties might influence the precise location of termination events. Perturbing genome repli-cation, by the inactivation of three active replication origins, tested how termination sites are specified. The inactivated origins did not globally alter the pattern of genome replication, allowing investigation of the consequences for termination. The inactivations resulted in changes in the location of termina-tion sites, consistent with origin activity being the principal influence over the distribution. Recently reported genome-wide perturbations to DNA replication origin activity also resulted in relocalization of termination events (McGuffee et al., 2013). These findings are consistent with the observed distribution of base substitutions in a mutator strain, which were hypothesized to be a consequence of considerable vari-ability in fork termination sites (Larrea et al., 2010). We conclude that the diversity in termination sites can be explained by the
variability in origin usage and stochastic activation time—both likely to be properties of origin function in all eukaryotes.
Therefore, replication termination in eukaryotes contrasts with the highly regulated termination (with replication fork traps) in bacteria (Duggin et al., 2008). A consequence of the diversity in termination sites (and variability in origin usage) observed in eu-karyotes is that there will be variability in which regions of the genome are latest replicating between cells within a population. Both replication termination and late replication per se have been linked to genome instability. Late replication is associated with fragile sites (Letessier et al., 2011) and elevated mutation rates (Agier and Fischer, 2012; Lang and Murray, 2011; Stamatoyan-nopoulos et al., 2009; Weber et al., 2012). Failure to correctly resolve merging replication forks during termination can result in unreplicated DNA and pathology (Rudolph et al., 2013; Stei-nacher et al., 2012). Although eukaryotes have multiple mecha-nisms to limit these errors, a small proportion will escape repair and contribute to genome instability. By dispersing these sites across the genome, eukaryotes may limit the potentially delete-rious accumulation of mutations at particular loci.
EXPERIMENTAL PROCEDURES
Yeast Strains and Cell-Cycle Synchrony
The wild-type strain was RM14-3A (MATa cdc7-1 bar1 his6 trpl-289 ura3-52
leu2- 3,7 12, A364a background [McCarroll and Fangman, 1988]). The triple
autonomously replicating sequence consensus sequence (ACS) mutant strain was an RM14-3A derivative constructed by sequentially replacing the ACS at
ARS606,ARS731.5, andARS1021with an inactivated version (4 bp mutation).
The resulting strain was backcrossed three times to produce the strain
(MHY200) used for deep sequencing. To visualize loci near ARS727and
ARS731, tetOx224 (11.2 kb) and lacOx256 (10.1 kb) were integrated by a
two-step ‘‘pop-in and pop-out’’ method. tetOx224 was integrated to
chromo-some 7 at 660,847 bp (from the left telomere) within theARS727replicon.
lacOx256 was integrated to chromosome 7 at 842,709 bp within the
ARS731replicon (Saner et al., 2013). Plasmids and oligonucleotide sequences are available upon request.
Cells grown in standard rich YPD media were treated with 200 nMafactor
for 4 hr at 23C. Cells were then shifted to 38C and treated with 0.2 mg/ml
pro-nase. After 2.5 hr at 38C, cells were cooled rapidly to 23C. The cell culture
was incubated at 23C and samples collected every 2.5 min for flow cytometry
analysis and every 5 min for isolation of genomic DNA.
Deep Sequencing
Deep sequencing was performed on the AB SOLiD 4 analyzer platform. Sequencing libraries were made using the NEB Next kit (New England Biolabs) as advised by the manufacturer. Each sequencing sample was assigned 1/16 of an AB SOLiD sequencing slide. Resulting reads were mapped to the 2003
S. cerevisiaereference genome using Bioscope 1.3.1 (Life Technologies).
Each sequenced sample yielded 10–25 million 50 bp reads, equivalent to
50- to 100-fold coverage per base.
Data Analysis
Mathematical Modeling
An existing DNA replication model (de Moura et al., 2010; Retkute et al., 2011,
2012) was extended to the whole genome. Origin activation time distributions
were described by a Hill’s type function with median activation time T1/2 and the width of the activation distribution Tw. Model equations and derived
quantities are given in theSupplemental Experimental Procedures.
A genetic algorithm was used to estimate fork velocities and origin parame-ters (p, T1/2, and Tw) by minimizing the sum of the square of the differences between experimentally measured relative copy number data and model
esti-mations. An existing open-source implementation was used (http://ftp.mcs.
anl.gov/pub/pgapack/).
Fluorescence Microscopy
The procedures for live-cell imaging were described previously (Kitamura
et al., 2006). Briefly, time-lapse images were collected at 25C (ambient tem-perature). For image acquisition, we used a DeltaVision RT microscope
(Applied Precision), UPlanSApo 1003objective lens (Olympus; NA 1.40), a
CoolSnap HQ CCD camera (Photometrics), and SoftWoRx software (Applied Precision). Cyan fluorescent protein and GFP signals were discriminated
with the 89006 ET filter set (Chroma). We acquired nine z-sections (0.7mm
apart), which were subsequently analyzed with Volocity (Improvision) soft-ware. Replication timing of the loci, where tetO and lacO arrays were
inte-grated, was determined as described previously (Kitamura et al., 2006; Saner
et al., 2013).
ACCESSION NUMBERS
The NCBI Gene Expression Omnibus (http://www.ncbi.nlm.nih.gov/geo/)
accession number for the data reported in this paper is GSE48561.
SUPPLEMENTAL INFORMATION
Supplemental Information includes Supplemental Experimental Procedures,
five figures, and one table and can be found with this article online athttp://
dx.doi.org/10.1016/j.celrep.2013.10.014.
ACKNOWLEDGMENTS
We thank S. Malla, R. Wilson, and M. Blythe for DNA sequencing at Deep Seq (University of Nottingham). This work was supported by the Biotechnology and Biological Sciences Research Council (BBSRC; BB/E023754/1, BB/ G001596/ 1, BB/F00513X/1, and BB/K007211/1) and the Wellcome Trust (080737, 081918, 083524, and 096535). C.A.N. is a BBSRC David Phillips Fellow. T.U.T. is a Wellcome Trust Principal Research Fellow.
Received: July 24, 2013 Revised: September 18, 2013 Accepted: October 7, 2013 Published: November 7, 2013
REFERENCES
Agier, N., and Fischer, G. (2012). The mutational profile of the yeast genome is
shaped by replication. Mol. Biol. Evol.29, 905–913.
Azvolinsky, A., Giresi, P.G., Lieb, J.D., and Zakian, V.A. (2009). Highly tran-scribed RNA polymerase II genes are impediments to replication fork
progres-sion in Saccharomyces cerevisiae. Mol. Cell34, 722–734.
Baker, A., Audit, B., Chen, C.L., Moindrot, B., Leleu, A., Guilbaud, G., Rap-pailles, A., Vaillant, C., Goldar, A., Mongelard, F., et al. (2012). Replication fork polarity gradients revealed by megabase-sized U-shaped replication
timing domains in human cell lines. PLoS Comput. Biol.8, e1002443.
Bechhoefer, J., and Rhind, N. (2012). Replication timing and its emergence
from stochastic processes. Trends Genet.28, 374–381.
Blow, J.J., Ge, X.Q., and Jackson, D.A. (2011). How dormant origins promote
complete genome replication. Trends Biochem. Sci.36, 405–414.
Dalgaard, J.Z., Eydmann, T., Koulintchenko, M., Sayrac, S., Vengrova, S., and Yamada-Inagawa, T. (2009). Random and site-specific replication termination.
Methods Mol. Biol.521, 35–53.
de Moura, A.P., Retkute, R., Hawkins, M., and Nieduszynski, C.A. (2010). Mathematical modelling of whole chromosome replication. Nucleic Acids
Res.38, 5623–5633.
Donaldson, A.D., Fangman, W.L., and Brewer, B.J. (1998). Cdc7 is required
throughout the yeast S phase to activate replication origins. Genes Dev.12,
491–501.
Douglas, M.E., and Diffley, J.F. (2012). Replication timing: the early bird
catches the worm. Curr. Biol.22, R81–R82.
Duggin, I.G., Wake, R.G., Bell, S.D., and Hill, T.M. (2008). The replication
fork trap and termination of chromosome replication. Mol. Microbiol.70,
1323–1333.
Fachinetti, D., Bermejo, R., Cocito, A., Minardi, S., Katou, Y., Kanoh, Y., Shirahige, K., Azvolinsky, A., Zakian, V.A., and Foiani, M. (2010). Replication termination at eukaryotic chromosomes is mediated by Top2 and occurs at
genomic loci containing pausing elements. Mol. Cell39, 595–605.
Friedman, K.L., Brewer, B.J., and Fangman, W.L. (1997). Replication profile
of Saccharomyces cerevisiae chromosome VI. Genes Cells2, 667–678.
Ghaemmaghami, S., Huh, W.K., Bower, K., Howson, R.W., Belle, A., Dephoure, N., O’Shea, E.K., and Weissman, J.S. (2003). Global analysis of
protein expression in yeast. Nature425, 737–741.
Gilbert, D.M. (2010). Evaluating genome-scale approaches to eukaryotic DNA
replication. Nat. Rev. Genet.11, 673–684.
Kitamura, E., Blow, J.J., and Tanaka, T.U. (2006). Live-cell imaging reveals
replication of individual replicons in eukaryotic replication factories. Cell125,
1297–1308.
Labib, K. (2010). How do Cdc7 and cyclin-dependent kinases trigger the
initiation of chromosome replication in eukaryotic cells? Genes Dev. 24,
1208–1219.
Lang, G.I., and Murray, A.W. (2011). Mutation rates across budding yeast
chromosome VI are correlated with replication timing. Genome Biol. Evol.3,
799–811.
Larrea, A.A., Lujan, S.A., Nick McElhinny, S.A., Mieczkowski, P.A., Resnick, M.A., Gordenin, D.A., and Kunkel, T.A. (2010). Genome-wide model for the
normal eukaryotic DNA replication fork. Proc. Natl. Acad. Sci. USA 107,
17674–17679.
Letessier, A., Millot, G.A., Koundrioukoff, S., Lachage`s, A.M., Vogt, N., Han-sen, R.S., Malfoy, B., Brison, O., and Debatisse, M. (2011). Cell-type-specific
replication initiation programs set fragility of the FRA3B fragile site. Nature470,
120–123.
Mantiero, D., Mackenzie, A., Donaldson, A., and Zegerman, P. (2011). Limiting replication initiation factors execute the temporal programme of origin firing
in budding yeast. EMBO J.30, 4805–4814.
McCarroll, R.M., and Fangman, W.L. (1988). Time of replication of yeast
centromeres and telomeres. Cell54, 505–513.
McGuffee, S.R., Smith, D.J., and Whitehouse, I. (2013). Quantitative,
genome-wide analysis of eukaryotic replication initiation and termination. Mol. Cell50,
123–135.
Me´chali, M. (2010). Eukaryotic DNA replication origins: many choices for
appropriate answers. Nat. Rev. Mol. Cell Biol.11, 728–738.
Mu¨ller, C.A., and Nieduszynski, C.A. (2012). Conservation of replication timing reveals global and local regulation of replication origin activity. Genome Res.
22, 1953–1962.
Mu¨ller, C.A., Hawkins, M., Retkute, R., Malla, S., Wilson, R., Blythe, M.J., Nakato, R., Komata, M., Shirahige, K., de Moura, A.P.S., and Nieduszynski, C.A. (2013). The dynamics of genome replication using deep sequencing.
Nucleic Acids Res.http://dx.doi.org/10.1093/nar/gkt878
genomes of yeasts. Nucleic Acids Res.20. Published online August 19, 2013.
http://dx.doi.org/10.1093/nar/gkt2728.
Raghuraman, M.K., and Brewer, B.J. (2010). Molecular analysis of the
replica-tion program in unicellular model organisms. Chromosome Res.18, 19–34.
Retkute, R., Nieduszynski, C.A., and de Moura, A. (2011). Dynamics of DNA
replication in yeast. Phys. Rev. Lett.107, 068103.
Retkute, R., Nieduszynski, C.A., and de Moura, A. (2012). Mathematical modeling of genome replication. Phys. Rev. E Stat. Nonlin. Soft Matter Phys.
86, 031916.
Reynolds, A.E., McCarroll, R.M., Newlon, C.S., and Fangman, W.L. (1989). Time of replication of ARS elements along yeast chromosome III. Mol. Cell.
Biol.9, 4488–4494.
Rudolph, C.J., Upton, A.L., Stockum, A., Nieduszynski, C.A., and Lloyd, R.G. (2013). Avoiding chromosome pathology when replication forks collide. Nature
500, 608–611.
Saner, N., Karschau, J., Natsume, T., Gierlinski, M., Retkute, R., Hawkins, M., Nieduszynski, C.A., Blow, J.J., de Moura, A.P.S., and Tanaka, T.U. (2013). Stochastic association of neighboring replicons creates replication factories
in budding yeast. J. Cell Biol.202, 1001–1012.
Sekedat, M.D., Fenyo¨, D., Rogers, R.S., Tackett, A.J., Aitchison, J.D., and Chait, B.T. (2010). GINS motion reveals replication fork progression is
remark-ably uniform throughout the yeast genome. Mol. Syst. Biol.6, 353.
Siow, C.C., Nieduszynska, S.R., Mu¨ller, C.A., and Nieduszynski, C.A. (2012). OriDB, the DNA replication origin database updated and extended. Nucleic
Acids Res.40(Database issue), D682–D686.
Smith, D.J., and Whitehouse, I. (2012). Intrinsic coupling of lagging-strand
synthesis to chromatin assembly. Nature483, 434–438.
Stamatoyannopoulos, J.A., Adzhubei, I., Thurman, R.E., Kryukov, G.V., Mirkin, S.M., and Sunyaev, S.R. (2009). Human mutation rate associated with DNA
replication timing. Nat. Genet.41, 393–395.
Steinacher, R., Osman, F., Dalgaard, J.Z., Lorenz, A., and Whitby, M.C. (2012). The DNA helicase Pfh1 promotes fork merging at replication termination sites
to ensure genome stability. Genes Dev.26, 594–602.
Tanaka, S., Nakato, R., Katou, Y., Shirahige, K., and Araki, H. (2011). Origin association of Sld3, Sld7, and Cdc45 proteins is a key step for determination
of origin-firing timing. Curr. Biol.21, 2055–2063.
Tuduri, S., Tourrie`re, H., and Pasero, P. (2010). Defining replication origin
effi-ciency using DNA fiber assays. Chromosome Res.18, 91–102.
Weber, C.C., Pink, C.J., and Hurst, L.D. (2012). Late-replicating domains have higher divergence and diversity in Drosophila melanogaster. Mol. Biol. Evol.
29, 873–882.
Yabuki, N., Terashima, H., and Kitada, K. (2002). Mapping of early firing origins
on a replication profile of budding yeast. Genes Cells7, 781–789.
Yamashita, M., Hori, Y., Shinomiya, T., Obuse, C., Tsurimoto, T., Yoshikawa, H., and Shirahige, K. (1997). The efficiency and timing of initiation of replication of multiple replicons of Saccharomyces cerevisiae chromosome VI. Genes
Cells2, 655–665.
Yang, S.C., Rhind, N., and Bechhoefer, J. (2010). Modeling genome-wide replication kinetics reveals a mechanism for regulation of replication timing.