https://www.scirp.org/journal/ajps ISSN Online: 2158-2750
ISSN Print: 2158-2742
DOI: 10.4236/ajps.2019.1012161 Dec. 31, 2019 2305 American Journal of Plant Sciences
Quantitative Analysis of Pathway Enrichment
within Faba Bean Seeds RNA-Seq (
Vicia faba
L)
Shi Y. Yang1*, Nuredin Habili2, Qi Wu2, Yunjie Wang3, Jiang Li4, Jeffrey G. Paull1
1School of Agriculture Food and Wine, The University of Adelaide, Waite Campus, Waite Road, Urrbrae, SA, Australia 2The Australian Wine Research Institute, Urrbrae (Adelaide) SA, Australia
3BGI-Shenzhen, BGI Tech Solutions Co., Ltd., Beishan Industrial Zone, Shenzhen, China 4BIOZERON Biotech (Shenzhen) Co., Ltd., Shengzhen, China
Abstract
Faba bean (Vicia faba L) seeds are an important source of plant protein for humans and animals. A total of 15,697 Differentially Expressed Genes (DEGs) with pathway annotation were discovered in RNA-Seq of the faba bean seeds. A total of 75 significant KEGG pathways abundance were discov-ered and 9 pathways were conserved within all genotypes. 41 significant pathways were found to be partially conserved within comparisons of 2 to 6 pairs of genotypes and 25 significant pathways were unique to single pairs of genotypes. There were 8 specific significant pathways discovered related to the faba bean seed Hydration Capacity trait and 9 specific significant path-ways discovered related to the PSbMV seeds staining trait. The DEGs dem-onstrated the genetic distance between these varieties was confirmed by the breeding pedigree selection information and a PCA graph clearly illustrated the genetic distance within these genotypes.
Keywords
RNA-Seq (Quantification), Faba Bean (Vicia faba), Seed, Pathway Enrichment, Quantitative Analysis
1. Introduction
Faba bean (Vicia faba L) is one of the most important food and feed legume crops which provide a source of high protein for humans and animals, and it contributes to increased soil fertility through biological nitrogen fixation. It is an ancient crop and is cultivated by small holder Bronze age farms in the Mediter-ranean region [1]. Currently it is widely grown and the annual world production
How to cite this paper: Yang, S.Y., Habili, N., Wu, Q., Wang, Y.J., Li, J. and Paull, J.G. (2019) Quantitative Analysis of Pathway Enrichment within Faba Bean Seeds RNA-Seq (Vicia faba L). American Journal of Plant Sciences, 10, 2305-2334.
https://doi.org/10.4236/ajps.2019.1012161
Received: November 5, 2019 Accepted: December 28, 2019 Published: December 31, 2019
Copyright © 2019 by author(s) and Scientific Research Publishing Inc. This work is licensed under the Creative Commons Attribution International License (CC BY 4.0).
http://creativecommons.org/licenses/by/4.0/
DOI:10.4236/ajps.2019.1012161 2306 American Journal of Plant Sciences of faba bean was 4.8 million tonnes in 2017 (FAOSTAT 2018) [2]. It is a diploid species (2n = 12), with an exceptionally large genome of about 13.4 Gb [3], the largest genome in the grain legume family. RNA-Seq technology has been used to generate genome-wide transcriptome profiles across a wide range of plants including rice [4], maize [5] [6], chickpea [7] [8], field pea [9] [10], Raphanus sativus [11], faba bean [12] [13] [14] [15] [16] and pigeonpea [17]. These studies have described genome-wide gene expression levels in root, leaf, stem, T-cell and seed profiles. There have been reports of extensive pathway analyses in different plant species associated with different traits for six model plants: Arabidopsis thaliana, Oryza sativa, Zea mays, Solanum lycopersicum, Glycine max and Medicago. Expath database pathways of three plants: Arabidopsis thaliana, Oryza sativa, and Zea mays [18], AraPath database as molecular pathways of Arabidopsis [19], A. thaliana nutrient acquisition and general stress response pathways [20], modular expression pattern and new signaling pathways from motifs of Arabidopsis [21], responding to silver ions, cold, salt, drought and heat of Arabidopsis [22]; methylerythritol phosphate pathway associated genes with ceh1 mutuant of Arabidopsis [23], cadmium stress signaling controls in drought stress of rice [24], abiotic stress pathways and proteome analyses of maize [25], roots and leaves pathways associated with salt stress of cotton [26], phytohor-mone biosynthesis and signal transduction pathways of hazelnut ovules [27], pathway of secondary metabolism, transcription factors and transporters in re-sponse to methyl jasmonate of Lycoris aurea [28]. However, there is no quanti-tative pathways analysis reported for faba bean seeds or RNA-seq with associated related seed traits. Hence, we applied RNA-Seq (Quantification) technology to further study Differentially Expressed Genes (DEGs) to discover the KEGG pathway enrichment information within faba bean seeds, both pathways within all seeds in common and the pathways enrichment related to the typical seed traits of Hydration Capacity and Pea seed-borne mosaic virus (PSbMV).
2. Materials and Methods
2.1. MaterialsThe seeds of five faba bean varieties (Farah, Nura, PBA Rana, PBA Warda, and PBA Zahra) and one breeding line (AF06125) were used for the RNA-Seq (Quantification) technology analysis, with three biological samples per genotype. Seed was obtained from a field trial and was stored at room temperature until RNA was extracted 4 months after harvest. These varieties represent the diver-sity among Australian faba bean varieties and include diverse germplasm within their pedigrees [29].
The pedigrees and a brief description of the major traits of these varieties are bellowed:
DOI:10.4236/ajps.2019.1012161 2307 American Journal of Plant Sciences Rana, selected from Manafest//611/Manafest, medium-large seed, mid flo-wering, low level of seed staining due to PSbMV.
PBA Warda, selected from IX038/IX004, resistant to rust, medium size seed, early flowering.
PBA Zahra, selected from 920/Farah, moderately resistant to Ascochyta blight, medium size seed.
AF06125, selected from 286/970//S95005/3/Icarus/Ascot//Farah, resistant to Ascochyta blight, low level of seed staining due to PSbMV, small-medium size seed, mid-season flowering, and high hydration capacity.
2.2. Methods
RNA-Seq (Quantification) and Bioinformatics analysis
RNA-Seq (Quantification) is used to analyze gene expression of certain bio-logical objects under specific conditions [30] [31].
2.2.1. Total RNA Extraction
RNA extraction using RNeasy kit (Qiagen, Australia) according to the manufac-turer’s instructions. The RNA-Seq experimental process shows the steps for the experimental pipeline. During the QC step, Agilent 2100 Bioanaylzer was used to qualify and quantify the sample library. The library products were ready for se-quencing on the Ion Proton platform performed by the Beijing Genomics Insti-tute (BGI-Shenzhen).
2.2.2. RNA Solutions Preparation and Sequencing
The total RNA samples were first treated with DNase I to degrade any possible DNA contamination. Then the mRNA was enriched by using the oligo (dT) magnetic beads. Mixed with the fragmentation buffer, the mRNA was frag-mented into short fragments (about 200 bp). Then the first strand of cDNA was synthesized by using random hexamer-primed reverse transcription. Buffer, dNTPs, RNase H and DNA polymerase I were added to synthesize the second strand. The double strand cDNA was purified with magnetic beads. End repara-tion was then performed. After the previous step, adaptors were ligated to the end of these fragments. Next, ligation products were selected by size and purified on TAE-agarose gel. Finally, the fragments were enriched by PCR amplification, then purified by magnetic beads and dissolved in the appropriate amount of Epstein-Barr solution. During the QC step, Agilent 2100 Bioanaylzer was used to qualify and quantify the sample library. The library products were then ready for sequencing via Ion Proton platform.
2.3. Bioinformatics Analysis Pipeline
DOI:10.4236/ajps.2019.1012161 2308 American Journal of Plant Sciences QC of alignment was performed to determine if resequencing was needed. The alignment data was utilized to calculate distribution of reads on reference genes and mapping ratio. If alignment result passed QC, we proceeded with down-stream analysis including gene expression and deep analysis based on gene ex-pression such as PCA/correlation/screening differentially expressed genes, and further perform deep analysis based on DEGs, including cluster analysis, Gene Ontology analysis and Pathway enrichment analysis.
2.3.1. Sequencing Data Assess
The original image data was transferred into sequence data via base calling, which is defined as raw data or raw reads and saved as BAM file. As the raw reads may contain low quality reads or adaptor sequences, preprocessing was necessary before starting further analysis.
2.3.2. Raw Data Statistics
As there are some adaptor sequences and/or low quality reads present in the raw reads data filtering was carried out to obtain high quality reads as the clean reads (clean data). Filtering steps were as follows:
1) Remove reads where length was less than threshold;
2) Trim reads adapter, if length of trimmed reads was less than threshold, then remove it;
3) Calculate the average quality of 15 bases from 3’ end until the average qual-ity was larger than 10, then trim the bases that have been counted.
After filtering, the remaining reads are called “clean reads” and used for down-stream bioinformatics analysis.
2.3.3. Base Composition, Quality and Length of Clean Data
We performed quality control on clean data through drawing base composition, quality and length distribution charts. ATGC base content refers to the propor-tion of the total bases of the four types of bases. Through detecting the content of ATGC each base to measure the stability of library and sequencing eligibility. The nucleotide distributions at each position were stable under the normal cir-cumstances, non-AT or GC separation. Bases quality reflects the accuracy which can be affected by RNA-Sequencing, reagents or sample quality. If the percen-tage of the bases with low quality is low, then it indicated the sequencing quality is good.
2.3.4. Alignment Assessment
After data quality statistics, clean reads were mapped to gene reference and/or genome reference set.
2.3.5. Alignment Statistics
DOI:10.4236/ajps.2019.1012161 2309 American Journal of Plant Sciences
2.3.6. Sequencing Saturation Analysis
Sequence saturation analysis was used to measure the sequencing data of the sample. The number of detected genes increased with an increase in the number of reads. However, when the number of reads reaches a certain amount, the growth curve of detected genes flattens, which indicates that the number of de-tected genes tends to saturation.
2.3.7. Reads Distribution on Gene
If the randomness is good, the reads in every position would be evenly distri-buted. If the randomness is poor, reads preference to specific gene region will directly affect subsequent bioinformatics analysis. We used the distribution of reads on the reference genes to evaluate the randomness. A distribution of reads position on genes shows that the randomness of RNA fragmentation is better than cDNA fragmentation [32]. Therefore, we used the mRNA fragments to construct the library in the experiment.
2.3.8. Visualization of Genome Alignment
We provide genome alignment data in BAM format and recommend using IGV (Integrative Genomics Viewer) tool to visualize BAM file in different scales. IGV supports loading of multiple samples to do comparison in the same scale, and can view distribution of reads on the Exon, Intron, UTR, and Intragenic regions, which makes it very convenient and intuitional.
2.3.9. Gene Expression
Expression levels of individual Unigenes were quantified using the software package Sailfish [33]. Sailfish quantifies genes expression by k-mer, first, built index files use reference and length of k-mer, then computes maximum likelih-ood abundance estimates using the Expectation-Maximization (EM) algorithm for its statistical model to determine which transcripts are isoforms of the same gene. Expression level was measured in reads per kilobase per million mapped reads (RPKM) according to Equation (1):
6
3 10 RPKM
10 C NL
= (1)
where C is the number of reads that are uniquely aligned to a specified gene (A), N is the total number of reads uniquely aligned to all genes and L is the length of the specified gene (A) in bases. The RPKM values can be directly used for com-paring the difference of gene expression among samples. If there was more than one transcript for a gene, the longest one was used to calculate its expression level and coverage. Linear correlation of RPKM values was used to assess the robustness of experimental comparisons made between genotypes.
2.3.10. Deep Analysis of Gene Expression
DOI:10.4236/ajps.2019.1012161 2310 American Journal of Plant Sciences
2.3.11. Correlation between Genotypes
We calculated the correlation value between each two genotypes based on RPKM results. According to the standard that Encode plan recommends, the square of the correlation value should be ≥0.92 (under ideal experiment envi-ronment and with reasonable samples).
2.3.12. Cluster Tree of All Samples
The distances of expressed genes in samples were calculated by Euclidean me-thod. Meanwhile, the algorithm of Sum of Squares of Deviations was used to calculate the distance between samples so that a cluster tree could be built.
2.3.13. Cluster Analysis of Gene Expression
Genes with similar expression patterns usually have same the functional correla-tion. We performed cluster analysis of gene expression patterns with cluster [34] [35] and java Treeview software [36].
2.3.14. PCA Analysis
Principal component analysis (PCA) can reduce the complexity of the data, and dig deep into the relation between sample size and variation. The basic principle is that diverse samples have different measurements; PCA identifies the main factors of observed value differences, considering all the factors are combined and sorted according to importance. In PCA graph it can see the distance of the relationship between each sample, including visual effect of clusters groups. The PCA analysis is presented as a figure where each dot represents the genotype on the principal component value.
2.3.15. Screening of Differentially Expressed Genes (DEGs)
Screening for DEGs was based on the Poisson distribution method described by Audic & Claverie [37] and corrected P-values using the Bonferroni method [38]. Since DEGs analysis generates a large multiplicity of problems in which thou-sands of hypotheses (is gene x differentially expressed between the two groups) are tested simultaneously, correction for false positive (type I errors) and false negative (type II) errors was performed using the False Discovery Rate (FDR) method [39]. We used FDR ≤ 0.001 and the absolute value of Log2Ratio ≥ 1 as the threshold to judge the significance of gene expression difference.
DEGs screening is aimed to find differentially expressed genes between (within) samples and perform further function analysis on them. We provide three optional methods for screening analysis of differentially expressed genes, respectively: Based on the analysis method of the Poisson distribution; Based on Noiseq package method; Based on EBSeq package method.
DOI:10.4236/ajps.2019.1012161 2311 American Journal of Plant Sciences expression occupies only a small part of the library, x yields to the Poisson dis-tribution with Equation (2):
( )
e! x p x x λλ −
= (λ is the real transcripts of the gene) (2)
The total clean tag number of sample 1 is N1, and total clean tag number of sample 2 is N2; gene A holds x tags in sample 1 and y tags in sample 2. The probability of gene A being expressed equally between two samples can be cal-culated with Equation (3):
( )
0
2 |
i y
i
p i x =
=
∑
( )
( )
0 0
or 2 1 | if | 0.5
i y i y
i i
p i x p i x
= =
= =
× − >
∑
∑
(
)
2(
)
( )1 1 2 1 ! |
! ! 1
y
x y
x y
N p y x
N N x y N + + + = + (3)
We do correction on P-value corresponds to differential gene expression test using Bonferroni method. Since DEG analysis generates a large multiplicity problems in which thousands of hypotheses (is gene x differentially expressed between the two groups) are tested simultaneously, correction for false positive (type I errors) and false negative (type II) errors are performed using FDR method. Assume that we have picked out R differentially expressed genes in which S genes really show differential expression and the other V genes are false positive. If we decide that the error ratio “Q = V/R” must stay below a cutoff (e.g. 5%), we should preset the FDR to a number no larger than 0.05. We use “FDR ≤ 0.001 [40] and the absolute value of Log2Ratio ≥ 1” as the threshold to judge the significance of gene expression difference. More stringent criteria with smaller FDR and bigger fold-change value can be used to identify DEGs.
Based on Noiseq package method (screening DEGs among two groups which contain biological replicates) Noiseq method [41] can screen differentially ex-pressed genes between two groups, showing a good performance when compar-ing it to other differential expression methods, like Fisher’s Exact Test (FET), edgeR, DESeq and baySeq. Noiseq maintains good True Positive and False Posi-tive rates when increasing sequencing depth, while most other methods show poor performance. In addition, Noiseq models the noise distribution from the actual data, so it can better adapt to the size of the data set, and is more effective in controlling the rate of false discoveries.
First, Noiseq uses the sample’s gene expression in each group to calculate log2 (foldchange) M and absolute different value D of all pair conditions to build noise distribution model with Equation (4):
1
2 1 1 12
log and
i
i i i i
i
x
M D x x
x
= = −
DOI:10.4236/ajps.2019.1012161 2312 American Journal of Plant Sciences Second, for gene A, Noiseq computes its average expression “Control-avg” in control group and average expression “Treat-avg” in treatment group. Then the foldchange (MA = log2((Controlavg)/(Treat-avg))) and absolute different value D(DA = |Control-avg-Treat-avg|) will be derived. If MA and DA diverge from noise distribution model markedly, gene A will be defined as a DEG. There is a probability value to assess how MA and DA both diverge from noise distribution model with Equation (5):
{ }
{ }
(
& &)
A A A
P =P M ≥ M D ≥ D (5)
Finally, we screen differentially expressed genes according to the following criteria: Fold change ≥ 2 and diverge probability ≥ 0.8.
2.3.16. Deep Analysis of DEGs
Cluster analyses of DEGs with similar expression patterns usually have the same functional correlation. We perform cluster analysis of DEGs with cluster and ja-va Treeview software [36]. Expression differences are shown in different colors. Red means up regulation and green means down regulation.
2.3.17. Pathway Enrichment Analysis of DEGs
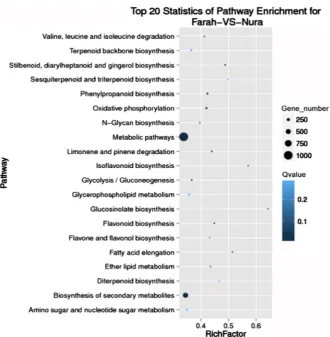
Genes usually interact with each other to play roles in certain biological tions. Pathway-based analysis helps to further understand genes biological func-tions. KEGG (Kyoto Encyclopedia of Genes and Genomes) [38] pathways, the major public pathway-related database, is used to perform pathway enrichment analysis of DEGs. This analysis identifies significantly enriched metabolic path-ways or signal transduction pathpath-ways in DEGs comparing with the whole ge-nome background. The calculating formula as where N is the number of all genes with KEGG annotation, n is the number of DEGs in N, M is the number of all genes annotated to specific pathways, and m is the number of DEGs in M. The calculated p-value goes through Bonferroni Correction [40] method, taking corrected p-value < 0.05 as a threshold. Discovered the most significant path-ways of faba bean seed RNA-Seq, allows us to see their detailed pathway infor-mation in the KEGG database. The pathways showed with their up-regulated genes which are marked with red borders and down-regulated genes with green borders, Non-change genes are marked with black borders. A scatter plot for KEGG enrichment results was generated to display the top 20 enriched pathways (See Figure 1 and Supplementary Figures S1-S14). Rich Factor is the ratio of DEGs numbers annotated in this pathway to all gene numbers. Greater Rich Factor means greater intensiveness. Q-value is corrected p-value ranging from 0~1, and a lower value means greater intensiveness.
2.4. Validation of Hydration Capacity and PSbMV Index
DOI:10.4236/ajps.2019.1012161 2313 American Journal of Plant Sciences
Figure 1. The top 20 pathways enriched in faba bean seed, including gene number and Q value, for the comparison of Farah versus Nura.
with three replicated per genotype/experiment. The standard Hydration Capac-ity test consists of soaking 50 seeds in 150 ml RO water at 22˚C for 16 hours and determining the % change in weight due to uptake of water.
2) 20 samples of each faba bean genotype were sown in a growth room in 2018 and inoculated with PSbMV virus (mechanical inoculation with macerated in-fected field pea leaves mixed with carborundum powder and rubbed on the faba bean leaves) when they were at the two leaf growth stage. Faba bean leaves were collected 6 weeks after inoculation to validate infection by PSbMV using both ELISA assay and RT-PCR sequence. Seeds were harvested at maturity and as-sessed for staining due to PSbMV. Seeds were assigned to one of 6 categories rated as 0 for no staining to 5 for very severe staining and an index Fx of overall staining for the individual sample was calculated by the following Equation (6):
0 0 1 1 2 2 3 3 4 4 5 5 100 5
n n n n n n
Fx
N
∗ + ∗ + ∗ + ∗ + ∗ + ∗
= ∗
∗ (6)
where n = the number of seeds within a category, N = the total number of seeds.
3. Results and Discussion
DOI:10.4236/ajps.2019.1012161 2314 American Journal of Plant Sciences Pathway-based analysis helps to further understand the genes biological func-tions. KEGG (Kyoto Encyclopedia of Genes and Genomes) is the major public pathway-related database (http://www.kegg.jp/kegg/kegg1.html), which is used to perform pathway enrichment analysis of DEGs. This analysis identifies the most significant enriched pathway in DEGs as compared with the whole ge-nome. Detecting the most significantly enriched pathway of DEGs, allowed us to see detailed pathway information in the KEGG database, no matter if the genes are up-regulated or down-regulated. We generated a scatter plot for KEGG enrichment results. Rich Factor is the ratio of number of differentially expressed genes in this pathway to the number of all genes annotated in there. The greater the Rich Factor means the greater the degree of pathway enrichment. The Q value is the corrected p value with the range 0 - 1, where a lower value means greater intensiveness. The top 20 pathways enriched in comparisons between in-dividual genotypes and between phenotype groupings are presented in each comparison (See Figure 1 for Farah vs Nura and Supplementary files Figures S1-S14). These results indicate that most significant enriched pathway is Meta-bolic pathways (ko01100) followed by the Biosynthesis of secondary metabolites (ko01110); Plant hormone signal transduction (ko04075); Plant – pathogen inte-raction (ko04626); ABC transporters (ko02010); Zeatin biosynthesis (ko00908); Stilbenoid, diarylheptanoid and gingerol biosynthesis (ko00945); Phenylpropa-noid biosynthesis (ko00940); Phenylalanine, tyrosine and tryptophan biosynthesis (ko00400); Pentose and glucuronate interconversions (ko00040); N-Glycan bio-synthesis (ko00510); mismatch repair (ko03430); Limonene and pinene degrada-tion (ko00903); Isoflavonoid biosynthesis (ko00943); Glycine, serine and threo-nine metabolism (ko00260); Glycerolipid metabolism (ko00561); Flavonoid bio-synthesis (ko00941); Fatty acid biobio-synthesis (ko00061); Caffeine metabolism (ko00232) and Base excision repair (ko03410).
3.1. Common KEGG Pathways Abundance Discovered within Faba Bean Seeds RNA-Seq
A total of 47,621 expressed genes were identified in faba bean seeds RNA-Seq
[16]. There were 15,697 significant Differentially Expressed Genes (DEGs) with pathway annotation. A total of 266 significant or highly significant enriched pathways were discovered in faba bean seeds by single variety pair comparisons. This was reduced to 75 unique abundance pathways after removal of redundan-cies (See Table 1 and Table 2).
DOI:10.4236/ajps.2019.1012161 2315 American Journal of Plant Sciences
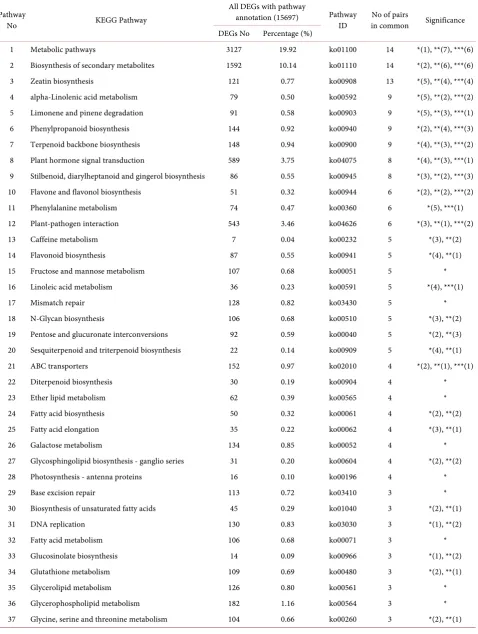
Table 1. KEGG Pathway DEGs numbers within faba bean seeds RNA-Seq.
Pathway
No KEGG Pathway
All DEGs with pathway
annotation (15697) Pathway ID
No of pairs
in common Significance DEGs No Percentage (%)
1 Metabolic pathways 3127 19.92 ko01100 14 *(1), **(7), ***(6) 2 Biosynthesis of secondary metabolites 1592 10.14 ko01110 14 *(2), **(6), ***(6) 3 Zeatin biosynthesis 121 0.77 ko00908 13 *(5), **(4), ***(4) 4 alpha-Linolenic acid metabolism 79 0.50 ko00592 9 *(5), **(2), ***(2) 5 Limonene and pinene degradation 91 0.58 ko00903 9 *(5), **(3), ***(1) 6 Phenylpropanoid biosynthesis 144 0.92 ko00940 9 *(2), **(4), ***(3) 7 Terpenoid backbone biosynthesis 148 0.94 ko00900 9 *(4), **(3), ***(2) 8 Plant hormone signal transduction 589 3.75 ko04075 8 *(4), **(3), ***(1) 9 Stilbenoid, diarylheptanoid and gingerol biosynthesis 86 0.55 ko00945 8 *(3), **(2), ***(3) 10 Flavone and flavonol biosynthesis 51 0.32 ko00944 6 *(2), **(2), ***(2) 11 Phenylalanine metabolism 74 0.47 ko00360 6 *(5), ***(1) 12 Plant-pathogen interaction 543 3.46 ko04626 6 *(3), **(1), ***(2)
13 Caffeine metabolism 7 0.04 ko00232 5 *(3), **(2)
14 Flavonoid biosynthesis 87 0.55 ko00941 5 *(4), **(1) 15 Fructose and mannose metabolism 107 0.68 ko00051 5 * 16 Linoleic acid metabolism 36 0.23 ko00591 5 *(4), ***(1)
17 Mismatch repair 128 0.82 ko03430 5 *
18 N-Glycan biosynthesis 106 0.68 ko00510 5 *(3), **(2) 19 Pentose and glucuronate interconversions 92 0.59 ko00040 5 *(2), **(3) 20 Sesquiterpenoid and triterpenoid biosynthesis 22 0.14 ko00909 5 *(4), **(1) 21 ABC transporters 152 0.97 ko02010 4 *(2), **(1), ***(1)
22 Diterpenoid biosynthesis 30 0.19 ko00904 4 *
23 Ether lipid metabolism 62 0.39 ko00565 4 *
24 Fatty acid biosynthesis 50 0.32 ko00061 4 *(2), **(2)
25 Fatty acid elongation 35 0.22 ko00062 4 *(3), **(1)
26 Galactose metabolism 134 0.85 ko00052 4 *
27 Glycosphingolipid biosynthesis - ganglio series 31 0.20 ko00604 4 *(2), **(2) 28 Photosynthesis - antenna proteins 16 0.10 ko00196 4 *
29 Base excision repair 113 0.72 ko03410 3 *
30 Biosynthesis of unsaturated fatty acids 45 0.29 ko01040 3 *(2), **(1)
31 DNA replication 130 0.83 ko03030 3 *(1), **(2)
32 Fatty acid metabolism 106 0.68 ko00071 3 *
33 Glucosinolate biosynthesis 14 0.09 ko00966 3 *(1), **(2) 34 Glutathione metabolism 109 0.69 ko00480 3 *(2), **(1)
35 Glycerolipid metabolism 126 0.80 ko00561 3 *
DOI:10.4236/ajps.2019.1012161 2316 American Journal of Plant Sciences Continued
38 Isoflavonoid biosynthesis 21 0.13 ko00943 3 *(1), **(2) 39 Oxidative phosphorylation 212 1.35 ko00190 3 **(1), ***(2) 40 Pentose phosphate pathway 93 0.59 ko00030 3 *(2), **(1) 41 Starch and sucrose metabolism 317 2.02 ko00500 3 *(2), **(1) 42 Ubiquinone and other terpenoid-quinone biosynthesis 61 0.39 ko00130 3 * 43 Amino sugar and nucleotide sugar metabolism 241 1.54 ko00520 2 * 44 Benzoxazinoid biosynthesis 16 0.10 ko00402 2 *(1), **(1) 45 Cutin, suberine and wax biosynthesis 29 0.18 ko00073 2 *(1), **(1)
46 Cyanoamino acid metabolism 51 0.32 ko00460 2 *
47 Cysteine and methionine metabolism 97 0.62 ko00270 2 *(1), **(1)
48 Riboflavin metabolism 22 0.14 ko00740 2 *(1), **(1)
49 RNA degradation 423 2.69 ko03018 2 *
50 Sphingolipid metabolism 80 0.51 ko00600 2 *
51 Phenylalanine, tyrosine and tryptophan biosynthesis 69 0.44 ko00400 1 * 52 Ascorbate and aldarate metabolism 75 0.48 ko00053 1 *
53 Indole alkaloid biosynthesis 8 0.05 ko00901 1 *
54 Porphyrin and chlorophyll metabolism 83 0.53 ko00860 1 *
55 Endocytosis 256 1.63 ko04144 1 *
56 Selenocompound metabolism 38 0.24 ko00450 1 *
57 Aminoacyl-tRNA biosynthesis 158 1.01 ko00970 1 *
58 Arachidonic acid metabolism 23 0.15 ko00590 1 *
59 Pantothenate and CoA biosynthesis 55 0.35 ko00770 1 *
60 RNA polymerase 126 0.80 ko03020 1 *
61 Folate biosynthesis 37 0.24 ko00790 1 *
62 Monoterpenoid biosynthesis 10 0.06 ko00902 1 *
63 Other glycan degradation 55 0.35 ko00511 1 *
64 Nucleotide excision repair 200 1.27 ko03420 1 *
65 Photosynthesis 33 0.21 ko00195 1 *
66 Purine metabolism 350 2.23 ko00230 1 *
67 Tropane, piperidine and pyridine alkaloid biosynthesis 27 0.17 ko00960 1 **
68 Glycolysis/Gluconeogenesis 210 1.34 ko00010 1 *
69 Glyoxylate and dicarboxylate metabolism 80 0.51 ko00630 1 * 70 Synthesis and degradation of ketone bodies 23 0.15 ko00072 1 * 71 Valine, leucine and isoleucine degradation 97 0.62 ko00280 1 ** 72 Alanine, aspartate and glutamate metabolism 85 0.54 ko00250 1 *
73 Circadian rhythm - plant 124 0.79 ko04712 1 *
74 Glycosphingolipid biosynthesis - globo series 14 0.09 ko00603 1 **
75 Pyruvate metabolism 150 0.96 ko00620 1 *
DOI:10.4236/ajps.2019.1012161 2317 American Journal of Plant Sciences
Table 2. Significant Pathways number in different pairs and related traits within faba bean seeds RNA-Seq.
Pair comparison Number of Significant pathways Total Sub ***P < 0.001 **0.001 ≤ P ≤ 0.01 *0.01 ≤ P ≤ 0.05
1. AF06125-VS-Farah 2 8 9 19
2. AF06125-VS-Nura 1 9 7 17
3. AF06125-VS-PBARana 2 9 10 21
4. AF06125-VS-PBAWarda 3 5 9 17
5. Farah-VS-Nura 5 7 11 23
6. Farah-VS-PBARana 3 6 11 20
7. Farah-VS-PBAWarda 3 5 13 21
8. Nura-VS-PBARana 3 8 11 22
9. Nura-VS-PBAWarda 2 6 17 25
10. PBARana-VS-PBAWarda 3 5 10 18
11. PBAZahra-VS-AF06125 1 1 4 6
12. PBAZahra-VS-Farah 2 4 6 12
13. PBAZahra-VS-Nura 3 4 7 14
14. PBAZahra-VS-PBARana 3 4 8 15
15. PBAZahra-VS-PBAWarda 4 5 7 16
Total 40 86 140 266
Trait comparison
Lowest Hydration Capacity-VS 1 4 4 9
Highest Hydration Capacity Intermediate Hydration
Capacity-VS- 1 2 3
Highest Hydration Capacity
PSbMV Low seed staining-VS- 1 3 7 11
High seed staining
Note: *means 0.01 ≤ P ≤ 0.05, **means 0.001 ≤ P ≤ 0.01, ***means P < 0.001.
alpha-Linolenic acid metabolism (ko00592), Limonene and pinene degradation (ko00903), Phenylpropanoid biosynthesis (ko00940) and Terpenoid backbone biosynthesis (ko00900). Plant hormone signal transduction (ko04075) and Stil-benoid, diarylheptanoid and gingerol biosynthesis (ko00945) were significant for 8 out of 15 (53.3%) pairs comparison. Flavone and flavonol biosynthesis (ko00944); Phenylalanine metabolism (ko00360) and Plant-pathogen interaction (ko04626) were significant for the comparison of 6 out of 15 (40%) pairs.
compari-DOI:10.4236/ajps.2019.1012161 2318 American Journal of Plant Sciences son. Fourteen pathways were significant for 3 (20%), and eight pathways signifi-cant for 2 (13.3%) of comparisons. There were 25 pathways that were signifisignifi-cant for only a single pair of genotypes.
3.2. Trait Related KEGG Specific Pathways Abundance Discovered within Faba Bean Seed
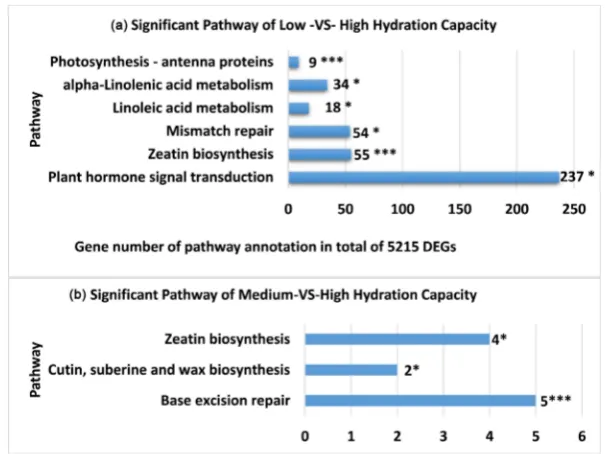
The comparison of genotypes grouped on the basis of particular seed traits was much more specific than the comparison of individual genotype pairs. Regard-ing the seed trait Hydration Capacity the comparison between the Lowest and the Highest groups identified 5 pathways where abundance was highly significant: Zeatin biosynthesis (ko00908), Ribosome biogenesis in eukaryotes (ko03008), RNA degradation (ko03018), Terpenoid backbone biosynthesis (ko00900), and Homologous recombination (ko003440), while three pathways were significant: Biosynthesis of secondary metabolites (ko01110), Porphyrin and chlorophyll metabolism (ko00860), and Stilbenoid, diarylheptanoid and gingerol biosynthe-sis (ko00945) (See Figure 1). For the comparison between Intermediate Hydra-tion Capacity and Highest HydraHydra-tion Capacity, there was only one pathway that was highly significant: Base excision (ko03410), and there were two significant pathways: Cutin, suberine and wax biosynthesis (ko00073) and Zeatin biosyn-thesis (ko00908) (See Figure 2(a) and Figure 2(b)).
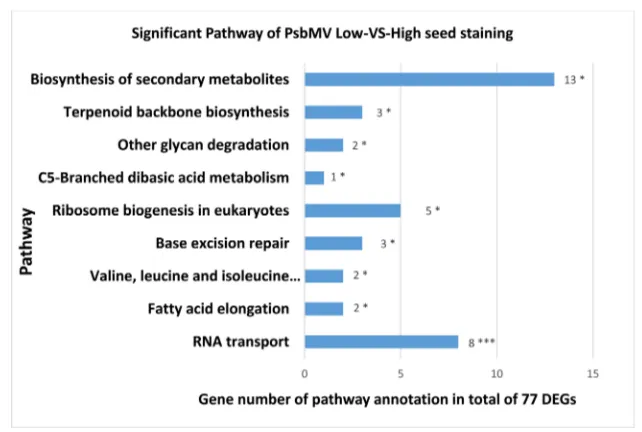
[image:14.595.221.524.454.681.2]Regarding the trait of Pea seed-borne mosaic virus ( PSbMV) and comparison of Low seed staining versus High seed staining genotypes, there were four highly significant pathways: Zeatin biosynthesis (ko00908), Valine, leucine and isoleucine degradation (ko00280), Base excision repair (ko03410) and Phenylpropanoid bio-synthesis (ko00940) and seven significant pathways: Biobio-synthesis of secondary
DOI:10.4236/ajps.2019.1012161 2319 American Journal of Plant Sciences metabolites(ko01110), Ubiquinone and other terpenoid-quinone biosynthe-sis(ko00130), Phenylalanine metabolism (ko00360), Homologous recombination (ko03440), Pentose and glucuronate interconversions (ko00040), Glucosinolate biosynthesis (ko00966) and Benzoxazinoid biosynthesis (ko00402) (See Figure 3).
3.3. PCA Analysis Result
Principal component analysis (PCA) display the distance of the relationship be-tween each sample, including visual effect of clusters groups. The PCA 3D Fig-ure (See Figure 4) shows the genetic distance relationship between these geno-types generated by the DEGs. The closest genetic distance of these samples is between Farah and PBA Zahra and the second closest variety to Farah is AF06125. PBA Zahra and AF06125 are close in the same vertical line. The third closest variety to Farah is Nura, and then PBA Rana, and the most distant variety to Farah is PBA Warda. These results are perfectly matching the breeding selection pedigree information. Farah is PBA Zahra’s paternal parent (50%) and Farah is also in the pedigree of AF06125 (12.5%). This figure also explains the much lower number of significant common pathways between PBA Zahra and AF06125; about one third of average pathways number compare to all other pairs comparison in Table 2.
3.4. Validation Outcome
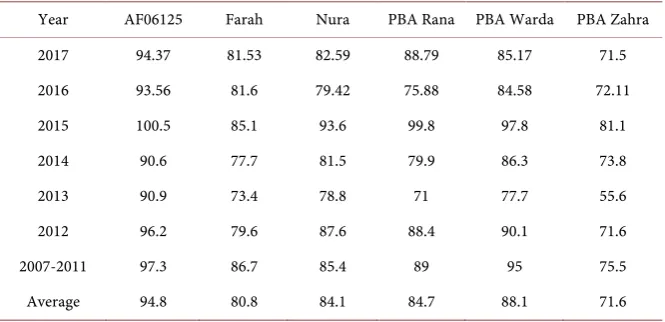
[image:15.595.212.533.469.685.2]Hydration Capacity The hydration capacity of AF06125 was highest with an average of 95.4% and PBA Zahra was lowest with 74.3%. The data were for sam-ples harvested from two sites growing in South Australia from 2007 to 2017. The other four samples were intermediate. (See Table 3) These results supported the pathway abundance of Hydration Capacity index samples information.
Figure 3. Significant pathways in faba bean seeds for the comparison of varieties with Low versus High seed staining due to infection of plants by PSbMV. Note: *means 0.01 ≤
DOI:10.4236/ajps.2019.1012161 2320 American Journal of Plant Sciences
Figure 4. Three dimensional Principal Component (PCA) Analysis graph showing the relationship of genetic distance for six Australian faba bean varieties based on DEGs.
Table 3. Faba bean seeds Hydration Capacity from 2007 to 2017.
Year AF06125 Farah Nura PBA Rana PBA Warda PBA Zahra
2017 94.37 81.53 82.59 88.79 85.17 71.5 2016 93.56 81.6 79.42 75.88 84.58 72.11 2015 100.5 85.1 93.6 99.8 97.8 81.1
2014 90.6 77.7 81.5 79.9 86.3 73.8
2013 90.9 73.4 78.8 71 77.7 55.6
2012 96.2 79.6 87.6 88.4 90.1 71.6 2007-2011 97.3 86.7 85.4 89 95 75.5 Average 94.8 80.8 84.1 84.7 88.1 71.6
Data source: The data were tested samples which harvested from two sites: Freeling and Charlick in South Australia from 2007 to 2017.
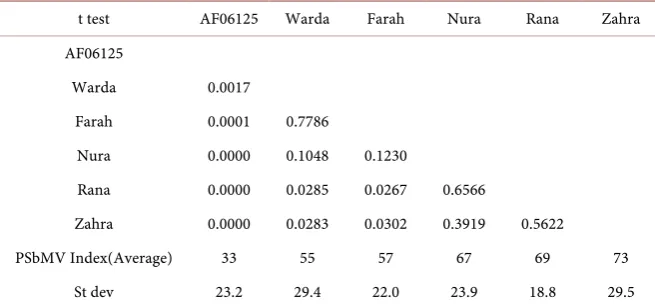
PSbMV Index The PSbMV Index of AF06125 was lowest on 33% and PBA Zahra was highest on 73%, where the others were intermediate (See Table 4). The ELISA test and RT-PCR test were both positive for PSbMV virus indicating that all varieties are susceptible to PSbMV (See Table 5). These results confirmed the information of pathway abundance of PSbMV index samples information.
[image:16.595.207.540.423.584.2]DOI:10.4236/ajps.2019.1012161 2321 American Journal of Plant Sciences
Table 4. Faba bean seeds PSbMV Index and its t test result.
t test AF06125 Warda Farah Nura Rana Zahra AF06125
Warda 0.0017
Farah 0.0001 0.7786
Nura 0.0000 0.1048 0.1230
Rana 0.0000 0.0285 0.0267 0.6566
Zahra 0.0000 0.0283 0.0302 0.3919 0.5622 PSbMV Index(Average) 33 55 57 67 69 73
St dev 23.2 29.4 22.0 23.9 18.8 29.5
Table 5. Result of testing virus inoculated and healthy controls of faba bean plants for PSbMV by PCR and ELISA.
Sample ID PSbMV Status PCR VT02/ 03 primers PSbMVQWF/ R primers ELISA result
Nura-1 inoculated pos pos pos
Nura-2 inoculated pos pos pos
Nura-3 inoculated pos pos pos
Nura-4 inoculated pos pos pos
Nura-5 inoculated pos pos pos
Nura-8, 9, 10, 11, 12 pooled healthy control neg neg neg
Farah-1 inoculated pos pos pos
Farah-2 inoculated neg weak pos neg
Farah-3 inoculated pos pos pos
Farah-4 inoculated pos pos pos
Farah-5 inoculated pos pos pos
Farah-8, 9, 10, 11, 12 pooled healthy control neg neg neg
PBAZahra-1 inoculated pos pos pos
PBAZahra-2 inoculated pos pos pos
PBAZahra-3 inoculated pos pos pos
PBAZahra-4 inoculated pos pos pos
PBAZahra-5 inoculated pos pos pos
PBAZahra-8, 9, 10, 11, 12 pooled healthy control neg neg neg
PBARana-1 inoculated pos pos pos
PBARana-2 inoculated pos pos pos
PBARana-3 inoculated pos pos pos
PBARana-4 inoculated pos pos pos
PBARana-5 inoculated pos pos pos
[image:17.595.209.539.285.739.2]DOI:10.4236/ajps.2019.1012161 2322 American Journal of Plant Sciences Continued
PBAWarda-1 inoculated pos pos pos
PBAWarda-2 inoculated pos pos pos
PBAWarda-3 inoculated pos pos pos
PBAWarda-4 inoculated pos pos pos
PBAWarda-5 inoculated pos pos pos
PBAWarda-8, 9, 10, 11, 12 pooled healthy control neg neg neg
AF06125-1 inoculated pos pos pos
AF06125-2 inoculated pos pos pos
AF06125-3 inoculated pos pos pos
AF06125-4 inoculated pos pos pos
AF06125-5 inoculated neg weak pos neg
AF06125-8, 9, 10, 11, 12 pooled healthy control neg neg neg
PSbMV-VT03F GTG TTG GAG GAA TCA CAC CAG AAG AAT GTG
PSbMV-VT02R GCA GTT GCT ACA TCC ATC ATT GTT GGC CAT)
Amplicon size 1100 bp
PSbMVQW-F GTGTTGGAGGAATCACACGA
PSbMVQW-R GGTGTTGTTTCCCATGTCTGT
Amplicon size 272 bp
bean seeds. Hence the pathways information reported here is the first deep pathway analysis of faba bean seeds RNA-Seq. It can be a source of knowledge for future studies on faba bean seeds. These results reveal the genetic distance within these varieties and genomic information for faba bean seeds, and fill the knowledge gaps of faba bean seed pathways.
The KEGG pathways information will help understanding the faba bean seed genes functional activities. The genetic distance of these varieties are confirmed both by DEGs generated from RNA-Seq and breeding pedigree information. There are pathway analysis studies on other plants and crops such as rice, maize, and chickpeas.
Due to the limited number of faba bean genotypes using for sequencing in this report, it may not fully identify all the pathways information in the faba bean seeds. Hence, investigating more genotypes in future sequencing for analysis would be recommended.
DOI:10.4236/ajps.2019.1012161 2323 American Journal of Plant Sciences
4. Conclusion
In summary, there are a total of 75 significant or highly significant KEGG path-ways discovered within these faba beans seeds RNA-Seq. There are a total of 9 significant pathways (over 53.3% pairs) that are conserved in abundance within all the seeds, 41 significant pathways found within 2 to 6 pair comparisons and 25 significant pathways were unique to single pair comparisons. There were 8 specific significant pathways associated with the faba bean seed Hydration Ca-pacity trait and 9 different specific significant pathways associated with the PSbMV seeds staining trait. The seeds hydration level has been validated by 10 years of standard hydration capacity testing. The seeds staining level of these samples has been validated by the field observation in South Australia and a growth room inoculation test in Adelaide. ELISA and RT-PCR experiment con-firmed that inoculated plants were positive for PSbMV. The genetic distance between these varieties in the PCA 3D graph confirmed breeding pedigree selec-tion informaselec-tion.
Ethics Approval and Consent to Participate
Not applicable.
Consent for Publication
Not applicable.
Availability of Data and Materials
BioProject ID PRJNA319071 and RNA-Seq (Quantification) data are deposited at National Centre for Biotechnology Information (NCBI) gene bank. Reference number is SRA accession: SRP074308. The faba bean Assembly data deposited in Figshare: The data DOI is: Digital Object Identifier 10.6084/m9.figshare.4910039.
Authors’ Contributions
S.Y. Yang designed the experiment and wrote the manuscript, Y. Wang and J. Li carried for all sequences data analysis. N. Habili and Q. Wu done the PSbMV RT-PCR validation test. J.G. Paull commented and revised the manuscript.
Acknowledgements
We would like to thanks Dr. Joop Van Leurand Ms. Jule George, NSW Depart-ment of Primary Industries for the PSbMV validation of ELISA test. We also would like to thank Dr. Bujun Shi for suggestion on the validation test and comments on the draft. We would like to thanks Angela Mills, Librarian of University of Adelaide, who helps to fix the reference correctly.
Funding
DOI:10.4236/ajps.2019.1012161 2324 American Journal of Plant Sciences Development Corporation (GRDC) for the study.
Conflicts of Interest
The authors declare no conflicts of interest regarding the publication of this paper.
References
[1] Zohary, D. and Hopf, M. (1973) Domestication of Pulses in the Old World: Leg-umes Were Companions of Wheat and Barley When Agriculture Began in the Near East. Science, 182, 887-894.https://doi.org/10.1126/science.182.4115.887
[2] FAOSTAT. http://faostat.fao.org
[3] Johnston, J.S., Bennett, M.D., Rayburn, A.L., Galbraith, D.W. and Price, H.J. (1999) Reference Standards for Determination of DNA Content of Plant Nuclei. American Journal of Botany, 86, 609-613.https://doi.org/10.2307/2656569
[4] Xu, H., Gao, Y. and Wang, J. (2012) Transcriptomic Analysis of Rice (Oryza sativa) Developing Embryos Using the RNA-Seq Technique. PLoS ONE, 7, e30646.
https://doi.org/10.1371/journal.pone.0030646
[5] Davidson, R.M., Hansey, C.N., Gowda, M., Childs, K.L., Lin, H., Vaillancourt, B., Sekhon, R.S., de Leon, N., Kaeppler, S.M., Jiang, N. and Buell, C.R. (2011) Utility of RNA Sequencing for Analysis of Maize Reproductive Transcriptomes. The Plant Genome, 4, 191-203.https://doi.org/10.3835/plantgenome2011.05.0015
[6] Kakumanu, A., Ambavaram, M.M.R., Klumas, C., Krishnan, A., Batlang, U., Myers, E., Grene, R. and Pereira, A. (2012) Effects of Drought on Gene Expression in Maize Reproductive and Leaf Meristem Tissue Revealed by RNA-Seq. Plant Physiology, 160, 846-867.https://doi.org/10.1104/pp.112.200444
[7] Garg, R., Patel, R.K., Tyagi, A.K. and Jain, M. (2011) De Novo Assembly of Chick-pea Transcriptome Using Short Reads for Gene Discovery and Marker Identifica-tion. DNA Research, 18, 53-63.https://doi.org/10.1093/dnares/dsq028
[8] Hiremath, P.J., Farmer, A., Cannon, S.B., Woodward, J., Kudapa, H., Tuteja, R., Kumar, A., BhanuPrakash, A., Mulaosmanovic, B., Gujaria, N., Krishnamurthy, L., Gaur, P.M., KaviKishor, P.B., Shah, T., Srinivasan, R., Lohse, M., Xiao, Y., Town, C.D., Cook, D.R., May, G.D. and Varshney, R.K. (2011) Large-Scale Transcriptome Analysis in Chickpea (Cicer arietinum L.), an Orphan Legume Crop of the Semi-Arid Tropics of Asia and Africa. Plant Biotechnology Journal, 9, 922-931.
https://doi.org/10.1111/j.1467-7652.2011.00625.x
[9] Sudheesh, S., Sawbridge, T.I., Cogan, N.O., Kennedy, P., Forster, J.W. and Kaur, S. (2015) De Novo Assembly and Characterisation of the Field Pea Transcriptome Using RNA-Seq. BMC Genomics, 16, 611.
https://doi.org/10.1186/s12864-015-1815-7
[10] Kaur, S., Pembleton, L.W., Cogan, N.O., Savin, K.W., Leonforte, T., Paull, J., Ma-terne, M. and Forster, J.W. (2012) Transcriptome Sequencing of Field Pea and Faba Bean for Discovery and Validation of SSR Genetic Markers. BMC Genomics, 13,
104.https://doi.org/10.1186/1471-2164-13-104
[11] Wu, G., Zhang, L., Yin, Y., Wu, J., Yu, L., Zhou, Y. and Li, M. (2015) Sequencing, De Novo Assembly and Comparative Analysis of Raphanus sativus Transcriptome.
Frontiers in Plant Science, 6, 198.https://doi.org/10.3389/fpls.2015.00198
[12] Arun Chinnappa, K.S. and McCurdy, D.W. (2015) De Novo Assembly of a Cotyle-don-Enriched Transcriptome Map of Vicia faba (L.) for Transfer Cell Research.
DOI:10.4236/ajps.2019.1012161 2325 American Journal of Plant Sciences [13] Khan, M.A., Alghamdi, S.S., Ammar, M.H., Sun, Q., Teng, F., Migdadi, H.M. and
Al-Faifi, S.A. (2019) Transcriptome Profiling of Faba Bean (Vicia faba L.) Drought-Tolerant Variety Hassawi-2 under Drought Stress Using RNA Sequencing.
Electronic Journal of Biotechnology, 39, 15-29.
https://doi.org/10.1016/j.ejbt.2019.02.004
[14] Cooper, J.W., Wilson, M.H., Derks, M.F.L., Smit, S., Kunert, K.L., Cullis, C. and Foyer, C.H. (2017) Enhancing Faba Bean (Vicia faba L.) Genome Resources. Journal of Experimental Botany, 68, 1941-1953.https://doi.org/10.1093/jxb/erx117
[15] O’Sullivan, D.M. and Angra, D. (2016) Advances in Faba Bean Genetics and Ge-nomics. Frontiers in Genetics, 7, 150.https://doi.org/10.3389/fgene.2016.00150 [16] Yang, S.Y., Wilkinson, M.J., Wang, Y., Li, J. and Paull, J.G. (2017) Gene Function
Expression Profile of Faba Bean (Vicia faba) Seeds. Journal of Applied Microbiology and Biochemistry, 1, 3-11.
[17] Pazhamala, L.T., Purohit, S., Saxena, R.K., Garg, V., Krishnamurthy, L., Verdier, J., and Varshney, R.K. (2017) Gene Expression Atlas of Pigeonpea and Its Application to Gain Insights into Genes Associated with Pollen Fertility Implicated in Seed Formation. Journal of Experimental Botany, 68, 2037-2054.
https://doi.org/10.1093/jxb/erx010
[18] Chien, C.H., Chow, C.N., Wu, N.Y., Chiang-Hsieh, Y.F., Hou, P.F. and Chang, W.C. (2015) EXPath: A Database of Comparative Expression Analysis Inferring Metabolic Pathways for Plants. BMC Genomics, 16, S6.
https://doi.org/10.1186/1471-2164-16-S2-S6
[19] Lai, L.M., Liberzon, A., Hennessey, J., Jiang, G.X., Qi, J.L., Mesirov, J.P. and Ge, S.X. (2012) AraPath: A Knowledgebase for Pathway Analysis in Arabidopsis. Bioinfor-matics, 28, 2291-2292.https://doi.org/10.1093/bioinformatics/bts421
[20] Masclaux, F.G., Bruessow, F., Schweizer, F., Gouhier-Darimont, C., Keller, L. and Reymond, P. (2012) Transcriptome Analysis of Intraspecific Competition in
Arabidopsis thaliana Reveals Organ-Specific Signatures Related to Nutrient Acqui-sition and General Stress Response Pathways. BMC Plant Biology, 12, 227.
https://doi.org/10.1186/1471-2229-12-227
[21] Ma, S.S., Shah, S., Bohnert, H.J., Snyder, M. and Dinesh-Kumar, S.P. (2013) Incor-porating Motif Analysis into Gene Co-Expression Networks Reveals Novel Modular Expression Pattern and New Signaling Pathways. PLoS Genetics, 9, e1003840.
https://doi.org/10.1371/journal.pgen.1003840
[22] Kohan-Baghkheirati, E. and Geisler-Lee, J. (2015) Gene Expression, Protein Function and Pathways of Arabidopsis thaliana Responding to Silver Nanoparticles in Com-parison to Silver Ions, Cold, Salt, Drought, and Heat. Nanomaterials, 5, 436-467.
https://doi.org/10.3390/nano5020436
[23] Lang, C. and Xi, J. (2016) Bioinformatics Identification of the Methylerythritol Phosphate Pathway Associated Genes in Arabidopsis thaliana with ceh1 Mutant.
Russian Journal of Plant Physiology, 63, 293-299.
https://doi.org/10.1134/S1021443716020096
[24] Oono, Y., Yazawa, T., Kawahara, Y., Kanamori, H., Kobayashi, F., Sasaki, H., Mori, S., Wu, J.Z., Handa, H., Itoh, T. and Matsumoto, T. (2014) Genome-Wide Tran-scriptome Analysis Reveals That Cadmium Stress Signaling Controls the Expression of Genes in Drought Stress Signal Pathways in Rice. PLoS ONE, 9, e96946.
https://doi.org/10.1371/journal.pone.0096946
DOI:10.4236/ajps.2019.1012161 2326 American Journal of Plant Sciences Abiotic Stresses as Determined through Proteomic and Metabolomic Analyses.
PLoS ONE, 12, e0173069.https://doi.org/10.1371/journal.pone.0173069
[26] Chen, T.T., Zhang, L., Shang, H.H., Liu, S.D., Peng, J., Gong, W.K., Shi, Y.Z., Zhang, S.P., Li, J.W., Gong, J.W., Ge, Q., Liu, A.Y., Ma, H.J., Zhao, X.H. and Yuan, Y.L. (2016) iTRAQ-Based Quantitative Proteomic Analysis of Cotton Roots and Leaves Reveals Pathways Associated with Salt Stress. PLoS ONE, 11, e0148487.
https://doi.org/10.1371/journal.pone.0148487
[27] Cheng, Y.Q., Zhao, Y.X., Liu, J.F., Yang, B.W. and Ming, Y.T. (2017) Comparison of Phytohormone Biosynthesis and Signal Transduction Pathways in Developing and Abortive Hazelnut Ovules. Plant Growth Regulation, 81, 147-157.
https://doi.org/10.1007/s10725-016-0196-5
[28] Wang, R., Xu, S., Wang, N., Xia, B., Jiang, Y.M. and Wang, R. (2017) Transcriptome Analysis of Secondary Metabolism Pathway, Transcription Factors, and Transport-ers in Response to Methyl Jasmonate in Lycoris aurea. Frontiers in Plant Science, 7, 1971.https://doi.org/10.3389/fpls.2016.01971
[29] Kaur, S., Cogan, N., Forster, J. and Paull, J. (2014) Assessment of Genetic Diversity in Faba Bean Based on Single Nucleotide Polymorphism. Diversity, 6, 88-101.
https://doi.org/10.3390/d6010088
[30] Mortazavi, A., Williams, B.A., McCue, K., Schaeffer, L. and Wold, B. (2008) Mapping and Quantifying Mammalian Transcriptomes by RNA-Seq. Nature Methods, 5, 621-628.https://doi.org/10.1038/nmeth.1226
[31] Wang, Z., Gerstein, M. and Snyder, M. (2009) RNA-Seq: A Revolutionary Tool for Transcriptomics. Nature Reviews Genetics, 10, 57-63.
https://doi.org/10.1038/nrg2484
[32] Ozsolak, F. and Milos, P.M. (2010) RNA Sequencing: Advances, Challenges and Opportunities. Nature Reviews Genetics, 12, 87.https://doi.org/10.1038/nrg2934 [33] Patro, R., Mount, S.M. and Kingsford, C. (2014) Sailfish Enables Alignment-Free
Isoform Quantification from RNA-seq Reads Using Lightweight Algorithms. Na-ture Biotechnology, 32, 462-464.https://doi.org/10.1038/nbt.2862
[34] de Hoon, M.J., Imoto, S., Nolan, J. and Miyano, S. (2004) Open Source Clustering Software. Bioinformatics, 20, 1453-1454.
https://doi.org/10.1093/bioinformatics/bth078
[35] Eisen, M.B., Spellman, P.T., Brown, P.O. and Botstein, D. (1998) Cluster Analysis and Display of Genome-Wide Expression Patterns. Proceedings of the National Academy of Sciences of the United States of America, 95, 14863-14868.
https://doi.org/10.1073/pnas.95.25.14863
[36] Saldanha, A.J. (2004) Java Treeview—Extensible Visualization of Microarray Data.
Bioinformatics, 20, 3246-3248.https://doi.org/10.1093/bioinformatics/bth349 [37] Audic, S. and Claverie, J.-M. (1997) The Significance of Digital Gene
Expres-sion Profiles. Genome Research, 7, 986-995.https://doi.org/10.1101/gr.7.10.986 [38] Abdi, H. (2007) The Bonferonni and Šidák Corrections for Multiple Comparisons.
In: Salkind, N.J., Ed., Encyclopedia of Measurement and Statistics, 3rd Edition, Sage, Thousand Oaks, 103-107.
[39] Benjamini, Y. and Yekutieli, D. (2001) The Control of the False Discovery Rate in Multiple Testing under Dependency. Annals of Statistics, 29, 1165-1188.
https://doi.org/10.1214/aos/1013699998
DOI:10.4236/ajps.2019.1012161 2327 American Journal of Plant Sciences
Journal of Biotechnology, 9, 90-98.
[41] Tarazona, S., Garcia-Alcalde, F., Dopazo, J., Ferrer, A. and Conesa, A. (2011) Diffe-rential Expression in RNA-seq: A Matter of Depth. Genome Research, 21, 2213-2223.
https://doi.org/10.1101/gr.124321.111
List of Abbreviations
RNA-Seq: RNA sequencing
PSbMV: Pea seed-borne mosaic virus DEGs: Differentially Expressed Genes
DOI:10.4236/ajps.2019.1012161 2328 American Journal of Plant Sciences
Supplementary Files
Figure S1. AF06125-VS-Farah.path.enrichment.
[image:24.595.234.517.409.705.2]DOI:10.4236/ajps.2019.1012161 2329 American Journal of Plant Sciences
Figure S3. AF06125-VS-PBARana.path.enrichment.
[image:25.595.225.525.401.707.2]DOI:10.4236/ajps.2019.1012161 2330 American Journal of Plant Sciences
Figure S5. Farah-VS-PBARana.path.enrichment.
[image:26.595.230.523.403.705.2]DOI:10.4236/ajps.2019.1012161 2331 American Journal of Plant Sciences
Figure S7. Nura-VS-PBARana.path.enrichment.
[image:27.595.231.524.401.710.2]DOI:10.4236/ajps.2019.1012161 2332 American Journal of Plant Sciences
Figure S9. PBARana-VS-PBAWarda.path.enrichment.
[image:28.595.226.524.404.706.2]DOI:10.4236/ajps.2019.1012161 2333 American Journal of Plant Sciences
Figure S11. PBAZahra-VS-Farah.path.enrichment.
[image:29.595.229.522.402.707.2]DOI:10.4236/ajps.2019.1012161 2334 American Journal of Plant Sciences
Figure S13. PBAZahra-VS-PBARana.path.enrichment.
[image:30.595.227.524.401.705.2]