ISSN Online: 1949-5005 ISSN Print: 1949-4998
DOI: 10.4236/health.2019.1112120 Dec. 23, 2019 1591 Health
Relationship between the Current Account
Balance Ratio and Salary Ratio in Japanese
Municipal Hospitals
Nozomu Mandai
1*, Mayumi Watanabe
1,2,31Ibaraki Prefectural University of Health Sciences, Ibaraki, Japan 2Kansai University of Health Sciences, Osaka, Japan
3Faculty of Science and Engineering, Chuo University, Tokyo, Japan
Abstract
Background: While public municipal hospitals in Japan are supported by public financing and are less likely to fail than private hospitals, more than half are in financial deficit. Hospitals running at a deficit may have poorer outcomes and less investment in maintenance of human or physical capital, as well as increased rates of patient adverse events. We sought to clarify the relationship between municipal hospital surpluses or deficits and salary ex-penditures. Methods: We extracted financial data for 253 general hospitals of 300 beds or more from financial statements for the 2013 fiscal year available in the Yearbook of Public Firms, Edition for Hospital. From these data, we calculated account balance ratios and compared the average value of the ratio of labor to the output (salary ratio) for each group using analysis of variance (ANOVA). Results: The salary ratios of hospitals in the surplus group were significantly lower than the salary ratios of hospitals in the deficit group (55.5% vs. 49.4%; p < 0.001). In the deficit group, there was no difference be-tween the average values of salary ratios among the three-bed count groups (mean salary ratio: 57.2% vs. 54.4% vs. 53.0%; ANOVA p = 0.342). In the sur-plus group, the average value of salary ratios was different among the three- bed count groups (mean salary ratio: 53.0% vs. 48.5% vs. 47.4%; ANOVA p = 0.012). In addition, there was a significant difference in mean value between the 300-bed group and ≥500 beds group (mean salary ratio: 53.0% vs. 47.4%; p = 0.002). Conclusion: This study suggests that maintaining a favorable salary ratio to the current account balance is a useful proxy of fiscal health, and interventions to improve the salary ratio may be effective in improving municipal hospital management. Furthermore, among well-managed mu-nicipal hospitals, larger hospital size may confer some advantage in purchas-ing power.
How to cite this paper: Mandai, N. and Watanabe, M. (2019) Relationship between the Current Account Balance Ratio and Salary Ratio in Japanese Municipal Hospitals. Health, 11, 1591-1597.
https://doi.org/10.4236/health.2019.1112120
Received: November 27, 2019 Accepted: December 20, 2019 Published: December 23, 2019
Copyright © 2019 by author(s) and Scientific Research Publishing Inc. This work is licensed under the Creative Commons Attribution International License (CC BY 4.0).
http://creativecommons.org/licenses/by/4.0/
DOI: 10.4236/health.2019.1112120 1592 Health
Keywords
Hospital Finance, Salary Ratio, Public Hospital, Current Account Balance Ratio
1. Introduction
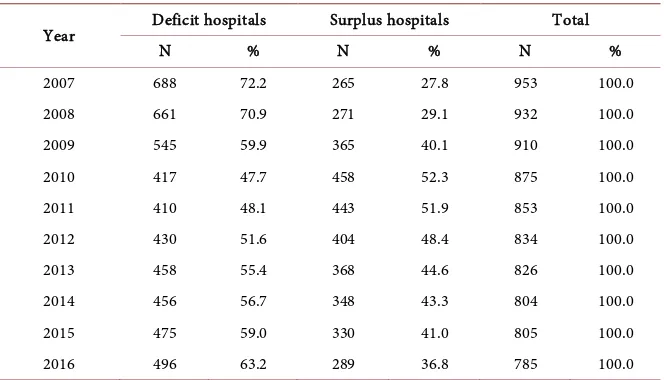
Japan’s health system implemented universal health insurance coverage in 1961 and is one of the most successful health systems in the world, despite having one of the highest life expectancies and the highest old-age dependency ratio among advanced economies [1]. Hospitals in Japan are categorized as public municipal hospitals, which are established under the Japanese Ministry of Health, Labour and Welfare, and private hospitals, which are administered by corporations and constitute the majority of hospitals in Japan [2]. While public municipal hospit-als are supported by public financing and are less likely to fail than private pitals, more than half are in financial deficit. As of 2013, public municipal hos-pitals accounted for about 10% of all hoshos-pitals in Japan, and most of these mu-nicipal hospitals were operating at a loss, with a net loss of 42.92 billion yen (ap-proximately 429 million U.S. dollars) [3]. In response to the high proportion of municipal hospitals in deficit (72.2% in 2007), the Japanese Ministry of Internal Affairs and Communications issued public hospital reform guidelines to local municipalities in 2007 requesting that they improve public hospital management as quickly as possible [4]. These guidelines were updated in 2015 and require lo-cal governments to develop plans to limit spending and increase revenue at pub-lic hospitals; in addition, the guidelines require annual assessment and reporting [3]. The guidelines primarily target hospital administration, with a main objective of reducing deficit and reducing subsidies received from local government [5]. While early targets of the guidelines were not met [5], rates of municipal hospit-al deficit following issuance of this directive eventuhospit-ally dropped to 54.4% in 2013 and 63.2% in 2016 (Table 1) [6].
DOI: 10.4236/health.2019.1112120 1593 Health
Table 1. Number and percent of deficit hospitals and surplus hospitals between 2007 and
2016.
Year Deficit hospitals Surplus hospitals Total
N % N % N %
2007 688 72.2 265 27.8 953 100.0 2008 661 70.9 271 29.1 932 100.0 2009 545 59.9 365 40.1 910 100.0 2010 417 47.7 458 52.3 875 100.0 2011 410 48.1 443 51.9 853 100.0 2012 430 51.6 404 48.4 834 100.0 2013 458 55.4 368 44.6 826 100.0 2014 456 56.7 348 43.3 804 100.0 2015 475 59.0 330 41.0 805 100.0 2016 496 63.2 289 36.8 785 100.0
To clarify the relationship between municipal hospital surpluses or deficits and salary expenditures, which are a measure of investment in human capital, we analyzed 2013 financial data of 253 municipal hospitals with 300 beds or more from annual financial reports.
2. Methods
We analyzed the relationship between the current account balance ratio and sal-ary ratio in Japanese municipal hospitals using data from the 2007-2016 Annual Statistics of Public Enterprises [(Chihou Kouei-Kigyou Nenkan Byouinhen (in Japanese)] [13]. The dataset includes financial and operational data for 839 mu-nicipal hospitals in Japan in the 2013 fiscal year. There are three categories of municipal hospital in Japan: general hospitals, tuberculosis hospitals, and psy-chiatric hospitals; we targeted general municipal hospitals with 300 or more beds. After excluding hospitals that were under construction (n = 13), those with missing data on current account balance and salary ratio (n = 39), tuberculosis hospitals and psychiatric hospitals (n = 31), and hospitals with less than 300 beds (n = 503), we extracted financial data for 253 general hospitals of 300 beds or more from financial statements for the 2013 fiscal year [13].
From these municipal hospital account balance and salary data, we calculated account balance ratios, including the ratio of current expenses to current income (the current account balance ratio, in percent; [ordinary income/ordinary ex-penses] × 100) and the ratio of labor to output (the salary ratio, in percent; [per-sonnel expenses/medical practice income] × 100). We then divided hospitals in-to a deficit group, in which the ratio of current expense in-to current income was 100% or more, and a surplus group, in which the ratio of current expense to current income was less than 100%.
homo-DOI: 10.4236/health.2019.1112120 1594 Health geneity of the variances was assessed using the Levene statistic. We also con-ducted stratified sensitivity analyses by bed count (300 - 399 beds vs. 400 - 499 beds vs. ≥500 beds) using Tukey’s Honest Significant Difference test. All statis-tical analyses were performed using the Statisstatis-tical Package for the Social Sciences (SPSS) version 25.0 (SPSS, Inc., Chicago, IL, USA). Statistical significance was set at p < 0.05.
3. Results
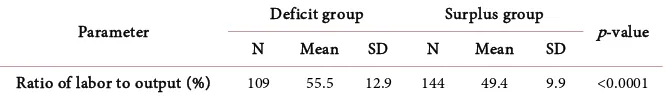
A diagram of the study flow is shown in Figure 1. Analyses were based on data from 253 municipal hospitals. Comparison of mean salary ratio values between the deficit group and the surplus group are presented in Table 2. The salary tios of hospitals in the surplus group were significantly lower than the salary ra-tios of hospitals in the deficit group (55.5% vs. 49.4%; p < 0.001).
Comparison of mean salary ratio values between the deficit group and the surplus group stratified by bed count are shown in Table 3. In the deficit group, there was no difference between the average values of salary ratios among the three-bed count groups (mean salary ratio: 57.2% vs. 54.4% vs. 53.0%; ANOVA p = 0.342). In the surplus group, the average value of salary ratios was different among the three-bed count groups (mean salary ratio: 53.0% vs. 48.5% vs. 47.4%; ANOVA p = 0.012). In addition, there was a significant difference in mean value between the 300-bed group and ≥500 beds group (mean salary ratio: 53.0% vs. 47.4%; p = 0.002).
4. Discussion
Among Japan’s municipal hospitals, those with lower salary ratios tended to have favorable account balances. In addition, in the surplus group, we found that salary ratios were lower in hospitals with ≥500 beds. However, no such differ-ence was observed among hospitals running at a deficit.
[image:4.595.203.539.600.707.2]Other researchers evaluating the possible link between hospital size and fiscal health due to the economy of scale in purchasing did not find a significant im-pact on bargaining power [3]. This may have been due to the real or perceived lack of incentives to use group purchasing power (i.e., administrators are either unaware of the potential cost savings or do not believe that such savings would materialize) or to the expectation of using the newest available (and thus, more
DOI: 10.4236/health.2019.1112120 1595 Health
Table 2. Comparison of mean salary ratio values between deficit group and surplus group.
Parameter Deficit group Surplus group p-value N Mean SD N Mean SD
[image:5.595.207.540.91.141.2]Ratio of labor to output (%) 109 55.5 12.9 144 49.4 9.9 <0.0001
Table 3. Comparison of mean salary ratio values in bed count group by financial
situa-tion ratio of labor to output (%). (a) Bed count group; (b) Specific group difference.
(a)
300 L 400 L 500+ L ANOVA
p-value N Mean SD N Mean SD N Mean SD
Deficit group 55 57.2 14.2 30 54.4 14.4 24 53.0 5.4 0.342 Surplus group 43 53.0 8.3 36 48.5 13.1 65 47.4 8.0 0.012
(b)
300 L vs. 400 L 400 L vs. 500+ 300 L vs. 500+ ANOVA p-value
Deficit group - - - 0.342
Surplus group - - 300 L 0.012
Note: 300 L [300 beds level (300 - 399)], 400 L [400 beds level (400 - 499)], 500+ L [500 and more than 500 beds level (≥500)].
costly) drugs in highly advanced medical care. A study of American hospitals found that larger hospitals had greater efficiency, but that smaller hospitals had comparable costs to larger institutions [14].
While scale did not confer a significant economic benefit in purchasing pow-er, the managerial requirements of the hospital reform guidelines were associated with increased bargaining power. Purchasing power may be less modifiable in Japan’s national single-payer health system than in more free-market-based sys-tems, [8] but cost efficiency in public municipal hospitals is also closely linked to managerial performance, so improving hospital management is a potential ave-nue to reducing public hospital deficit [15]. While some other cost containment strategies, such as the prospective payment system, have resulted in only limited improvements in efficiency [16], our finding that salary ratios were lower among hospitals running at a surplus offers support for the benefits of management re-sponsibility, which includes control of salaries and revenue.
Additionally, contrary to previous findings [3], our results also suggest that, at least among solvent hospitals with adequate management, larger size may offer additional benefits in negotiating salaries and in purchasing power. Hospitals in good financial standing may have alternatives for cost savings and quality im-provements that are not available to hospitals that lack such financial flexibility [10]. Additional research into the association between hospital size and pur-chasing power by overall fiscal health is warranted.
DOI: 10.4236/health.2019.1112120 1596 Health previous studies have assessed the relationship between hospital size and bar-gaining power, to our knowledge, this is the first study to evaluate municipal hos-pital expenses and revenue by hoshos-pital size.
However, some limitations also warrant mention. First, we included only gener-al municipgener-al hospitgener-als, excluding private hospitgener-als as well as public psychiatric hospitals and tuberculosis hospitals. Private hospitals comprise the majority of hospitals in Japan, but data for these hospitals is not collected and reported in the Annual Statistics of Public Enterprises [13]. Specialty municipal hospitals serve different populations and have specific financial concerns that preclude aggrega-tion with municipal hospital data. Second, data for our analysis was collected 6 years ago, in 2013; an analysis of more recent data is forthcoming. Third, we also excluded small hospitals with less than 300 beds, which constituted the majority of municipal hospitals in the dataset (503/839 general hospitals). While this de-cision allowed us to compare data of the highest-volume hospitals, generalizabil-ity of our findings to smaller hospitals is limited. Further research on the fiscal health of these smaller hospitals may provide additional useful information for the management of public hospitals in Japan.
5. Conclusion
This study suggests that maintaining a favorable salary ratio to the current ac-count balance is a useful proxy of fiscal health, and interventions to improve the salary ratio may be effective in improving municipal hospital management. Fur-thermore, our results suggest that, among well-managed municipal hospitals, larg-er hospital size may conflarg-er some advantage in purchasing powlarg-er.
Acknowledgements
This article was supported in part by a JSPS KAKEN Grant-in-Aid for Early-Career Scientists (N.M. 19K19359).
Conflicts of Interest
The authors declare no conflicts of interest regarding the publication of this pa-per.
References
[1] Nozaki, M., Kashiwase, K. and Saito, I. (2014) Health Spending in Japan: Macro- Fiscal Implications and Reform Options. International Monetary Fund, Washington
DC.https://doi.org/10.5089/9781498365277.001
[2] Japan Ministry of Health, Labour and Welfare (2013) Annual Health, Labour and Welfare Report, 2012-2013. Tokyo.
https://www.mhlw.go.jp/engish/wp/wp-hw7/index.html
[3] Noto, K., Kojo, T. and Innami, I. (2017) Does Scale of Public Hospitals Affect Bar-gaining Power? Evidence from Japan. International Journal of Health Policy and Management, 6, 695-700.https://doi.org/10.15171/ijhpm.2017.29
DOI: 10.4236/health.2019.1112120 1597 Health
Study of the Approach to Public Hospital Reform in the Oguni-Town, Yamagata Prefecture. Journal of Rural Planning Association, 32, 72-81.
https://doi.org/10.2750/arp.32.72
[5] Kawaguchi, H., Tone, K. and Tsutsui, M. (2014) Estimation of the Efficiency of Japa-nese Hospitals Using a Dynamic and Network Data Envelopment Analysis Model.
Health Care Management Science, 17, 101-112. https://doi.org/10.1007/s10729-013-9248-9
[6] Zhang, X. and Oyama, T. (2016) Investigating the Health Care Delivery System in Japan and Reviewing the Local Public Hospital Reform. Risk Management and Healthcare Policy, 9, 21-32.https://doi.org/10.2147/RMHP.S93285
[7] Sudo, K., Kobayashi, J., Noda, S., Fukuda, Y. and Takahashi, K. (2018) Japan’s Healthcare Policy for the Elderly through the Concepts of Self-Help (Ji-Jo), Mutual Aid (Go-Jo), Social Solidarity Care (Kyo-Jo), and Governmental Care (Ko-Jo). Bi-oScience Trends, 12, 7-11.https://doi.org/10.5582/bst.2017.01271
[8] Ikegami, N. and Anderson, G.F. (2012) In Japan, All-Payer Rate Setting under Tight Government Control Has Proved to Be an Effective Approach to Containing Costs.
Health Affairs, 31, 1049-1056.https://doi.org/10.1377/hlthaff.2011.1037
[9] Ikegami, N. and Campbell, J.C. (2004) Japan’s Health Care System: Containing Costs and Attempting Reform. Health Affairs, 23, 26-36.
https://doi.org/10.1377/hlthaff.23.3.26
[10] Beauvais, B. and Wells, R. (2006) Does Money Really Matter? A Review of the Lite-rature on the Relationships between Healthcare Organization Finances and Quality.
Hospital Topics, 84, 20-29. https://doi.org/10.3200/HTPS.84.2.20-29
[11] Encinosa, W.E. and Bernard, D.M. (2005) Hospital Finances and Patient Safety Outcomes. INQUIRY: The Journal of Health Care Organization, Provision, and Fi-nancing, 42, 60-72. https://doi.org/10.5034/inquiryjrnl_42.1.60
[12] Ikegami, N., Drummond, M., Fukuhara, S., Nishimura, S., Torrance, G.W. and Schu-bert, F. (2002) Why Has the Use of Health Economic Evaluation in Japan Lagged behind That in Other Developed Countries? Pharmacoeconomics, 20, 1-7. https://doi.org/10.2165/00019053-200220002-00001
[13] Japanese Ministry of Internal Affairs and Communications (2018) Yearbook of Lo-cal Public Enterprise. http://www.soumu.go.jp/english/lpfb/index.html
[14] Coyne, J.S., Richards, M.T., Short, R., Shultz, K., Singh, S.G., et al. (2009) Hospital Cost and Efficiency: Do Hospital Size and Ownership Type Really Matter? Journal of Healthcare Management, 54, 163-174.
https://doi.org/10.1097/00115514-200905000-00005
[15] Besstremyannaya, G. (2011) Managerial Performance and Cost Efficiency of Japa-nese Local Public Hospitals: A Latent Class Stochastic Frontier Model. Health Eco-nomics, 20, 19-34.https://doi.org/10.1002/hec.1769