ARTICLE
Cite this: DOI: 10.1039/x0xx00000x
Received 00th January 2012, Accepted 00th January 2012
DOI: 10.1039/x0xx00000x
www.rsc.org/
Structure and Properties of MgM
x
Cr
2-x
O
4
(M= Li,
Mg, Ti, Fe, Cu, Ga) spinels for electrode supports in
Solid Oxide Fuel Cells
Elena Stefan
a, Paul A. Connor
aAbul K. Azad
a,#and John T. S. Irvine
a,*Novel electrode scaffold materials based on chromium -rich spinels, such as MgMxCr2-xO4,
(M = Li, Mg, Ti, Fe, Cu, Ga) have been investigated for Solid Oxide Fuel Cell (SOFC) applications, in terms of conductivity and chemical stability when operated in fuel environments. Cation distributions were obtained by Rieveld refinement from X -ray diffraction data (XRD), with cation site preference considered in agreement with literature, and correlated with electrical properties determined experimentally. The substitutions with cations such as Li and Cu on B site improved the conductivity of the mate rials in air, while introducing Fe and Ga in the structure led to a decrease in conductivity in air. However, Fe had a positive contribution under reducing conditions, generating a change in the conductivity mechanism from p-type in air, to n-type. Conductivity measurements indicated that MgFexCr2-xO4 spinels exhibit faster reduction kinetics, in comparison with other
substituted cations at the B site which is desirable in fuel cell application, for a reasonably fast response of a cell or a stack to reach its full functional potential. MgFeCrO4 showed fast
reduction kinetics, with increase of the conductivity in r educing conditions from 0.014 S cm-1 to 0.4 S cm-1 and equilibration time for reaching the maximum conductivity value of 10 hours, under dry 5%H2/Ar at 850 °C.
1.
Introduction
The limited availability of fossil energy sources and the increase of the total greenhouse emissions in the last century reinforced the concept of renewable energy usage and the development of appropriate technologies, such as fuel cells.1 Solid Oxide Fuel Cells (SOFCs) are high efficiency electrochemical devices which convert chemical energy into electrical energy directly from the oxidation of fuels.2,3 SOFCs consists of two porous electrodes separated by a dense, ion (typically oxide) conducting but electronically insulating electrolyte. At the cathode, O2 is reduced to O2- which travels
through the electrolyte to the anode and oxidise the fuel, releasing electrons into the outer circuit and thus generating power.4 For good performance and durability, the materials used for the electrodes should meet several requirements, including, but not limited to, chemical and structural stability during the preparation and operation, similar thermal expansion
coefficients, adequate porosity, ionic and electronic conductivity and catalytic activity.5–7
These requirements cannot be easily fulfilled by one material alone, especially in the case of the anode, which needs both ionic and electronic conduction, such as obtained in the composite Ni-yttria stabilised zirconia (YSZ) cermet. This particular electrode shows good performance but suffers degradation in certain conditions, due to low redox tolerance.8
To overcome these problems several anode formulations and architectures are being investigated. The most promising and versatile approach so far seems to be the use of a porous scaffold with either good ionic (e.g. YSZ) or electronic (e.g. perovskites) conductivity in which various species are added (infiltrated) to fulfil the electrochemical/catalytic functions which the scaffold is lacking.9–20
ARTICLE Journal Name
compatible with metallic interconnect interfaces as compared to other oxide systems.
Spinel oxides are characterised by the general formula AB2O4
with A being a tetrahedral cation and B, an octahedral cation and display a cubic crystal structure with a symmetry described by the space group 𝐹𝑑3̅𝑚 (No. 227).21 One unit cell contains 8 AB2O4 spinel formula units, which is a total of 56 atoms (with
8 A cations, 16 B cations and 32 oxygen anions). Oxygen anions form a cubic closed packed lattice with 64 tetrahedral and 32 octahedral sites partially filled with cations. The occupancy for the tetrahedral sites is only 1/8 and for the octahedral sites is 1/2. The similar size for the A and B cations makes it possible that cations which support both coordination numbers can interchange sites, thus leading to the so called inverse spinels. Inversion can be synthetically expressed as
(A1−γBγ)𝑇𝑑(AγB2−γ)𝑂ℎO4, where subscripts Td and Oh refer to the tetrahedral and octahedral sites, respectively. Normal spinels are formed for x = 0, perfectly inverse spinels for x = 1, while intermediate values for γ, 0 < γ < 1, are called randomly inverse spinels. 21,22
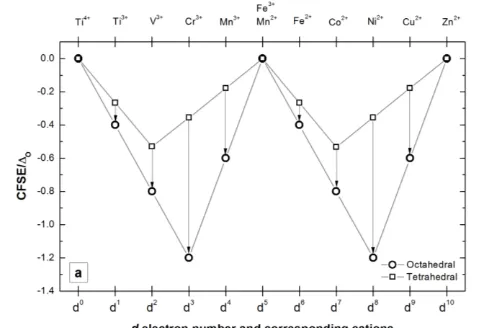
The cation distribution amongst tetrahedral and octahedral sites is governed by the minimization of the total energy with respect to several factors, including the field stabilization energy (CFSE) of cations, the charge and the size of the cations.23–25 Cations with noble gas electron configurations have no preference for either coordination and their distribution is determined mainly by the size and energy of the lattice (e.g. Li+, Mg2+, Al3+, Ti4+). Cations with half-filled 3d shells have spherical-like charge distribution (e.g. Mn2+, Fe3+), therefore without expected preference for either position, while those with 3d3 an 3d8 (e.g. Cr3+, Ni2+, Mn4+) have strong preference for six-fold coordination because of the high corresponding crystal field stabilisation energy (Figure 1). The site preference of cations with various degrees of d-orbital occupancy (d1, d2, d4, d6, d7 and d9) can be estimated in an initial, simplified approach based on the relative magnitude of their corresponding CFSE, calculated according to references 26,27 and plotted in Figure 1.
Figure 1. a) Crystal field stabilization energies for tetrahedral (Δtd) and octahedral
coordination (Δoct), for cations with different number of d electrons. Calculated
according to ref 26,27. Δ
0 represents the magnitude of the split of the d orbitals; b)
Ionic radius 28 for Mn2+, Fe2+, Li+, Cu2+, Mg2+, Mn3+, Fe3+ and Ga3+ and coordination numbers (CN). Dashed lines illustrate the absence of ionic radii of Cr3+ and Mn3+
for CN = 4. Solid lines indicate the variation of ionic radii for cations used in this study with CN = 4 and CN = 6.
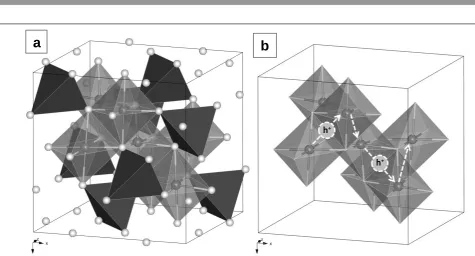
Spinels are typically p-type semiconductors. Electronic conduction occurs by thermally activated hopping of electron holes throughout the B-sites because the BO6 octahedra share
edges and thus the B-B distances are relatively short (~0.35a, Figure 2 b).22 For example in chromium spinels conduction is
described by hopping of an electron hole h+ between chromium ions with different valences:29
𝐶𝑟𝐶𝑟× + ℎ∙↔ 𝐶𝑟𝐶𝑟∙ Equation 1
The reduction reaction leads to a decrease in the number of charge carrier sources (Cr4+ ions), equivalent with a decrease in
the hole concentration, according to the equilibrium:
𝑂𝑂′′+ 2𝐶𝑟𝐶𝑟∙ ↔ 2𝐶𝑟𝐶𝑟× + 𝑉𝑂∙∙+ 1 2⁄ 𝑂2 Equation 2 As a consequence of the reduction, for charge balance there must also be the formation of vacancies in the oxygen sublattice
VO∙∙ of the spinel.
However, spinels are typically known to only be able to incorporate a small concentration of vacancies and thus oxygen vacancies would not be expected to dominate spinel defect chemistry, but it would be possible that spinels incorporate more or less oxygen per formula unit through cation vacancies or interstitials e.g. M3±δO4.30 In the specific case of chromite
and ferro-chromites mostly discussed here, it would be expected that a small amount of cation vacancies form at high oxygen pressure during material processing (Moriwake et al.31–
33).
In order to increase conductivity in reducing conditions (since spinels are lacking in this respect), possibly associated with a change in the conductivity mechanism from p-type to n-type semiconductor upon reduction, chromium ions have been partially substituted with isovalent or aliovalent cations. Previously, MnCr2O4, MnMxCr2-xO4 and MgCr2O4 were
investigated34 for assigning the chemical stability of such spinels in reducing conditions. Here, the cation substitutions – properties relationship, and in particular chemical stability and electrical conductivity, of newly formulated Cr-rich spinels, such as MgMxCr2-xO4 (M = Li, Mg, Ti, Fe, Cu, Ga) has been
[image:2.595.307.549.51.216.2] [image:2.595.46.289.460.624.2]ARTICLE
Figure 2 Cubic unit cell of spinel MgCr2O4 represented in polyhedral model: (a) representation of A and B-site cation lattice; (b) Schematic representation for hopping
of an electron hole in the B-site cation lattice (in order to simplify the representation, the A site lattice was omitted).
2. Experimental
Samples containing Li, Mg, Fe and Cu were prepared by citric acid – nitrate combustion synthesis,34 while the samples containing Ti, Ga were prepared by solid state reaction. After the combustion reaction was complete, the obtained powders were calcined at 1000 °C for 10 hours. For solid state synthesis Cr2O3 (Alfa Aesar (99%)), (MgCO3)4Mg(OH)2∙5H2O (Aldrich
(99%)), TiO2 (Alfa Aesar (99.5%)), Ga2O3 (Aldrich (99.99%))
were weighed in stoichiometric amounts and mixed using an ultrasonic probe in acetone for 10 minutes, in order to obtain a good dispersion of the oxides and homogenisation. A small amount of dispersant KD1 (1 wt%) was added and the dispersion was stirred for 2 hours. The mixtures were dried and the resulting powders were calcined at 1000 °C for 10 hours. After being calcined, the powders were milled for 2 hours in acetone and then dried. The resulting powders were then pressed into pellets (13 mm diameter and 2 ± 0.3 mm thickness) at a pressure of ~200 MPa and sintered at 1400 °C for 12 hours in air.
XRD patterns were initially collected for preliminary phase purity analysis on either a Philips PW 1710 X-ray diffractometer operated in reflection mode, or on a PANalytical Empyrean Diffractometer also operated in reflection mode, to serve for advanced structural analysis. The high resolution XRD patterns were analysed via the Rietveld method by using the Fullprof software37 in order to extract information regarding
(u, Å), as well as cation distribution among tetrahedral and octahedral sites. Initial cation distributions were assumed based on typical cation site preference, as reported in the literature.21,23,31,38,39 The inversion was refined only at later stages of the refinement, after the background, scale factor, cell parameter, oxygen parameter, peak profile parameters and the thermal factor were refined. In the case of species with very similar X-ray scattering factors such as Fe, Cr and Mn, the inversion degree was not refined because XRD cannot accurately discriminate between them and, as such, they were considered to be normal spinels.
D.C. electrical conductivity measurements were performed in static air or in reducing atmosphere of a continuous gas flow of 50 cm3/min 5%H
2/Ar. Four Pt foils of ~1 mm thickness were
applied parallel onto a pellet surface, as shown in Figure 3, with platinum paste and sintered at 900 °C for a good contact between the platinum contacts and the pellet. Relative densities of measured pellets were 55-70 % dense, while the sample MnFeCrO4 had a relative density of 80 %. The experimental
setup is described in ref 40.
Figure 3. Contact geometry used for 4-terminal conductivity measurements.
[image:3.595.300.554.631.685.2]ARTICLE Journal Name
3. Results and discussion
3.1 Phase analysis and crystal structure
Spinel oxides MgMxCr2-xO4, (M = Li, Mg, Ti, Fe, Cu, Ga) were
synthesised by solution combustion synthesis or by solid state reaction as described in the experimental section and were investigated with respect to phase analysis, density, chemical stability in reducing conditions and electrical conductivity. Compositions such as MgGaxCr2-xO4 (x = 0.1, 0.2),
MgFexCr2-xO4 (x = 0.1, 0.5, 1), MgLixCr2-xO4 (x = 0.1),
MgCuxCr2-xO4 (x = 0.1) and Mg1.5Ti0.5CrO4, were found to
form single phase cubic spinels when prepared in air, whereas MgTixCr2-xO4 (x = 0.1) only formed a single phase when
prepared in reducing conditions. For x = 0.2, MgLixCr2-xO4,
MgCuxCr2-xO4 obtained in air and MgTixCr2-xO4, obtained in
reducing conditions showed segregation of secondary phases. The cation distributions, along with a, u values and Rp, Rwp,
Rexp and χ2, determined from Rietveld refinement are presented
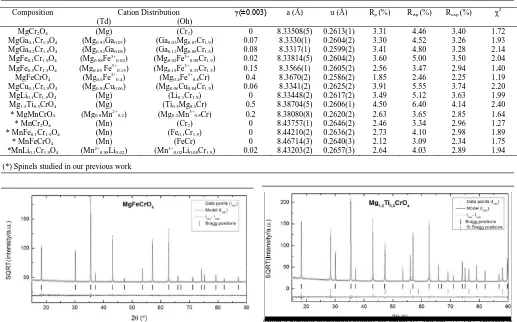
in Table 1. Rietveld refinement was performed in the space group 𝐹𝑑3̅𝑚 with origin at 3̅𝑚 and the A, B, and O site positions corresponding to 8a (¼, ¼, ¼), 16d (½, ½, ½) and 32e (u, u, u), respectively. Selected refinement plots are illustrated in Figure 4, where observed intensities are plotted with light grey dots, calculated intensities with black line and the difference between calculated and observed intensities is given
as dark grey line. XRD was performed on some samples with Si as internal standard for more accurate cell parameters.The cation distributions obtained from Rietveld refinement are in a good agreement with the CFSE stabilisation energies of the cations (Figure 1 a).
A higher degree of inversion resulted for MgFexCr2-xO4
compositions, between the Mg and Fe cations, which could be both the result of non-preference for sites of the Fe3+ cations or
the preference for both octahedral and tetrahedral sites of the Fe2+ cations. Also Cu and Ga substituted spinels showed small inversions. In case of MgCu0.1Cr1.9O4, unexpectedly, the
inversion between Mg and Cu cations could be the result of no preference for sites of the Mg2+. The size of the two cations should not influence the site preference, since they have almost the same ionic radii at the A and B sites (Shannon radii - Figure 1 b). In case of MgGaxCr2-xO4, the inversion between Mg2+ and
[image:4.595.40.557.338.660.2]Ga3+ was about the same for x = 0.1 and x = 0.2 Ga substituted at the B site (Table 1). Both, Ga3+ (d10) and Mg2+ have no preference for sites, and the ionic radii of the Ga3+ for CN = 4 and CN = 6 are smaller than for Mg2+, which would determine a certain degree of inversion. However, the octahedral cation radius of Ga3+, is very close to Cr3+ and much smaller than Mg2+, which limits the inversion between Mg and Ga. Data listed in Table 1, such as unit cell parameters and cation distributions are correlated with conductivity values in section 3.3.
Table 1 Cation distribution, a, u and reliability factors for the Rietveld refinement.
Composition Cation Distribution γ(±0.003) a (Å) u (Å) Rp (%) Rwp (%) Rexp (%) χ2
(Td) (Oh)
MgCr2O4 (Mg) (Cr2) 0 8.33508(5) 0.2613(1) 3.31 4.46 3.40 1.72
MgGa0.1Cr1.9O4 (Mg0.93Ga0.07) (Ga0.03Mg0.07Cr1.9) 0.07 8.3330(1) 0.2604(2) 3.30 4.52 3.26 1.93
MgGa0.2Cr1.8O4 (Mg0.92Ga0.08) (Ga0.12Mg0.08Cr1.8) 0.08 8.3317(1) 0.2599(2) 3.41 4.80 3.28 2.14
MgFe0.1Cr1.9O4 (Mg0.98Fe3+0.02) (Mg0.02Fe3+0.08Cr1.9) 0.02 8.33814(5) 0.2604(2) 3.60 5.00 3.50 2.04
MgFe0.5Cr1.5O4 (Mg0.85 Fe3+0.15) (Mg0.15Fe3+0.35Cr1.5) 0.15 8.3566(1) 0.2605(2) 2.56 3.47 2.94 1.40
MgFeCrO4 (Mg0.6Fe3+0.4) (Mg0.4Fe3+0.6Cr) 0.4 8.3670(2) 0.2586(2) 1.85 2.46 2.25 1.19
MgCu0.1Cr1.9O4 (Mg0.94Cu0.06) (Mg0.06Cu0.04Cr1.9) 0.06 8.3341(2) 0.2625(2) 3.91 5.55 3.74 2.20
MgLi0.1Cr1.9O4 (Mg) (Li0.1Cr1.9) 0 8.33448(2) 0.2617(2) 3.49 5.12 3.63 1.99
Mg1.5Ti0.5CrO4 (Mg) (Ti0.5Mg0.5Cr) 0.5 8.38704(5) 0.2606(1) 4.50 6.40 4.14 2.40
* MgMnCrO4 (Mg0.8Mn2+0.2) (Mg0.2Mn3+0.8Cr) 0.2 8.38080(8) 0.2620(2) 2.63 3.65 2.85 1.64
* MnCr2O4 (Mn) (Cr2) 0 8.43757(1) 0.2646(2) 2.46 3.34 2.96 1.27
* MnFe0.1Cr1.9O4 (Mn) (Fe0.1Cr1.9) 0 8.44210(2) 0.2636(2) 2.73 4.10 2.98 1.89
* MnFeCrO4 (Mn) (FeCr) 0 8.46714(3) 0.2640(3) 2.12 3.09 2.34 1.75
*MnLi0.1Cr1.9O4 (Mn2+0.98Li0.02) (Mn3+0.02Li0.08Cr1.9) 0.02 8.43203(2) 0.2657(3) 2.64 4.03 2.89 1.94
[image:4.595.37.558.339.670.2](*) Spinels studied in our previous work
Figure 4 Rietveld refinement profiles for MgFeCrO4 and Mg1.5Ti0.5CrO4 sintered in
3.2 Chemical stability in reducing conditions
The anode of an SOFC is exposed to both highly reducing fuels and high steam conditions, thus the use of spinels as anode support materials in SOFCs requires chemical stability of the materials in such conditions. The chemical stability in reducing conditions was determined by applying thermal treatments in 5%H2/Ar at 1000 °C for 20 hours. In the MgMxCr2-xO4 series,
samples with M = Ga (x = 0.1, 0.2), Ti (x = 0.1) and Cu (x = 0.1) no phase change was found upon reduction, while samples with M = Fe (x = 0.1, 0.5, 1) showed segregation of metallic Fe and MgO. The segregation of Fe and MgO for MgFeCrO4-δ is reported in ref35 in its application as electrode
support. MgFeCrO4-δ was stable when reduced at 850 °C for
30 hours in 5%H2/Ar with no evidence of Fe (Figure 5), which
indicates its stability in fuel environments when operated lower than 850 °C. When reduced in humidified (3% H2O) 5%H2/Ar
at 1000 °C for 20 hours, MgFeCrO4 was also stable.35 The
[image:5.595.44.292.251.395.2]XRD patterns are included in Figure 5.
Figure 5 X-ray diffraction pattern of MgFeCrO4-δ reduced in dry 5%H2/Ar at 850 °C
for 30 h and in humidified 5%H2/Ar at 1000 °C for 20 hours (XRD pattern 1 was
collected on a Philips PW 1710 X-ray diffractometer, showing Kα1 and Kα2 lines in the XRD pattern).
3.3 Electrical properties
Electrical conductivity measurements were conducted both in air and reducing conditions (5%H2/Ar) on porous ceramic
bodies prepared by sintering in air at 1400 °C corresponding to MgMxCr2-xO4 (M = Li, Mg, Ti, Fe, Cu, Ga) and MnMxCr2-xO4.
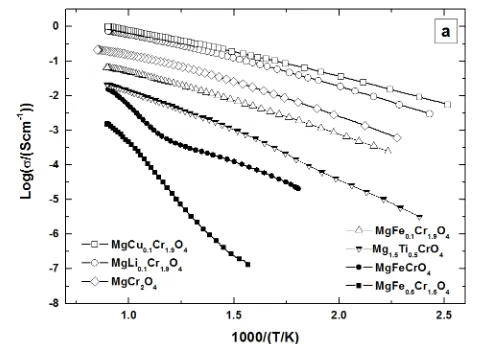
The materials preserved the p-type semiconducting behaviour upon substitutions by all cations in air and reducing conditions, except for Ti and higher Fe content which induced an increase in conductivity when reduced (n-type behaviour). Figure 6 a illustrates the Arrhenius plot of selected spinels and in Figure 7 the effect of Li, Mg, Ti, Fe, Cu, Ga substitutions at the B site can be compared in terms of conductivity reached in air and reducing conditions.
The activation energy (Ea, eV) of the conductivity measured in
air was estimated for two temperature domains: low temperature range (100 – 450 °C) and high temperature range (450 – 850 °C). The Ea values are plotted vs. the cell parameter
for MgMxCr2-xO4 and MnMxCr2-xO4 (Figure 6 and Table 1.). Ea
decreased with increasing temperature for MgMxCr2-xO4, which
is characteristic for a ceramic going from grain boundary to bulk domination of the resistance, while for MnMxCr2-xO4, Ea
increased with the temperature.34 A similar phenomenon was observed for MgFeCr O series, possibly indicating a
of the cations at the B site. The spinels for which the substitution at the B site and the inversion degree are higher, showed a decrease in conductivity and higher Ea values. While
for substitutions of Li and Cu on the A site, the B lattice remained mainly based on Cr3+ cations, the conductivity increased and Ea values decreased, as would be expected if they
induced a higher concentration of charge carrier at the B sites. Figure 6 b shows an increase of the Ea values with the cell
parameter for a bigger cation at the A site, such as Mn in comparison with Mg. A larger cation occupying the A site increases the distance between the B site cations and decreases the overlapping of the d orbitals, thus increasing the energy necessary for the hoping of electron holes. The exceptions from the linear trend for each spinel series are both connected to the substitution of Cr with Fe on the B site.
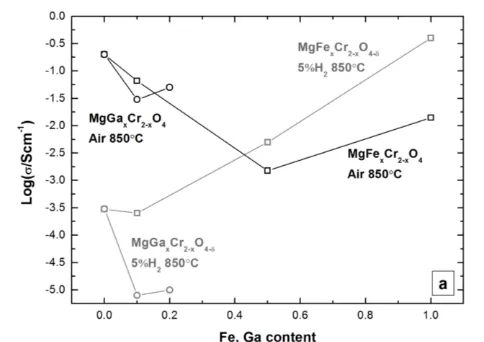
The conductivity measured in air for MgFexCr2-xO4 series
(x = 0, 0.1, 0.5, 1) decreased with increasing iron content. A minimum value of 2x10⁻³ S cm-1 at 850 °C corresponded to x = 0.5, and for x = 1 conductivity increased again to 0.014 S cm-1. In reducing conditions, the conductivity increased with the iron content, as shown in Figure 7 a, where the maximum value corresponded to x = 1, with 0.4 S cm-1. The influence of Ga doping on the electrical conductivity was negative, with MgGaxCr2-xO4 (x = 0.1, 0.2) showing lower
conductivity than MgCr2O4 in both air and reducing
atmosphere, as illustrated in Figure 7 a. Thus, the investigation of spinels with higher content of Ga substituted at the B site was not investigated. The conductivity measured in air and reducing conditions, for MgM0.1Cr1.9O4 series (M = Ga, Li, Cu,
Fe) demonstrated an increase in conductivity for Li and Cu substitutions, as observed in Figure 7 b MgFexCr2-xO4-δ and
MnFexCr2-xO4-δ series showed an increase in conductivity when
reduced. The increase in conductivity could indicate the formation of Fe2+/Fe3+ couples, increasing the total number of charge carriers. MgFe0.1Cr1.9O4-δ maintained its p-type
conductivity behaviour when reduced. But for higher Fe content, the conductivity changed, with MgFe0.5Cr1.5O4-δ and
[image:5.595.308.550.452.624.2]ARTICLE Journal Name
Figure 6 a) Arrhenius plots for listed spinels determined from DC electrical measurements in air for temperature range 100-870 °C; b) Activation energy dependence with unit cell parameter and temperature in air for listed materials; the marked positions correspond to MgFe0.5Cr1.5O4 (full circle), MgFeCrO4 (full
square/circle) and MnFe0.1Cr1.9O4 (full square/circle).
Electrical properties for MnMxCr2-xO4 spinels have been
measured only in air because most of these samples segregate secondary phases in reducing conditions. The influence of substitution on B site with Li, x = 0.1 had similar influence to the one observed for MgLi0.1Cr1.9O4 but here the increase in
conductivity was more consistent. Introducing a small amount of Fe on B site led to a minimum value of conductivity and the increase of Fe content increased the conductivity of the material, similar to MgFexCr2-xO4 series. The plotted points
represent conductivity values after the apparent equilibration of the samples in air or reducing conditions, at 850 °C.
[image:6.595.49.284.53.226.2] [image:6.595.312.548.54.216.2] [image:6.595.46.288.543.714.2]The response of the material in terms of conductivity, upon the sudden change in pO2 is plotted against time, as illustrated in
Figure 8, for MgLi0.1Cr1.9O4-δ, MgCu0.1Cr1.9O4-δ,
MgFe0.1Cr1.9O4-δ, MgFe0.5Cr1.5O4-δ, MgFeCrO4-δ and
Mg1.5Ti0.5CrO4-δ. The pO2 value decreased within a matter of
minutes to ~10-18 atm and was kept constant for the duration of the experiments assured by a continuous gas flow of 50 cm3/min 5%H2/Ar. The plots show a fast initial decrease in
conductivity for MgLi0.1Cr1.9O4-δ, MgCu0.1Cr1.9O4-δ and
MgFe0.1Cr1.9O4-δ, followed by a continuous and slower decrease
in conductivity for MgLi0.1Cr1.9O4-δ, MgCu0.1Cr1.9O4-δ, while
the conductivity of MgFe0.1Cr1.9O4-δ reached a plateau region,
after approximately 15 hours.
Figure 7 a) Log (σ) vs. the Fe content for MgFexCr2-xO4 equilibrated in air and
reducing conditions at 850 °C and Log (σ) vs. the Ga content for MgGaxCr2-xO4 in
air and reducing conditions at 850 °C; b) Log (σ) vs. the cell parameter for MgM0.1Cr1.9O4 in air and reducing conditions at 850°C and Log (σ) vs. the cell
parameter for MnMxCr2-xO4 in air and reducing conditions at 850 °C.
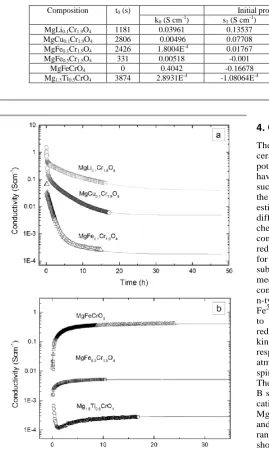
Upon reduction, MgFe0.5Cr1.5O4-δ and MgFeCrO4-δ showed a
fast increase in conductivity within the first hour, of 1 order of magnitude, from 0.014 to ~0.4 S cm-1 for MgFeCrO
4-δ and only
~0.3 order of magnitude, from 0.0013 to ~0.003 S cm-1 for MgFe0.5Cr1.5O4-δ.
Mg1.5Ti0.5CrO4-δ shows an initial decrease of 2 orders of
magnitude in the conductivity, within the first hour of reduction. Following this, its conductivity increased slowly, showing n-type conductivity.
MgFe0.1Cr1.9O4-δ, MgFe0.5Cr1.5O4-δ and MgFeCrO4-δ reached a
conductivity plateau in the reduction time allocated in each case, while MgLi0.1Cr1.9O4-δ, MgCu0.1Cr1.9O4-δ and
Mg1.5Ti0.5CrO4-δ did not reach a plateau in the observed
reduction time. The data were fitted to a decay function, in order to indicate the minimum time required for equilibrating the conductivity of the samples at 850 °C and pO2 ~10
-18
atm. Neagu and Irvine2 used a similar mathematical model for fitting a kinetically controlled mass loss during titanate perovskite reduction. They described the characteristics of the reduction as being controlled by two (first order) processes: a fast process corresponding to the reduction of the surface and a slow process corresponding to the diffusion of the oxygen from the bulk towards the surface of the material. The datasets are described by equation 3, for which the two exponentials reflect the kinetics of two processes, as follows:
(𝜎)(𝑡) = 𝑠0+ 𝑠1∙ 𝑒−𝑘2(𝑡−𝑡0)+ 𝑠3∙ 𝑒−𝑘4(𝑡−𝑡0) Equation 3 The equation implies two diffusion processes are occurring: process 1, described by s1 and k2 constants and process 2 with
constants s3 and k4, with t0 being the initial time interval
necessary for the process to start. These processes could be associated with the oxygen reduction (Equation 2) from the material’s surface and bulk, respectively. The regression plots showed a very good fit with the experimental data (Figure 8) and the corresponding coefficients are listed in Table 2. The regression curve for MgLi0.1Cr1.9O4 suggests that the
required time for the samples to achieve equilibrium is 40 hours and the decrease in conductivity in the interval 16 – 40 hours is significantly less than the time interval 0 – 16 hours. The time constants in Table 2 suggest that one of the processes is faster and one slower (k2 > k4) and they have similar contribution to
the conductivity decrease (s1 and s3, the same order of
The equilibration time for MgCu0.1Cr1.9O4-δ resulted to be
~45 hours. The time constants suggest that one of the processes is faster and one is slower (k2 > k4) and they have similar
contribution to the conductivity decrease (s1 and s3, have the
same order of magnitude). MgFe0.1Cr1.9O4 reached equilibrium
after ~15 hours and the time constants suggested one fast and one slow process (k2 > k4) and also that the first has the higher
contribution to the conductivity decrease (s1 > s3).
Considering the samples that showed n-type behaviour, i.e. conductivity increased on reduction. MgFe0.5Cr1.5O4-δ reached
its equilibrium conductivity upon reduction after 10.5 hours. MgFeCrO4-δ showed a similar behaviour, with the conductivity
reaching a plateau after ~10 hours of reduction. The time constants showed one fast and one slow process (k2 > k4) with
both processes having similar contribution to the increase in conductivity (s1 ≈ s3). After the initial phase of decrease in
conductivity, Mg1.5Ti0.5CrO4-δ reached equilibrium conductivity
after ~35 hours of reduction, for which the time constants k2 = k4 and the rate constants s1 = s3.
The fast reduction kinetics observed for MgFexCr2-xO4 spinels
could be related to a Fe enrichment of the material’s surface, as also reported by Sakai et al.41 for MnFeCrO
4. Sakai et al.41
found that MnFeCrO4 showed a surface enriched in Fe, which
also affects the oxygen transport properties. They concluded that fast oxygen isotope transport occurred in the Fe rich regions for MnFeCrO4, in comparison with the measured
[image:7.595.46.316.216.669.2]oxygen isotope transport for MnCr2O4.
Table 2 Fitting parameters for the variation of log (σ) with reduction time presented in Figure 8.
Composition t0 (s) Initial process (0 – 5 h) Second process
k0 (S cm-1) s1 (S cm-1) k2 (s-1) s3 (S cm-1) k4 (s-1)
MgLi0.1Cr1.9O4 1181 0.03961 0.13537 1.4895E-4 0.24854 3.4943E-5
MgCu0.1Cr1.9O4 2806 0.00496 0.07708 3.7942E-4 0.0364 6.9124E-5
MgFe0.1Cr1.9O4 2426 1.8004E-4 0.01767 3.1095E-4 8.1285E-4 4.9786E-5
MgFe0.5Cr1.5O4 331 0.00518 -0.001 1.06E-3 -2.47E-3 1.0191E-4
MgFeCrO4 0 0.4042 -0.16678 3.4366E-4 -0.23465 4.9818E-5
Mg1.5Ti0.5CrO4 3874 2.8931E-4 -1.08064E-4 4.4669E-5 - -
Figure 8 Variation of log (σ) and log (pO2) with reduction time the fitting of the
datasets for longer reduction time at 850 °C.
4.
Conclusions
The properties of MgMxCr2-xO4, (M = Li, Mg, Ti, Fe, Cu, Ga)
ceramics have been investigated to determine their suitability as potential electrode support materials in SOFCs. The materials have been found to form pure phase cubic spinels. Cations such as Li, Cu and Ti showed a limit of solubility (x ≤ 0.1) in the MgMxCr2-xO4 spinel. A degree of inversion, γ was
estimated by means of Rietveld refinement of the X-ray diffraction patterns. The samples have been shown to be chemically stable in reducing conditions and only the Fe containing samples had limited stability under too harsh reducing conditions. MgMxCr2-xO4 are p-type semiconductors
for M = Li, Mg, Cu, Ga when measured in air or reduced. Fe substitution at the B site induced changes in the conduction mechanism of chromium spinels with positive effects for the conductivity in reducing conditions of MgFeCrO4, which had
n-type conductivity due to partial reduction of Fe3+ cations to Fe2+. Too harsh reduction conditions (> 850 ˚C) reduced the Fe to metal. Also Mg1.5Ti0.5CrO4 had n-type conductivity in
reducing conditions. MgFexCr2-xO4 spinels showed faster
kinetics upon reduction, since the materials had a rapid response in conductivity variation with switching the atmosphere, in comparison with Li, Cu or Ti substituted spinels.
The charge compensation corresponding to the substitutions at B site with Li+ and Cu2+ implied an increase of charge on Cr3+ cations, as observed by the increase of the conductivity for MgCu0.1Cr1.9O4, MgLi0.1Cr1.9O4 and MnLi0.1Cr1.9O4 both in air
and reducing conditions. The change in Ea with the temperature
range for MgMxCr2-xO4 and MnMxCr2-xO4 measured in air
showed opposite tendencies: Ea decreased with increasing
temperature for MgMxCr2-xO4, which is characteristic to a
ceramic going from grain boundary to bulk domination of the conduction. For MnMxCr2-xO4 an increase in activation energy
ARTICLE Journal Name
breakdown of some ordering phenomenon that is limiting conduction.
The cation inversion observed in the Rietveld refinement for MgFexCr2-xO4 was supported by the material’s electrical
properties: the conductivity measured in air decreased and the activation energy values increased drastically with the increase of Fe content.
Overall, the spinels which showed good chemical stability, with no secondary phase segregation, maintained the p-type conductivity in reducing conditions. MgGaxCr2-xO4 showed an
electrical conductivity lower than the conductivity of the parent material, MgCr2O4, with a major decrease down to 10-5 S cm-1
which is a disadvantage for its application as electrode support materials. Even though MgCu0.1Cr1.9O4, MgLi0.1Cr1.9O4,
maintained higher conductivity when reduced, the improvement in conductivity was not sufficient. MgFeCrO4 may be a good
compromise between conductivity and chemical stability for the anode support application.
Acknowledgements
The authors thank the Office of Naval Research, USA, grant code N00014-11-1-0247, the Engineering and Physical Sciences Research Council, UK, grant platform EP/E064248/1 and the European Union’s Seventh Framework Programme (FP7/2007-2013) for the Fuel Cell and Hydrogen Joint Technology initiative under grant agreement n°[FCH JU-GA 278257]10 for financial support.
All authors have given approval to the final version of the manuscript.
Notes and references
a School of Chemistry, University of St. Andrews, Fife KY16 9ST, U.K.
* E-mail: [email protected].
# Current address: Faculty of Integrated Technologies, University Brunei
Darussalam, Gadong BE 1410, Brunei Darussalam.
1. A. Galich and L. Marz, Energy Sustain. Soc., 2012, 2, 2.
2. D. Neagu and J. T. S. Irvine, Chem. Mater. ACS Publ., 2010, 22, 5042–5053.
3. R. Knibbe, H.-J. Wang, P. Blennow, K. Thydén, Å. H. Persson, L. Mikkelsen, and T. Klemensø, J. Power Sources, 2013, 228, 75–82. 4. J. Goodenough and Y. H. Huang, J. Power Sources, 2007, 173, 1–10. 5. E. Povoden-Karadeniz, Thermodynamic database of the La-Sr-Mn-Cr-O oxide system and applications to solid oxide fuel cells, [s.n.], [S.l.], 2008.
6. J. C. Ruiz-Morales, J. Canales-Vázquez, B. Ballesteros-Pérez, J. Peña-Martínez, D. Marrero-López, J. T. S. Irvine, and P. Núñez, J. Eur. Ceram. Soc., 2007, 27, 4223 – 4227.
7. S. M. Plint, P. A. Connor, S. Tao, and J. T. S. Irvine, Solid State Ion.,
177, 2005–2008.
8. J. T. S. Irvine and P. Connor, in Solid Oxide Fuels Cells: Facts and Figures, eds. J. T. S. Irvine and P. Connor, Springer London, 2013, pp. 163–180.
9. M. Gross, J. Vohs, and R. Gorte, J. Electrochem. Soc., 2007, 154, B694–B699.
10. W. Z. Zhu and S. C. Deevi, Mater. Sci. Eng. A, 2003, 362, 228 – 239. 11. S. McIntosh, J. M. Vohs, and R. J. Gorte, Electrochimica Acta, 2002,
47, 3815–3821.
12. H.-S. Noh, J.-W. Son, H. Lee, H.-I. Ji, J.-H. Lee, and H.-W. Lee, J. Eur. Ceram. Soc., 2010, 30, 3415–3423.
13. S. Choi, J. Wang, Z. Cheng, and M. Liu, J. Electrochem. Soc., 2008,
155, B449–B454.
14. J. Rossmeisl and W. G. Bessler, Solid State Ion., 2008, 178, 1694 – 1700.
15. J.-S. Kim, V. V. Nair, J. M. Vohs, and R. J. Gorte, Scr. Mater., 2011,
65, 90–95.
16. X. Yang and J. T. S. Irvine, J Mater Chem, 2008, 18, 2349–2354. 17. Y. Huang, J. M. Vohs, and R. J. Gorte, J. Electrochem. Soc., 2004,
151, A646.
18. W. Wang, M. Gross, J. Vohs, and R. Gorte, J. Electrochem. Soc., 2007, 154, 8439–8445.
19. Corre, G. Kim, M. Cassidy, J. M. Vohs, R. J. Gorte, and J. T. S. Irvine, Chem. Mater., 2009, 21, 1077–1084.
20. J. H. Kim, D. Miller, H. Schlegl, D. McGrouther, and J. T. S. Irvine,
Chem. Mater., 2011, 23, 3841–3847.
21. H. S. C. O’Neill and A. Navrotsky, Am. Mineral., 1983, 68, 181–194. 22. K. E. Sickafus, J. M. Wills, and N. W. Grimes, J. Am. Ceram. Soc.,
2004, 82, 3279–3292.
23. E. W. Gorter, Saturation Magnetisation and Crystal Chemistry of Ferrimagnetic Oxides, Phillips, 1954.
24. A. R. West, Basic Solid State Chemistry, Wiley-Blackwell, 2nd Edition., 1999.
25. A. Putnis, Introduction to Mineral Sciences, Cambridge University Press, 1992.
26. C. E. Housecroft and A. G. Sharpe, Inorganic chemistry, Pearson, Harlow, England; New York, Fourth Edition., 2012.
27. D. Neagu, Thesis, University of St Andrews, 2013. 28. R. D. Shannon, Acta Crystallogr. A, 1976, A32, 751–767. 29. L. Morozova and V. Popov, Glass Phys. Chem., 2010, 36, 86–91. 30. D. M. Flot and J. T. S. Irvine, Solid State Ion., 2000, 135, 513–
518(6).
31. H. Moriwake, I. Tanaka, F. Oba, Y. Koyama, and H. Adachi, Phys. Rev. B, 2002, 65, 153103.
32. H. Moriwake, S. Watanabe, and K. Ogasawara, Jpn. J. Appl. Phys., 2007, 46, 4175–4178.
33. H. Moriwake, I. Tanaka, F. Oba, Y. Koyama, and H. Adachi, Int. J. Quantum Chem., 2003, 91, 208–210.
34. E. Stefan and J. T. S. Irvine, J. Mater. Sci., 2011, 46, 7191–7197. 35. E. Stefan, P. A. Connor, and J. T. S. Irvine, J. Mater. Chem. A, 2013,
1, 8262.
36. E. Stefan, G. Tsekouras, and J. T. S. Irvine, Adv. Energy Mater., 2013, n/a–n/a.
37. J. Rodríguez-Carvajal, Comm. Powder Diffr. IUCr, 2001, Newsletter 26, 12–19.
38. P. Kovtunenko, Glass Ceram., 1997, 54, 143–148.
39. T. Suzuki, K. Adachi, and T. Katsufuji, J. Magn. Magn. Mater., 2007, 310, 780–781.
40. T. D. McColm and J. T. S. Irvine, Ionics, 2001, 7, 116–121. 41. Sakai, T. Horita, Y. P. Xiong, K. Yamaji, H. Kishimoto, M. E. Brito,