A Study on Development of Balanced Scorecard
for Management Evaluation Using Multiple
Attribute Decision Making
Kwang Mo Yang1, Young Wook Cho2, Seung Hee Choi3, Jae Hyun Park4, Kyoung Sik Kang5
1Department of Industrial Engineering, Yuhan University, Puchoen, Korea; 2Department of Technology & Systems Management, Induk Institute of Technology, Seoul, Korea; 3Department of Industrial & Manufacturing Engineering, Pennsylvania State University, Penn-sylvania, USA.; 4Department of Qualification Trend Analysis, Human Resource Development Service, Seoul, Korea; 5Department of Industrial & Management Engineering, Myongji University, Yongin, Korea.
Email: [email protected]
Received September 22nd, 2009; revised October 12th, 2009; accepted October 20th, 2009.
ABSTRACT
Recently, most businesses have introduced a system for improving their responsibility to the customers in terms of job
improvement. For example, small-quantity batch production increases cost but improve efficiency of management.
Companies have been introduced the balanced scorecard to evaluate their management as part of improvement, while
they suffer from many trials and errors. Many businesses still have difficulty in introducing balance scorecard concept in
their process, but we suggest a method to successfully introduce the balance scorecard. This study aims to suggest a new
performance measurement model reflecting relative importance of the key performance indicators for each factor. Our
model is applied to several companies in real-world to validate the new model. Also, our study proposes a methodology
for an adequate performance measurement using multiple attribute decision making.
Keywords: Balanced Scorecard, Multiple Attribute Decision Making, Management Evaluation
1. Introduction
A large number of small and medium enterprises have realized it is necessary to employ a management evalua-tion system for increasing competitiveness, renovating their business system, and decreasing the cost. Unfortu-nately, the efforts and investment on the system do not seem to lead to the output. Consequently, it is necessary to develop a new methodology for efficient implementation and maintenance of a management evaluation system for reflecting both the department objective and the entire business goal. Balanced Scorecard (BSC) is a deliberately selected balanced set of measures derived from the vision and strategies that represent a tool for leaders to use in communicating strategies to the organization and moti-vating change [1]. Multiple attribute decision making (MADM) is one of the decision making methods to choose the alternative under multiple attributes [2]. If the BSC measuring achievement is applied to MAMD, a business could consider each attribute based on not the each department, but the vision and strategy of the entire business. Thus, this paper will suggest the method using BSC enabling to evaluate a management for insuring
productivity in the real MAMD problem including more alternatives and attribute.
2. Related Work
2.1 Balanced Scorecard (BSC)
A Study on Development of Balanced Scorecard for Management Evaluation using Multiple Attribute Decision Making 269
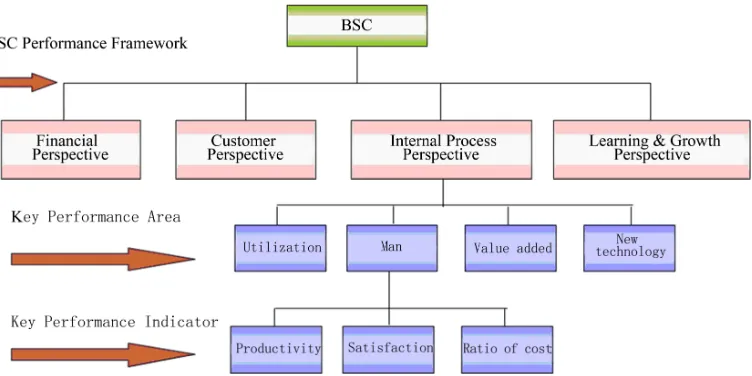
ment of an organization based on financial factors has showed a limitation as a means for delivering informa-tion on the quality and performance of administrainforma-tion. Many researchers have studied performance measure-ment based on financial factors to overcome the limita-tion. Currently, many companies have noted the BSC proposed by Kaplan and Norton [1] and have gradually applied and operated the BSC. For example, the research on the administration performance measurement method and management has been studied, actively, and there were remarkable development. However, the applied area is still limited to human resource organization. In this study, we estimate the weight reflecting the adequate importance of the BSC for lower Key Performance Indi-cators (KPI) (Figure 1) by using a Multiple Attribute Decision Making (MADM) based on the analysis of ad-ministration environments of company. In other words, we consider the weight reflecting practical features and suggest a desirable performance measurement model based on the weight. This study aims to suggest a new performance measurement model reflecting relative im-portance for the KPI for each aspect and apply the new performance measurement model to real business envi-ronment to validate the effect of the new model, identify any limitation, and suggest a methodology for proper performance measurement.
2.2 Multiple Attribute Decision Making (MADM)
Multiple attribute decision making (MADM) is one of the decision making methods to choose the alternative under multiple attributes [3]. An MADM problem could occur when we understand the management situation. Since a number of conflict factors are caused by the lim-ited resources, MADM allows a decision maker to de-termine the factor among the variables with multi-attribute
or the optimal environment to operation situation. To solve an MADM problem with a numerical approach, Barron and Schmidt [4] attempted to solve a problem with distance or fuzzy index. Dyer and Sarin [5], French [6], Haimes and Chankong et al. [7] suggested the inter-active approach to improve the method using multi- objective liner programming. However, it was hard to keep the consistency and to guarantee the optimal solu-tion. Analytic Hierarchy Process (AHP) [8,9] and Elimi-nation Et Choice Translating Reality(ELECTRE) [10] became more complicated because the more attributes, the more coefficient by geometric progression. Cho [3] described the method to determine the optimal plant in the MADM problem having mixed attributes, such as nominal-the-better type, smaller-the-better type, and lar-ger-the-better type. Although the method can not only decide the optimal plant but also solve the MADM hav-ing mixed attributes, it is possible only if each attribute is independent. In this paper, we put the priority on the management variables having the high mean value and the low difference of the weights of a certain factor by experts to understand management situation with Process Capability Index. Thus, we will suggest the method using BSC enabling to evaluate a management for insuring productivity in a real MADM problem including more alternatives and attributes.
3. Management Evaluation Formula
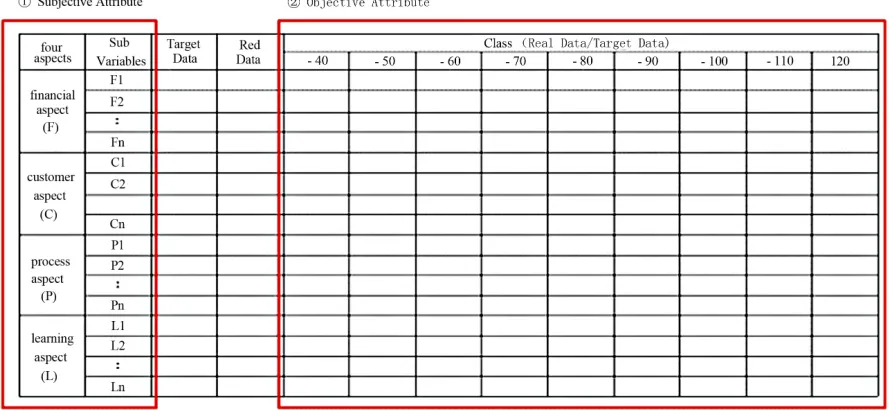
Management evaluation method is based on balanced scorecard with multiple attribute. It is consider the sub-jective and obsub-jective attributes (Figure 2). The objective attributes are the element calculated with the target data and real data observed. The subjective attributes are the sub variables under the basic four aspects in the BSC.
[image:2.595.115.491.515.703.2]The v is defined as decision making matrix, having each
Figure 2. BSC checklist form (per department)
department of m and reconsideration attribute of l con-nected with this as following:
where, Ai = ith department, Xj = jth attribute, xij =
evalua-tion value Xj of for attribute in department Ai.
3.1 Subjective Attribute Formula
3.1.1 Weighted Decision to Each Subjective Attribute It is very difficult to assign the weight to each attribute in an MADM problem. Since last selection crystallization can change according to the weight given, the weight should be assigned, deliberately. In this paper, we decide the weight based on the suggestion of experts, and the method determining the weight could be used for process capacity index. Process capability is the process charac-teristic ability that reflects how identical product can be produce according to manufacturing process established in product design process, which means uniformity of the product. To estimate characteristic ability, various statis-tical methods have suggested. Evaluating process capacity by variables of process and specification limit of product is known as process capacity analysis, and the process capacity analysis can be expressed in terms of process capability index (Cp). The process capability index is
developed based on the concept of 6σ and applied first to industry field.
p 6 6
USL LSL T
C
(1)
For a single specification, the limit is defined as fol-lowing.
For an upper specification, the limit is:
3 p
USL
C
(2)
For a lower specification, the limit is:
3 p
LSL
C
(3)
In this paper, we will use the process capability index for a lower specification limit only. The weight for each attribute is assigned by the data that several experts decide to each attribute. The evaluation data of experts for each attribute is determined by experts scoring from 9 to 1. The mean of data (μ) that experts decide can be calcu-lated. The lower specification limit is 1 that experts de-cided absolute minimum, and the standard deviation that each expert decides is σ which is following.
2
( )
ˆ (p = 1, 2,...., n)
1 jp
b b s
n
(4)
where, bjpis the mean that expert P decided data for each
attribute j. And then, in this paper, we put the priority order on the attribute Xjhaving the high mean value and
A Study on Development of Balanced Scorecard for Management Evaluation using Multiple Attribute Decision Making 271
Equation (4), normalized by Equation (5), and repre-sented as NCp(Normalized Capability Index).
1 2
( ... )
pj pj
p p p
C NP
C C C
i
j
(5)
NCp is defined the weight for each attribute, and the
notation is replaced to w, where, w is under a certain cri-terion, such as following:
1 2
1
1
, ,... , 1
here, /
l
l j
j l
j pi pi
j
w w w w w
w C C
(6)3.2 Objective Attribute Formula
3.2.1 Normalization of Evaluation Value Matrix for Objective Attribute
Evaluation value xij for attribute Xj in each department Ai
is considered as profit attribute or cost attribute by nor-malized step, and the quantitative values of attributes are also normalized in the same intervals. For example, the profit attribute, high preference as evaluation value, is normalized as following:
1 2
/ ( ... ... )
( 1, 2,..., ; 1, 2,..., )
ij ij j j j mj
r x x x xi x
i m j l
(7)
Otherwise, cost attribute, low preference as evaluation value, is normalized as following:
1 2
(1/ ) / [(1/ ) (1/ ) ... (1/ ) ... (1/ ) ( 1, 2,..., ; 1, 2,..., )
ij ij j j j mj
r x x x xi x
i m j l
here,0rij 1 (8)
And then, we can make matrix R as following based on the normalized values.
This paper presents the process of calculation only for the financial aspect factor, and the processes for the rest aspects are regarded identical. If PR(F)i is preference rate
for department i, PR(F)i is weighted mean of attribute for
process i.
1
( )i l j ( )
j
PR F Fw NF i
(9)where,
1
( ) 1 m i i PR F
NF(i)j is the normalized data of department in
finan-cial attribute j. According to the result calculated by Equation (9) for each department, most high preference rate had department select and then if free department is department that had optimum the priority order as fol-lowing:
1 2
maxPR F( )i max(PR F( ) ,PR F( ) ,...,PR F( ) )m (10) In this model, we assume each factor is independent each other. Similarly, the data for customer aspect, in-ternal process aspect, and learning/growing aspect can be estimated. The proposed model has evaluated in a de-partment performance in management environment. The result is applied to the simulated operation of CLV (Cus-tomer Lifetime Value) [11]. The primary evaluation crite-rion is the BSC which consists of financial aspect, cus-tomer aspect, internal process aspect, and learn-ing/growing aspect. Also, in this paper, it will be able to be applied to MADM for deciding weigh of each variable. Therefore, we can summary the step to evaluate data for each department as following:
Step 1) The variables to assign weight are divided into financial aspect, customer aspect, internal process aspect, and learning/growing aspect.
Step 2) The data rank of each decided variable is de-termined by Group Consensus.
Step 3) Find sub-variables in the higher level variables. The sub-variables can be changed by the condition of the enterprise.
Step 4) Assign the weight for each factor by using MADM.
Step 5) Decide total evaluation data for the department by using Equation (11).
( ) ( )
( ) ( )
Total Evaluation Data aPR Fi PR Ci
PR Pi PR Li
(11)
here
0 < α < 1, 0 < β < 1, 0 < γ < 1, 0 < δ < 1 α + β+ γ + δ = 1,
Fi> 0, Pi> 0, Li> 0, Ci> 0
where
α: financial aspest weight β: customer aspect weight γ: internal process aspect weight δ: learning/growing aspect weight
PR(Fi): preference rate of financial aspect PR(Ci): preference rate of customer aspect PR(Pi): preference rate of internal process aspect PR(Li): preference rate of learning/growing aspect
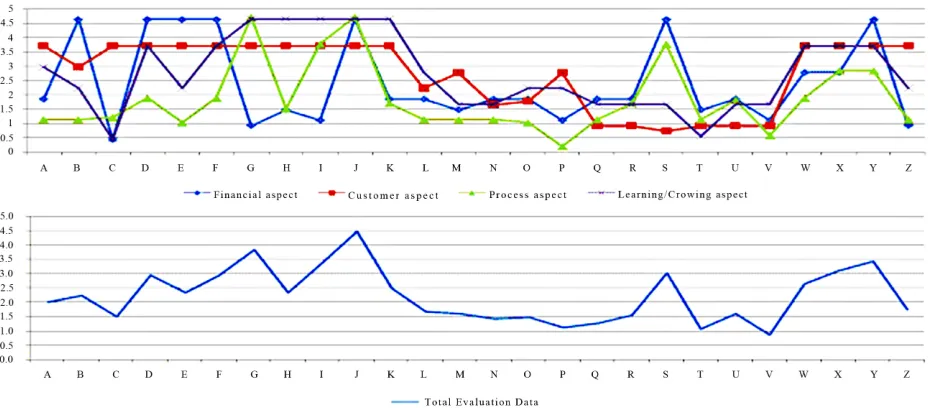
Figure 3. Result of management evaluation data for each department in a company
4. Conclusions
Among the methods to solve multiple attribute decision making with balanced scorecard for management evalua-tion for a department, numerical approaches offer the optimal solution, but fail to reflect the opinions of deci-sion makers and CEO. Besides the current interactive approaches making up for the weak point fail to keep the consistency and to insure the optimal solution since it is hard to consider the entire alternative and attribute, si-multaneously. Moreover, the increase in the number of attributes grows the amount of information due to pair wise comparison between the alternatives. In this paper, we propose the balanced scorecard method to assign the attribute weight by an expert group in the multiple attrib-ute decision making including more alternatives and at-tributes. Also, we suggest the management evaluation method that assigns more weight on the attribute having the high mean weight by experts and the low difference or consensus in the evaluation. The proposed method could contribute to developing a good approach to re-flecting both the optimal solution and the strategy of the entire business.
REFERENCES
[1] R. S. Kaplan and D. P. Norton, “Transforming the balanced scorecard from performance measurement to strategy,” Accounting Horizons, Vol. 15, No. 2, pp. 87–104, 2001. [2] K.-M. Yang, Y.-W. Wook, and J.-H. Park, “A study on
evaluation method for process safety using multiple attribute decision making,” 38th International Conference on CIE, Las Vegas, USA, pp. 2274–2278, 3–6 August 2008.
[3] Y.-W. Cho, “Selecting the optimal preferred facilities with multiple characteristics using Loss Function,” Korea Safety Management & Science, Vol. 2, No. 2, pp. 127–135, 2002.
[4] H. Barron and C. P. Schmidt, “Sensitivity analysis of additive multi-attribute value models,” Operations Research, Vol. 36, pp. 122–127, 1988.
[5] J. S. Dyer and R. K. Sarin, “Measurable multi-attribute value functions,” Operations Research, Vol. 27, No. 4, pp. 810–822, 1979.
[6] S. French, “Decision theory: An introduction to the mathematics of rationality,” Ellis Horwood Series in Mathematics and its Applications, pp. 448, 1986.
[7] Y. Y. Haimes and V. Changkong, “Decision making with multiple objectives,” Lecture Notes in Economics and Mathematical Systems, Springer-Verlag, New York, No. 242, pp. 388–399, 1985.
[8] L. C. Lawrence and C. Dong, “On the efficacy of modeling multi-attribute decision problems using AHP and Sinarchy,” Eurpean Journal of Operational Research, Vol. 132, No. 1, pp. 39–49, 2001.
[9] T. L. Saaty, “A scaling method for priorities in hierarchical structures,” Journal of Mathematical Psychology, Vol. 15, No. 3, pp. 234–281, 1977.
[10] P. T. Harker and L. G. Vargas, “The theory of ratio scale estimation: Saaty’s analytic hierarchy process,” Management Science, Vol. 33, No. 11, pp. 1383–1403, 1987.