Abstract—In this paper an improved method to optimally place the active power conditioners (APCs) in order to power quality enhancement in distribution systems is presented using the discrete firefly algorithm (DFA). An objective function is defined to simultaneously improve voltage profile, to minimize voltage total harmonic distortion and total investment cost. The performance analysis of the proposed DFA is performed in the Matlab software on the modified radial IEEE 16-bus test systems. The obtained results are then compared with the standard firefly algorithm and discrete PSO. The simulation and comparison of results prove that the proposed method is able to precisely determine the optimal location and size of the APCs in radial distribution systems.
Index Terms— Active power conditioner, optimal placement, firefly algorithm, voltage sag
I. INTRODUCTION
mong the power quality disturbances, voltage variation, voltage sag and harmonic distortion are the most important power quality issues that can affect customers, cause interruption in the processing plants and cause financial losses. Up to now, the best solution to mitigate power quality disturbances, especially voltage sag and harmonic distortion and to protect sensitive equipment is to install proper types of custom power devices (CPDs) such as the active power conditioner (APC). CPDs can be installed by an individual customer or a group of customers to mitigate the negative deviations in power quality from the current baseline or enhance the power quality levels [1]. The mitigation option, location, and sizing of the required CPDs should be determined based on economic feasibility, which is a major concern in the selection process and must be optimized.
Since several past decades, several heuristic optimization techniques have been applied to solve the optimal placement and sizing problems of CPDs relative to different objectives and constraint functions. A genetic algorithm (GA)-based optimization technique was used to optimally place a dynamic voltage restorer and a thyristor voltage regulator to
Manuscript received March 15, 2013; revised April 09, 2013. M. Farhoodnea is with Universiti Kebangsaan Malaysia, Bangi, 43100 Malaysia (corresponding author to provide phone: +603-89216590; e-mail: [email protected]).
Azah Mohamed is with Universiti Kebangsaan Malaysia, Bangi, 43100 Malaysia (e-mail: [email protected]).
Hussain Shareef is with Universiti Kebangsaan Malaysia, Bangi, 43100
minimize the total power quality cost due to occurrence of voltage sag [2]. An improved GA method using the niching GA was then developed to explore a wider search space by maintaining the genes’ diversity to decrease the probability of convergence in the local optima [3]. In addition to the CPDs, other devices such as distributed generators and capacitor banks have also been considered to optimally improve the power quality of a system using particle swarm optimization (PSO) [4], combined GA and neural network [5], GA [6] and combined GA and PSO [7]. Considering the discrete nature of the placement and sizing problems, discrete optimization techniques such as the discrete non-linear programming [8] and discrete PSO (DPSO) [9] are also developed to mitigate harmonic distortion and improve power quality using optimal placement of APCs.
In this paper, a developed heuristic optimization technique is presented to determine the optimal size and location of APC using the discrete firefly algorithm (DFA) for general power quality improvement. A multi-criteria objective function is formulated to control the voltage harmonic distortion level, voltage profile of a system and total investment cost. Furthermore, the voltage limits, APC capacity limits, and power flow limits are considered as constraints of the control variables. The performance of the proposed method is then evaluated on the radial IEEE 16- bus test systems using Matlab programming.
II. MODELING OF ACTIVE POWER CONDITIONER
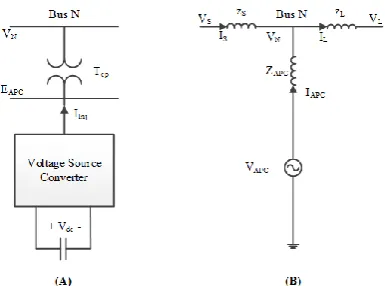
APC is known as a parallel multi-function compensating device, which is able to mitigate various types of power quality disturbances such as voltage sag and harmonic distortion. Fig. 1 shows the schematic diagram of an APC connected to bus N and its Thevenin equivalent circuit. The injected current IAPC at bus N can be expressed as
h APC
h N h APC h
S h N h S h L h S h L h APC
Z V V Z
V V I I I
I (1)
where
IAPC is the injected current by the APC VAPC is the Thevenin voltage
IS is the utility-side current VS is the utility-side voltage IL is the load-side current VL is the load-side voltage
ZS, ZAPC, and h are the utility impedance, APC Thevenin
impedance, and harmonic order, respectively.
Optimum Active Power Conditioner Placement
for Power Quality Enhancement Using Discrete
Firefly Algorithm
Masoud Farhoodnea, Azah Mohamed, and Hussain Shareef
Fig. 1. (A) Schematic diagram of an APC (B) Thevenin equivalent circuit
The effects of APC on the system bus voltages in the fundamental and harmonic frequencies can be calculated by the following equations using the backward/forward sweep method described in [10, 11],
* Im ( )
) ( k i i i k i g i k i rel i k i V jQ P V jI V I I (1) h h h Z I
V (2)
where Vik, Iik, Iirel, and Iiimg are the node voltage at the kth
iteration, equivalent current injection at the kth iteration, and the real and imaginary parts of the equivalent current injection at the kth iteration, respectively. In addition, V, Z
and I are the bus voltage vector, system impedance matrix, and nodal injected current vector in the fundamental and hth harmonic frequency.
It is noted that the values of P and Q in (1) are positive for conventional PQ buses and negative for the installed APC at bus i. Therefore, the bus voltage at bus i in the fundamental and harmonic frequencies, and consequently, the voltage total harmonic distortion (THDV), can be changed by altering
the rating of the installed APC during the optimization process.
III. OPTIMIZATION PROBLEM FORMULATION
The solution to the optimal APC placement problem in this paper aims to improve simultaneously the general power quality of the system and to minimize the investment costs of the APCs. In this sense, the problem is essentially a multi-objective optimization problem where the multi-objective function comprises three subfunctions and two constraints to the control variables as described in following subsections.
A. Objective Functions
Minimization of average voltage deviation
The voltage improvement index of a power system is defined as the deviation of the voltage magnitudes of all the buses from unity. Thus, for a given system, the voltage improvement index for bus i is defined as
i ref i i
dev V V
V (3)
where Vi-ref and Vi are the reference and actual voltages at
bus i, respectively. Therefore, using the summation of
normalized Vdev-i for all buses, the average voltage deviation
in the system in per unit (p.u.) can be expressed as
M V V M i norm i dev avr dev
1(4)
where M is the total number of system buses.
Minimization of average THDV
To control the THDV level of the whole system, the
average of the normalized THDV in the system buses is
considered as M THD THD M i norm i V avr V
1(5)
where THDV-inorm is the normalized THDV in bus i.
Minimization of the total cost of APC
The total cost of an APC, which is composed of the installation and incremental costs [12], can be expressed in terms of the normalized total cost in a polynomial function as max 1 0 2 ) ( Cost C S S C k i i i APC i APC APC
(6)where, CAPC, C0, and SAPC are the normalized total cost, fixed
installation cost and operating range of the APC, respectively.
B. Operational constraints Bus voltage limits
With respect to power quality and system stability considerations, each bus voltage Vi must be maintained
around its nominal value Vi-nom within a permissible voltage
band, specified as [Vi-min, Vi-max], where Vi-min and Vi-max are
the minimum and maximum permissible voltages at bus i,
respectively. These limits can be expressed in terms of an inequality function as
max
min
i i i V V
V (7)
APC capacity limits
Considering that the APC capacity is inherently limited by the energy resources at any given location, the capacity has to be constrained within a permissible band, specified as [SAPC-min, SAPC-max], where SAPC-min and SAPC-max are the
minimum and maximum permissible values of each APC capacity, respectively. These limits can be expressed in terms of an inequality function as
max
min
APC APC APC S S
S (8)
C. Multi-objective function
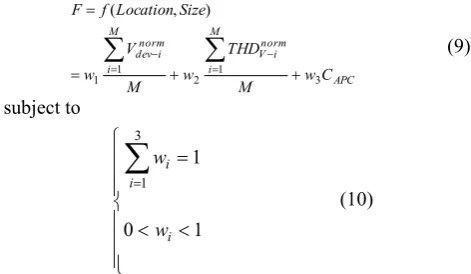
[image:2.595.73.266.63.206.2]APC M i norm i V M i norm i dev C w M THD w M V w Size Location f F 3 1 2 1 1 ) , (
(9) subject to
1 0 1 3 1 i i i w w (10)where wi and M are the relative fixed weight factors assigned
to the individual objectives and total bus number, respectively.
Note that each constraint violation is incorporated in this paper using the penalty function approach. In addition, the weight factors should be assigned to the individual objective functions based on their importance and may vary according to the desired preferences of the power system operators. In this paper, the proper weighting factors used are w1 = w2 = 0.4 and w3 = 0.2, in which the first two objectives are assumed to be equally more important.
IV. FIREFLY ALGORITHM AND ITS APPLICATION A. Standard Firefly Algorithm (SFA)
Firefly algorithm is a novel nature-inspired metaheuristic algorithm that solves the continuous multi-objective optimization problems based on the social behavior of fireflies [13]. It is proven to be a very efficient technique to search for the Pareto optimal set with superior success rates and efficiency compared with the PSO and GA for both continuous and discrete problems [14]. In SFA, two important issues arise, namely, the variation in light intensity
I and the formulation of the attractiveness β. In the simplest form and considering a fixed light absorption coefficient γ, light intensity I, which varies with distance r, can be expressed as
r I0exp( r2)I (11)
where I0 is the light intensity at r = 0.
Considering the firefly’s attractiveness as proportional to the light intensity seen by adjacent fireflies, the attractiveness β can be expressed as
) exp( )
(r 0 r2
(12)
where β0 is the attractiveness at r = 0.
The distance between any two fireflies i and j at xi and xj,
respectively, can be calculated using the Euclidean distance as
D d d j d i j iij x x x x
r , , 2 (13)
where xi,d is the dth component of the spatial coordinate xi of
the ith firefly and D is the dimension of the problem. Therefore, the movement of firefly i to another more attractive (brighter) firefly j can be expressed as
kj ik
i rk i k
i
x
e
x
x
x
ijk
2
0
1 (14)
where α is the randomization parameter and ξi is a vector of
random numbers with Gaussian or uniform distributions.
B. Discrete Firefly Algorithm
The convergence speed and performance of SFA can be enhanced using the logistic sigmoid function to constrain the position of the fireflies [15]. By changing the positions of the fireflies to a more attractive position and decreasing the distance, the probability, S which is given in (15) decreases. When the distance of the fireflies are very far at a specific position, the probability of moving xik in (16) to a new
location xik+1 is very high, whereas by decreasing the
distance in further iterations, the probability of moving xik to
a new location decreases.
k ij r k ij
e
r
S
1
1
)
(
(15)
else r S rand if x x x e x x k ij k i i k i k j r k i k i k ij 0 21 (16)
where S(rijk) is the probability of distance rijk to be one, k is
the iteration number, and rand is a random number in the interval [0,1].
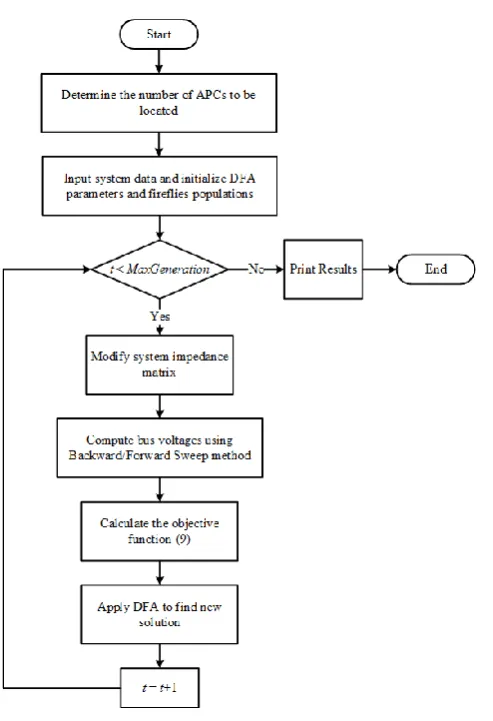
[image:3.595.45.281.52.189.2]The implementation procedure of DFA is described as shown in Fig. 2.
C. Application of DFA in Solving the Optimal Location and Sizing of APC
To solve the optimal location and size of the APC problem in radial distribution systems, DFA is applied to minimize the objective function (9). Initially, the number of APCs and the system specifications, including the bus and line data, should be considered as inputs of the DFA.
The variables for optimization are the location of the APCs and the real and imaginary APC powers at the fundamental and harmonic frequencies. After initializing the locations and sizes of the APCs in terms of the firefly populations, as shown in Fig. 2, the bus voltages in the fundamental and harmonic frequencies in (1) and (2) are obtained using the backward/forward sweep method. The voltage variations and THDV of each bus can be calculated
[image:4.595.309.546.225.380.2]using the computed bus voltages to calculate the objective function (9). Hence, using the obtained result from (9), the fireflies can be ranked to determine the current global solution, and we proceed to the DFA for the next iteration. Fig. 3 shows the schematic diagram of the procedures used in solving the optimal APC placement and sizing problem using the DFA.
Fig. 3. DFA implementation flowchart for APC optimal placement
V. SIMULATION AND RESULTS
To verify the effectiveness and applicability of the proposed DFA on radial distribution systems, the modified IEEE 16-bus test system is used, as shown in Fig. 4 [16]. The system is balanced and composed of several linear and non-linear loads with a total power of 2.73 MVA. In addition, the non-linear loads are modeled as harmonic current sources with the different harmonic spectra given in Table 1 [17]. In addition to the non-linear loads, which distort the voltage and current waveforms of the system, a heavy induction motor is installed at bus 15, which creates voltage variation and voltage sag problems in the system.
Fig. 4. Single line diagram of the IEEE 16-bus test system
TABLE I HARMONIC SPECTRA
Harmonic order
Delta-connected
TCR ASD
Mag. (p.u.)
Ang. (deg.)
Mag. (p.u.)
Ang. (deg.)
1 1.0000 46.92 1.0000 0.00
5 0.0702 -124.40 0.1824 -55.68 7 0.0250 -29.87 0.1190 -84.11 11 0.0136 -23.75 0.0573 -143.56 13 0.0075 71.50 0.0401 -175.58 17 0.0062 77.12 0.0193 111.39 19 0.0032 173.43 0.0139 68.30 23 0.0043 178.02 0.0094 -24.61 25 0.0013 -83.45 0.0086 -67.64 29 0.0040 -80.45 0.0071 -145.46
[image:4.595.49.296.352.713.2] [image:4.595.324.527.434.596.2]TABLE II
OPTIMIZATION RESULTS OF THE 16-BUS TEST SYSTEM
Solver Location (Bus) Rating (p.u.) Total cost (US $)
DPSO 10 9 15 1.018 0.731 1.037 2,297,000
SFA 15 9 10 1.025 0.751 1.028 2,865,000
DFA 9 10 15 0.730 1.043 1.013 2,163,000
From the results shown in Tables 2, the DFA achieves the best performance in determining the optimal location and size of the APCs. In addition, the obtained total APC cost using DFA is significantly smaller than those of the others, which presents a lighter installation and operational burden on utilities for further system development.
To investigate the sensitivity of the proposed method to the randomness of the initial values, the standard deviation (SD) and the mean value are calculated for 35 run times of the algorithm with the optimization method parameters being kept constant. Table 3 shows the obtained SD and the mean value and the comparison with the SFA, SPSO, GA, and DPSO methods.
TABLE III
SDAND MEAN VALUES AT DIFFERENT INITIAL VALUES
16-bus test system
SD (%) Mean Fmax Fmin
DPSO 5.23 0.2932 0.2959 0.2912
SFA 5.76 0.2983 0.3020 0.2971
DFA 5.16 0.2929 0.2957 0.2919
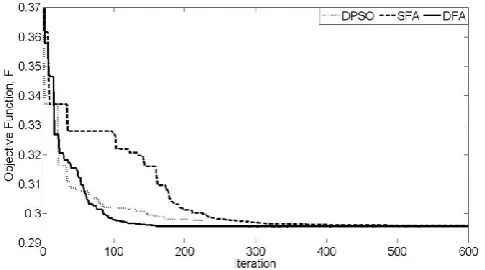
[image:5.595.49.292.586.721.2]The comparison of the reported SD and mean values in Table 3 shows that the proposed DFA-based method has the smallest SD and mean value than the other optimization methods, which proves the higher accuracy and robustness of DFA in solving the optimal placement and sizing problem of the APCs for the 16-bus test system. The convergence characteristics of the DFA for the 16-bus system is shown and compared with those of the other methods in Fig. 5. The figure clearly shows that DFA converges to the final solution in fewer iteration steps compared with the other methods.
Fig. 5. Convergence characteristics in the IEEE 16-bus test system
The voltage profile and THDV level in the 16-bus test
system before and after the optimal APCs placement are measured and shown in Tables 4. After the optimal APC placement, the voltage profile of the system significantly improves, even when a voltage sag with a depth of approximately 16% occurs. In addition, the voltage harmonic distortion of all the system buses is also mitigated to meet the IEEE Std 519 requirements [18].
TABLE IV
SYSTEM PERFORMANCE BEFORE AND AFTER THE APCPLACEMENT
Bus
Bus voltage
(p.u.) THDV (%)
Voltage deviation (%)
Before After Before After Before After 1 1.000 1.000 0.000 0.000 0.000 0.000 2 0.970 1.000 2.969 0.131 3.028 0.014 3 0.940 1.000 6.128 0.263 6.029 0.002 4 0.939 0.999 6.157 0.270 6.141 0.107 5 0.938 0.998 6.139 0.263 6.200 0.163 6 0.938 0.998 6.142 0.263 6.237 0.198 7 0.937 0.998 6.144 0.263 6.270 0.229 8 0.891 1.003 9.598 0.382 10.944 0.329 9 0.889 1.026 13.178 0.508 11.109 2.556 10 0.887 1.040 16.252 1.039 11.308 4.043 11 0.887 1.000 9.633 0.383 11.261 0.048 12 0.887 1.000 9.641 0.384 11.330 0.013 13 0.886 0.999 9.646 0.384 11.376 0.055 14 0.890 1.003 9.605 0.382 11.006 0.274 15 0.848 0.983 10.086 0.390 15.245 1.706 16 0.847 0.982 10.095 0.390 15.323 1.774
VI. CONCLUSION
This paper has presented an improved method to determine the optimal location and size of APCs in distribution systems. The method was based on DFA to solve the problem using a multi-objective function, defined to enhance the voltage profile of the system and to minimize the THDV and the total investment cost. The performance of
the system was analyzed using the Matlab software on the radial IEEE 16- and 34-bus test systems. The results were compared with those of the SFA, SPSO, GA, and DPSO algorithms to verify the superiority of the proposed method over the other methods. The simulation and comparison results proved that the proposed DFA is able to find the most effective location and optimal size of the APCs in radial distribution systems.
REFERENCES
[1] R. Chiumeo and C. Gandolfi, "D-STATCOM control system and operation in a configuration of Premium Power Park," presented at the 14th International Conference on Harmonics and Quality of Power (ICHQP), 2010.
[2] C. S. Chang and Y. Zhemin, "Distributed mitigation of voltage sag by optimal placement of series compensation devices based on stochastic assessment," IEEE Transactions on Power Systems, vol. 19, pp. 788-795, 2004.
[3] Y. Zhang and J. V. Milanovic, "Global Voltage Sag Mitigation With FACTS-Based Devices," IEEE Transactions on Power Delivery, vol. 25, pp. 2842-2850, 2010.
[5] S. Chandrashekhar Reddy and P. Prasad, "Power Quality Improvement of Distribution System by Optimal Placement of Distributed Generators Using GA and NN," in Proceedings of the International Conference on Soft Computing for Problem Solving (SocProS 2011), pp. 257-267.2011.
[6] S. Biswas, S. K. Goswami, and A. Chatterjee, "Optimum distributed generation placement with voltage sag effect minimization," Energy Conversion and Management, vol. 53, pp. 163-174, 2012.
[7] M. Moradi and M. Abedini, "A combination of genetic algorithm and particle swarm optimization for optimal DG location and sizing in distribution systems," International Journal of Electrical Power & Energy Systems, vol. 34, pp. 66–74, 2011.
[8] W. Chang and W. Grady, "Minimizing harmonic voltage distortion with multiple current-constrained active power line conditioners,"
IEEE Transactions on Power Delivery, vol. 12, pp. 837-843, 1997. [9] I. Ziari and A. Jalilian, "Optimal placement and sizing of multiple
APLCs using a modified discrete PSO," International Journal of Electrical Power & Energy Systems, vol. 43, pp. 630-639, 2012. [10] T. Jen-Hao and C. Chuo-Yean, "Backward/Forward Sweep-Based
Harmonic Analysis Method for Distribution Systems," IEEE Transactions on Power Delivery, vol. 22, pp. 1665-1672, 2007. [11] J. Teng, "A network-topology-based three-phase load flow for
distribution systems," Proc Natl. Sci. Counc. ROC (A), vol. 24, pp. 259-264, 2000.
[12] L. Cai, "Robust coordinated control of FACTS devices in large power systems," Ph.D Dissertation, Universität Duisburg-Essen, 2004. [13] X.-S. Yang, "Firefly Algorithm," in Engineering Optimization, ed:
John Wiley & Sons, Inc., 2010, pp. 221-230.
[14] G. Jati, "Evolutionary discrete firefly algorithm for travelling salesman problem," Adaptive and Intelligent Systems, vol. 6943, pp. 393-403, 2011.
[15] M. K. Sayadi, A. Hafezalkotob, and S. G. J. Naini, "Firefly-inspired algorithm for discrete optimization problems: An application to manufacturing cell formation," Journal of Manufacturing Systems,
vol. 32, pp. 78–84, 2012.
[16] M. Farhoodnea, A. Mohamed, H. Shareef, and H. Zayandehroodi, "Power Quality Analysis of Grid-Connected Photovoltaic Systems in Distribution Networks," Przeglad Elektrotechniczny (Electrical Review), vol. 2013-2a, pp. 208-13, 2013.
[17] M. Farhoodnea, A. Mohamed, and H. Shareef, Harmonic Source Localization in Power Systems: Single and Multiple Harmonic Sources, LAP LAMBERT Academic Publishing, 2011.