Abstract—The problem with crude oil depletion has arisen in the last years. There has been intensive research to find out alternative to fossil fuels. The main group is biofuels, produced from crops and wastes. Alcohols are an important category of bio-fuels. Ethanol is a good candidate to be an alternative fuel since it is a liquid and has several physical and chemical properties similar to those of gasoline fuels. That is why this study is aimed to develop the 1-D combustion model of four-stroke spark ignited engine for predicting the effect of various fuel types on engine performances and fuel consumption on various engine operating conditions. AVL Boost was used as a computational fluid dynamics simulation tool to analyze the performance and emissions characteristics for different blends of ethanol and gasoline (by volume).
Index Terms—Engine simulation, alternative fuels, emissions, ethanol blends
I. INTRODUCTION
UELadditives are very important because many of these additives can be added to fuel in order to improve its efficiency and its performance. Some of the most important additives to improve fuel performance are oxygen containing organic compounds (oxygenates). Several oxygenates have been used as fuel additives, such as methanol, ethanol, tertiary butyl alcohol and methyl tertiary butyl ether [1].
Presently, ethanol is a prospective fuel for use in vehicle as an alternative to petroleum based fuels. Ethanol is advocated as the prospective fuel because it can be manufactured from natural products or waste materials, unlike gasoline which is a non-renewable energy resource [2–3]. One of the important features is that the ethanol can be used directly without requiring any major changes in the structure of the engine. Among the various alcohols, ethanol
Manuscript received March 13, 2014; revised March 19, 2014. The present document has been produced with the financial assistance of the European Social Fund under Operational Programme “Human Resources Development”. The contents of this document are the sole responsibility of the “Angel Kanchev” University of Ruse and can under no circumstances be regarded as reflecting the position of the European Union or the Ministry of Education and Science of the Republic of Bulgaria. Project № BG051PO001-3.3.06-0008 “Supporting Academic Development of Scientific Personnel in Engineering and Information Science and Technologies”
S. P. Iliev is with the Department of Internal Combustion Engines, Faculty of Transport, University of Rues “Angel Kanchev”, 8 Studentska Str., 7017 Ruse, Bulgaria (phone: +359-82888-331; e-mail: [email protected]).
is known as the most suitable fuel for spark ignited (SI) engines.
On the combustion characteristics, the auto-ignition temperature and flash point of ethanol are higher than those of gasoline, which makes it safer for transportation and storage. The latent heat of evaporation of ethanol is between three and five times higher than that of gasoline; this makes the temperature of the intake manifold lower, and increases the volumetric efficiency. The heating value of ethanol is lower than that of the gasoline. Therefore, we need 1.6 times more alcohol fuel to achieve the same energy output. The stoichiometric AFR (air–fuel ratio) of ethanol is about 2/3 that of the gasoline, so the required amount of air for complete combustion is lesser for alcohol [4].
There is plenty of literature to various blends of ethanol and gasoline. Palmer [5] studied the effect of using various blend rates of ethanol–gasoline fuels in engine tests. Results indicated that 10% ethanol addition increases the engine power output by 5%, and the octane number can be increased by 5% for each 10% ethanol added. He indicated that 10% of ethanol addition to gasoline could reduce the concentration of CO emissions up to 30%. Bata et al. [6] studied different blend rates of ethanol–gasoline fuels in engines, and found that the ethanol could reduce the CO and UHC emissions to some degree. The reduction of CO emissions are apparently caused by the wide flammability and oxygenated characteristic of ethanol.
Kim et al. [7] estimated that the potential for ethanol production is equivalent to about 32% of the total gasoline consumption worldwide, when used in 85% ethanol in gasoline for a midsize passenger vehicle.
The gasoline engine performance theory linked together with computer modeling of the engine thermodynamics in engine simulations is a great challenge, as the latter make the most complete use of the former and the models used are becoming widespread. Engine modeling is a very large subject, in part because of the range of engine configurations possible and the variety of alternative analytical techniques or sub-models, which can be applied in overall engine models Engine modeling is a fruitful research area and as a result many research laboratories have produced their own engine thermodynamics models with varying degrees of complexity, scope and ease to use [8].
Engine simulation is becoming an increasingly important engineering tool for time and cost efficiency in the development of internal combustion engines (ICEs). Most of results that are obtained by simulation are rather difficult to be obtained experimentally. The use of Computational Fluid Dynamics (CFD) simulations allow researchers to
Developing of a 1-D Combustion Model and
Study of Engine Characteristics Using
Ethanol-Gasoline Blends
Simeon Penchev Iliev,
Member, IAENG
understand flow behavior and quantify important flow parameters such as mass flow rates or pressure drops, provided that the CFD tools have been properly validated against experimental results. For reasons such as the aforementioned, CFD simulations have become a valuable tool in helping both the analysis and design of the intake and exhaust systems of an ICEs. Many processes in the engine are 3-D but it requires greater knowledge and large computational time. Thus simplified 1-D simulation is often used. There are several components that manifest a complex three-dimensional flow behavior, such as turbo machinery or manifolds which cannot be simulated properly by 1-D codes, and thus require viscous, 3-D codes.
Hence, it is a right choice to save computational time by simulating the complex components by means of a 3-D code and modeling the rest of the system with a 1-D code, i.e. the ducts. In this way, a coupling methodology between the 1-D and the 3-D code in the respective interfaces is required, and has become the objective of numerous authors [9–11].
In 1-D simulation, equations for conservation of mass, momentum, and energy are solved in time and in one dimension along the main flow direction in the engine pipes. Additional models, correlations, or measurements are needed in 1-D capturing 3-D phenomena such as flow over valves and combustion [12, 13].
The present paper aims to develop the 1-D combustion model of four-stroke port fuel injection (PFI) gasoline engine for predicting the effect of ethanol–gasoline (E0, E5, E10, E20, E30 and E50) fuel blends on the performance of SI engine. For this purpose, simulation of calibrated gasoline engine model was used as basic operating condition and the laminar burning velocity correlations of ethanol–gasoline fuel blends for calculating the changed combustion duration. The engine performances: torque and specific fuel
consumption were compared and discussed. II. THEORETICAL STUDY
A. Simulation setup
The 1-D engine simulation model is developed by using the software AVL BOOST and has been employed to study the engine performance working on ethanol-gasoline blends.
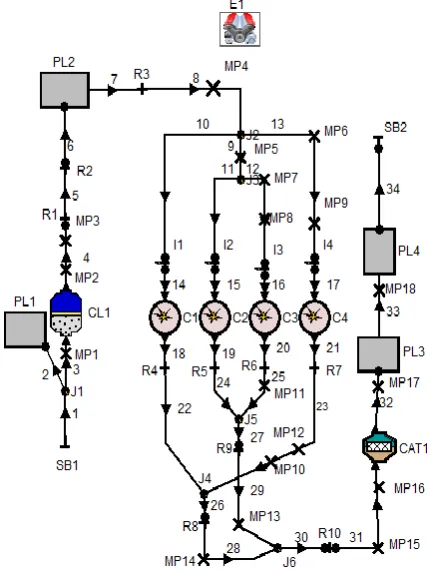
The engine model used in this simulation was performed on a four stroke, four cylinder spark ignition engine with port fuel injection. The gasoline engine model was calibrated by AVL and its layout is shown in Fig. 1 with engine specification shown in Table 1.
The pre-processing step of AVL Boost enable the user to model a 1-Dimensional engine test bench setup using the predefined elements provided in the software toolbox. The various elements are joined by the desired connectors to establish the complete engine model using pipelines.
In Fig.1, E1 represent the engine while C1, C2, C3 and C4 represent the number of cylinders of the engine. MP1 to MP18 represent the measuring points. PL1, PL2, PL3 and PL4 represent the plenum. SB1 and SB2 are for the system boundary. The flow pipes are numbered 1 to 34. CL1 represent the cleaner. R1 to R10 represent flow restrictions, CAT1 represent catalyst and I1 to I4 represent fuel injectors.
B. Combustion Model
For the current study Vibe two zone model was selected for the combustion analysis. This model divides the combustion chamber into unburned and burned gas regions [18]. However the assumption that burned and unburned charges have the same temperature is dropped. Instead the first law of thermodynamics is applied to the burned charge and unburned charge respectively.
. ,
,
d dm h d dm h
d dQ d
dQ d
dV p d
u dm
b BB b BB b u
Wb F
b c b b
[image:2.595.307.535.231.419.2](1)
Fig. 1. Layout of gasoline engine model.
TABLEI ENGINE SPECIFICATION
Engine Parameters Value
Bore (mm) 86
Stroke (mm) 86
Compression ratio 10,5
Connection rod length (mm) 143,5
Number of cylinder 4
Piston pin offset (mm) 0
Displacement (cc) 2000
Intake valve open (deg) Intake valve close (deg)
20 BTDC 70 ABDC
Exhaust valve open (deg) 50 BBDC
Exhaust valve close (deg) 30 ATDC
Piston surface area (mm2) 5809
Cylinder surface area (mm2) 7550
Number of stroke 4
[image:2.595.60.274.466.753.2]. , , d dm h d dm h d dQ d dV p d u dm u BB u BB B u Wu u c u u
(2) where,u
dm
is the change of the internal energy in the cylinder,
d
dV
p
c is the piston work,
d
dQ
Fis the fuel heat input,
d
dQ
Wis wall heat loses,
d
dm
h
bu is the enthalpy flow from the unburned to the burned zone due to the conversion of a fresh charge to combustion products. Heat flux between the two zones is neglected.
d
dm
h
BBBB is the enthalpy due to blow by,
u
andb
in the subscript are unburned and burned gas. In addition the sum of the volume changes must be equal to the cylinder volume change and the sum of the zone volumes must be equal to the cylinder volume..
d
dV
d
dV
d
dV
b
u
(3)
.
V
V
V
b
u
(4)The amount of mixture burned at each time setup is obtained from the Vibe function. For all other terms, like wall heat losses etc., models similar to the single zone models with an appropriate distribution of the two zones are used [19].
C. Emissions Model
The NOx formation model in AVL Boost is based on Pattas and Hafner [19] which incorporates the well known Zeldovich mechanism [20]. The rate of NOx production was estimated by using the following equation (5):
. 1 1 1 0 , 2 4 4 2 1 2 AK r AK r C CrNO PPM KM
(5) where, KM equ NO act NO C C C 1 . . , 3 2 1 2 r r r AK , 6 5 4 4 r r r AK .
In the above equation, PPM
C denotes Post Processing Multiplier, CKM denotes Kinetic Multiplier, C denotes molar concentration in equilibrium and
i
r denotes reactions rates of Zeldovich mechanism.
The NOx formation model in AVL Boost is based on Onorati et al. [21].
C r1 r2 1
rCO Const (6)
where, equ CO act CO C C . .
In the above equation, C denotes molar concentration in equilibrium and
i
r denotes reactions rates based on the model.
In a spark ignition engine the unburned hydrocarbons have different sources. A complete description of their formation process cannot yet be given and definitely the achievement of a reliable predictive model within a thermodynamic approach is prevented by the fundamental assumptions and the requirement of reduced computational times. Nevertheless a phenomenological model which accounts for the main formation mechanisms and is able to capture the HC trends as function of the engine operating parameter may be proposed. The following major sources of unburned hydrocarbons can be identified in spark ignition engines [22]:
1. A fraction of the charge enters the crevice volumes and is not burned since the flame quenches at the entrance.
2. Fuel vapor is absorbed into the oil layer and deposits on the cylinder wall during intake and compression. The following desorption takes place when the cylinder pressure decreases during the expansion stroke and complete combustion cannot take place any more.
3. Quench layers on the combustion chamber wall which are left as the flame extinguishes prior to reaching the walls.
4. Occasional partial burning or complete misfire occurring when combustion quality is poor.
5. Direct flow of fuel vapor into the exhaust system during valve overlap in PFI engines.
The first two mechanisms and in particular the crevice formation are considered to be the most important and need to be accounted for in a thermodynamic model. Quench layer and partial burn effect cannot be physically described in a quasidimensional approach, but may be included by adopting tunable semiempirical correlations.
the piston temperature.
The mass in the crevices at any time is given by equation (7):
. piston crevice crevice
RT M pV
m (7)
In the above equation, mcrevice is the mass of unburned charge in the crevice, p is cylinder pressure,
crevice
V is total crevice volume, M is unburned molecular weight, R gas constant and
piston
T piston temperature.
A second significant source of hydrocarbon is the presence of lubricating oil in the fuel or on the walls of the combustion chamber. In fact, during compression, the fuel vapor pressure increases so, by Henry’s law, absorption occurs even if the oil was saturated during the intake. During combustion the fuel vapor concentration in the burned gases goes to zero so the absorbed fuel vapor will desorb from the liquid oil into the burned gases. Fuel solubility is a positive function of the molecular weight, so the oil layer contributed to HC emissions depending on the different solubility of individual hydrocarbons in the lubricating oil.
The assumptions made in the development of the HC absorption/desorption are the following:
1. The oil film is at the same temperature as the cylinder wall;
2. Fuel is constituted by a single hydrocarbon species, completely vaporized in the fresh mixture;
3. Oil is represented by squalane (C30H62), whose
characteristics are similar to the SAE5W20 lubricant; 4. Traverse flow across the oil film is negligible;
5. Diffusion of the fuel in the oil film is the limiting factor, since the diffusion constant in the liquid phase is 104 times smaller than the corresponding value in the gas phase.
Under these hypotheses the radial distribution of the fuel mass fraction in the oil film can be determined by solving the diffusion equation (8):
0
2 2
r
w
D
t
w
F F(8)
In the above equation, wF denotes mass fraction of the fuel in the oil film, t denotes time,
r
denotes radial position in the oil film (distance from the wall),D
denotes relative (fuel-oil) diffusion coefficient.AVL Boost evaluates the position of the flame front at every time-step and accumulates only HCs that are desorbed into the burned gases, since any HC released into the unburned mixture would be burned by the propagating flame front.
For the current study Vibe two zone model was selected for the combustion analysis. This model divides the combustion chamber into unburned and burned gas regions
III. RESULT AND DISCUSSION
The present study concentrated on the emissions and performance characteristics of the ethanol-gasoline blends. Different concentrations of the blends 0% Ethanol (E0), 5%
Ethanol (E5), 10% Ethanol (E10), 20% Ethanol (E20), 30% Ethanol (E30) and 50% Ethanol (E50) by volume were analyzed using AVL BOOST at full load conditions for the speeds ranging from 1000 - 6500 rpm in the steps of 500 rpm. The results are divided into different subsections based on the parameter analyzed.
A. Engine performance characteristics
The results of the brake power, torque, and specific fuel consumption for ethanol gasoline blended fuels at different engine speeds are presented here.
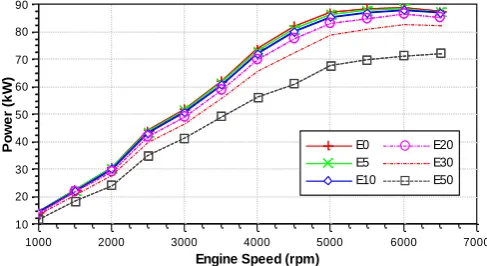
Fig. 2 shows the influence of ethanol gasoline blended fuels on engine brake power.
The brake power is one of the important factors that determine the performance of an engine. The variation of brake power with speed was obtained at full load conditions for E5, E10, E20, E30, E50 and pure gasoline E0 using the CFD results. When the ethanol content in the blended fuel was increased, the engine brake power decreased for all engine speeds. The brake power of gasoline was higher than those of E5-E50 for all engine speeds. The heat of evaporation of ethanol is higher than that of gasoline, providing air-fuel charge cooling and increasing the density of the charge. Adding ethanol to blended fuel causes the equivalence ratio of blended fuel approaches to stoichiometric condition which can lead to a better combustion. On the other hand, the ethanol heating value is lower than that of gasoline and it can be neutralize the previous positive effects. As a result, a lower power output isobtained.
Fig. 3 shows the influence of ethanol gasoline blended fuels on engine torque. The increase of ethanol content (E5-E50) decreased the torque of the engine. The brake torque of
10 20 30 40 50 60 70 80 90
P
o
w
e
r
(k
W
)
1000 2000 3000 4000 5000 6000 7000
Engine Speed (rpm)
E0 E5 E10
[image:4.595.308.552.196.329.2]E20 E30 E50
Fig. 2. Influence of ethanol gasoline blended fuels on engine brake power.
100 110 120 130 140 150 160 170 180
T
o
rq
u
e
(N
.m
)
1000 2000 3000 4000 5000 6000 7000
Engine Speed (rpm)
[image:4.595.309.556.593.732.2]E0 E5 E10 E20 E30 E50
gasoline was higher than those of E5-E50.
Because of the existence of oxygen in the ethanol chemical component, and the increase of ethanol, lean mixtures are produced that decrease equivalence air-fuel ratio to a lower value and due to the presence of oxygen which has entered the combustion chamber makes the burning more efficient.
Fig. 4 indicates the variations of the BSFC for ethanol gasoline blended fuels under various engine speeds. As shown in this figure, the BSFC increased as the ethanol percentage increased. The reason It is well known that heating value and stoichiometric air-fuel ratio are the smallest for these two fuels which means that for specific air-fuel equivalence ratio, more fuel is needed. The highest specific fuel consumption is obtained at E50 ethanol-gasoline blend.
Also, a slight difference exists between the BSFC when using gasoline and when using ethanol gasoline blended fuels (E5, E10 and E20). The lower energy content of ethanol gasoline blended fuels causes some increment in BSFC of the engine when it is used without any modification.
B. Engine emissions characteristics
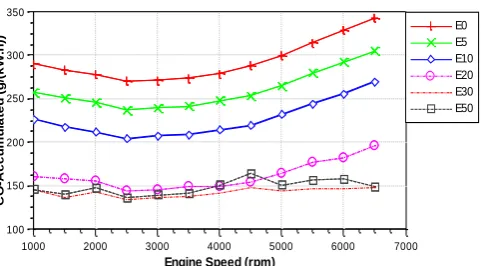
The effect of the ethanol gasoline blends on CO emissions for different engine speeds is shown in Fig. 5. It can be seen that when ethanol percentage increases, the CO concentration decreases. This can be explained by the enrichment of oxygen owing to the ethanol, in which an increase in the proportion of oxygen will promote the further oxidation of CO during the engine exhaust process. Another significant reason for this reduction is that ethanol
(C2H5OH) has less carbon than gasoline (C8H18).
The effect of the ethanol gasoline blends on HC emissions for different engine speeds is shown in Fig. 6. It can be seen that when ethanol percentage increases, the HC concentration decreases. The concentration of HC emissions decreases with the increase of the relative air-fuel ratio. The reason for the decrease of HC concentration is similar to that of CO concentration described above.
The effect of the ethanol gasoline blends on NOx emissions for different engine speeds is shown in Fig. 7. It can be seen that when ethanol percentage increases, the NOx concentration increase. When the combustion process is closer to stoichiometric, flame temperature increases, therefore, the NOx emissions are increased.
IV. CONCLUSION
The present chapter demonstrates the influences of ethanol addition to gasoline on SI engine performance and emission characteristics.
Ethanol gasoline blended fuels show lower brake power and brake torque and higher BSFC than those of gasoline.
When ethanol percentage increases, the CO and HC concentration decreases.
Ethanol gasoline blends the significant increase NOx emissions with the increase of ethanol percentage. When the combustion process is closer to stoichiometric, flame temperature increases, therefore, the NOx emissions are increased.
280 300 320 340 360 380 400 420 440
B
SF
C
(g
/(k
W
.h
))
1000 2000 3000 4000 5000 6000 7000
Engine Speed (rpm)
E0 E5 E10
E20 E30 E50
Fig. 4. Influence of ethanol gasoline blended fuels on brake specific fuel consumption.
100 150 200 250 300 350
C
O
-A
c
c
u
m
u
la
te
d
(g
/(k
W
.h
))
1000 2000 3000 4000 5000 6000 7000
Engine Speed (rpm)
[image:5.595.308.553.66.210.2]E0 E5 E10 E20 E30 E50
Fig. 5. Influence of ethanol gasoline blended fuels on CO emissions.
0.8 1 1.2 1.4 1.6 1.8 2 2.2 2.4 2.6 2.8
H
C
-A
c
c
u
m
u
la
te
d
(g
/(k
W
.h
))
1000 2000 3000 4000 5000 6000 7000
Engine Speed (rpm)
E0 E5 E10
[image:5.595.44.288.154.294.2]E20 E30 E50
Fig. 6. Influence of ethanol gasoline blended fuels on CO emissions.
0 1 2 3 4 5 6 7 8 9
N
O
x
-A
c
c
u
m
u
la
te
d
(g
/(k
W
.h
))
1000 2000 3000 4000 5000 6000 7000
Engine Speed (rpm)
E0 E5 E10 E20 E30 E50
[image:5.595.305.549.333.469.2] [image:5.595.50.291.534.667.2]ACKNOWLEDGMENT
We are also eternally grateful to AVL-AST, Graz, Austria for granting use of AVL-BOOST under the university partnership program.
REFERENCES
[1] M. Al-Hasan, “Effect of ethanol-unleaded gasoline blends on engine performance and exhaust emission.” Energy Conversion and
Management, 44: 1547–1561, 2003
[2] CS. Chen, PSC. Rao, JJ. Delfino, “Oxygenated fuel induced to solvent effect on the dissolution of polynuclear aromatic hydrocarbons from contemned soil.” Chemosphere, 60: 1572–82, 2005
[3] MS. Rocha, JRS. Moriera, “A simple impedance method for determining ethanol and regular gasoline mixtures mass content” Fuel, 84: 447–52, 2005.
[4] A. Pikunas, S. Pukalskas, J. Grabys, “Influence of composition og gasoline-ethanol blends on parameters of internal combustion engines.” Journal of KONES Internal Combustion Engines, vol. 10, 3-4, 2003.
[5] F. Palmer, “Vehicle performance of gasoline containing oxygenates. International conference on petroleum based and automotive applications.” Institution of Mechanical Engineers Conference Publications, MEP, London, UK, pp. 33–46, 1986.
[6] R. M. Bata, A.C. Elord, R. W. Rice, “Emissions from IC engines fueled with alcohol–gasoline blends: a literature review.” Transactions of the ASME 111, 424–431, 1989.
[7] S. Kim, B.E. Dale, “Global potential bioethanol production from wasted crops and crop residues.” Biomass and Bioenergy, Vol.26, No.4, pp. 361-375, 2004
[8] A. Shamekhi, N. Khtibzade and AH. Shamekhi, Performance and emissions characteristics of a bi-fuel SI engine fueled by CNG and gasoline. ASME paper, ICES2006-1387, 2006.
[9] A.M. Pourkhesalian, A.H. Shamekhi, and F. Salimi, “Alternative fuel and gasoline in an SI engine: A comparative study of performance and emissions characteristics,” Fuel, vol. 89, 2010, pp. 1056 – 1063, 2010.
[10] H. Chum and R. Overend, “Biomass and renewable fuels.” Fuel
Processing Technology, vol. 71, pp. 187-195
[11] K. Egebäck, M. Henke, B. Rehnlund, M. Wallin and R. Westerholm, “Blending of Ethanol in Gasoline for Spark Ignition Engines – Problem Inventory and Evaporative Measurements”, Rapport MTC 5407, May 2005.
[12] S. Iliev, K. Hadjiev, “Analysis of engine speed effect on the four stroke GDI engine performance” Proceedings in Manufacturing Systems, vol. 7, pp. 229-234, 2012
[13] A. Onorati, G. Montenegro and G. D’Errico, “Prediction of the attenuation characteristics of IC engine silencers by 1-D and multi-D simulation models,” SAE Technical Paper Series 2006, Tech. Rep. 2006-01-1541, doi:10.4271/2006-01-1541, 2006
[14] G. Montenegro and A. Onorati, “Modeling of silencers for IC engine intake and exhaust systems by means of an integrated 1D-multiD Approach,” SAE International Journal of Engines 1 (1), 466, doi:10.4271/2008-01-0677, 2009
[15] G. Montenegro, A. Onorati, F. Piscaglia, G. D’Errico, “Integrated 1D-Multi-D Fluid Dynamic Models for the Simulation of ICE Intake and Exhaust Systems,” SAE Technical Paper Series 2007, Tech. Rep. 2007-01-0495, doi:10.4271/2007-01-0495, 2007
[16] F. Lindström, H.E. Ångström, G. Kalghatgi, and C.E. Möller, “An Empirical SI Combustion Model Using Laminar Burning Velocity Correlations,” SAE2005-01-2106, 2005.
[17] H. Bayraktar, and O. Durgun, “Development of an empirical correlation for combustion durations in spark ignition engines,”
Energy Conversion and Management, vol.45, pp. 1419 – 1431, 2004.
[18] J. B. Heywood, Internal combustion engine fundamentals, McGraw-Hill, 1988
[19] AVL List Gmbh, AVL Boost – Theory, 2013
[20] C. T. Bowman, “Kinetics of pollutant formation and destruction in combustion.” Progress in energy and combustion science, 1(1), 33-45, 1975
[21] A. Onorati, G. Ferrari, G.D’Errico, “1D Unsteady Flows with Chemical Reactions in the Exhaust Duct-System of S.I. Engines: Predictions and Experiments,” SAE Paper No. 2001-01-0939.
[22] G. D'Errico, G. Ferrari, A. Onorati, and T. Cerri, “Modeling the Pollutant Emissions from a S.I. Engine,” SAE Paper No. 2002-01-0006, 2002