Other uses, including reproduction and distribution, or selling or
licensing copies, or posting to personal, institutional or third party
websites are prohibited.
In most cases authors are permitted to post their version of the
article (e.g. in Word or Tex form) to their personal website or
institutional repository. Authors requiring further information
regarding Elsevier’s archiving and manuscript policies are
encouraged to visit:
Environmental tobacco smoke in designated smoking areas in the hospitality
industry: Exposure measurements, exposure modelling and policy assessment
A. McNabola
⁎
, G.J. Eyre, L.W. Gill
Dept. of Civil, Structural & Environmental Engineering, Trinity College Dublin, Ireland
a b s t r a c t
a r t i c l e i n f o
Article history:
Received 15 September 2011 Accepted 25 January 2012 Available online 22 February 2012
Keywords:
ETS Smoking Smoking areas Tobacco control Personal exposure Benzene
Tobacco control policy has been enacted in many jurisdictions worldwide banning smoking in the workplace. In the hospitality sector many businesses such as bars, hotels and restaurants have installed designated smoking areas on their premises and allowance for such smoking areas has been made in the tobacco control legislation of many countries. An investigation was carried out into the level of exposure to environmental tobacco smoke (ETS) present in 8 pubs in Ireland which included designated smoking areas complying with two different definitions of a smoking area set out in Irish legislation. In addition, ETS exposure in a pub with a designated smoking area not in compliance with the legislation was also investigated. The results of this investigation showed that the two differing definitions of a smoking area present in pubs produced similar concentrations of benzene within smoking areas (5.1–5.4μg/m3) but differing concentrations within the ‘smoke-free’areas (1.42–3.01μg/m3). Smoking areas in breach of legislative de
finitions were found to produce the highest levels of benzene in the smoking area (49.5μg/m3) and‘smoke-free’area (7.68μg/m3). 3D exposure
modelling of hypothetical smoking areas showed that a wide range of ETS exposure concentrations were possible in smoking areas with the samefloor area and same smoking rate but differing height to width and length to width ratios. The results of this investigation demonstrate that significant scope for improvement of ETS exposure concentrations in pubs and in smoking areas may exist by refining and improving the legislative definitions of smoking areas in law.
© 2012 Elsevier Ltd. All rights reserved.
1. Introduction
Environmental Tobacco Smoke (ETS) has been defined as the smoke which non-smokers are exposed to while in an indoor environment with smokers (McNabola et al., 2006). ETS has been declared by the world health organisation and many other independent research studies as carcinogenic (OTC, 2002; WHO, 2003). This environmental pollutant has been shown to be responsible for premature death and disease in children and adults who do not smoke but are passively exposed to ETS (Repace and Lowery, 1985). ETS exposure has been shown to in-crease population respiratory symptoms by 30–60% and it is well estab-lished that ETS is associated with cardiovascular disease (Meyers and Neuberger, 2009). ETS exposure has been associated with a 31% increase in the risk of AMIs compared with a doubling of the risk associated with direct smoking (Barnoya, 2005). ETS has also been shown to have ad-verse effects on reproduction and cot death in children (OTC, 2002).
ETS has been shown to comprise a mixture of over 4000 chemical including toxic substances such as acetone, hydrogen cyanide, ammo-nia, formaldehyde, benzene, 1,3 butadiene and many more (Baker and Proctor, 1990; Nelson et al., 1998). Epidemiological evidence
has shown that ETS exposure causes an increased risk of cancer of 20–30%, an increased risk of heart disease of 25–30%, an increased risk of strokes of up to 82% and an increased risk of other non-fatal re-spiratory illnesses (Bates and Fawcett, 2002). In addition, the risk of the above ailments have been shown to be even higher for staff and patrons of bars, restaurants, nightclubs and other hospitality outlets, as these can be a unique group exposed to extreme levels of ETS (McNabola et al., 2006; Mulcahy et al., 2005; Repace, 2004).
The evidence of such high levels of ETS in hospitality venues and ETS exposure in the workplace have prompted governments around the world to introduce smoking bans and other tobacco control poli-cies in order to reduce its environmental health impact (Clancy, 2009). Tobacco control policy has been an evolving area of public health protection from as early as the 1930 and 1940s (Clancy, 2009; McNabola and Gill, 2009) and modern tobacco control policy has been introduced in many jurisdictions banning smoking in the workplace including hospitality venues. These policy measures have been shown to have positive impacts on the levels of ETS exposure, smoking prevalence, reduction in cigarette sales volumes and reduc-tions in tobacco related deaths and illness (McNabola and Gill, 2009). Exposure to markers of ETS in numerous bars in the UK and Ireland have shown falls of over 90% of pre-ban levels following the introduc-tion of smoking bans (Donnelly and Whittle, 2008; McNabola et al., 2006; Mulcahy et al., 2005). Smoking prevalence has been shown to ⁎Corresponding author. Tel.: + 353 01 896 3837; fax: + 353 1 677 3072.
E-mail address:amcnabol@tcd.ie(A. McNabola).
0160-4120/$–see front matter © 2012 Elsevier Ltd. All rights reserved. doi:10.1016/j.envint.2012.01.012
Contents lists available atSciVerse ScienceDirect
Environment International
fall by 9–12% across various jurisdictions while cigarette sales volumes were also shown to decrease by 7–11% following the introduction of a smoking ban (McNabola and Gill, 2009). Hospital admissions for acute myocardial infarctions (AMI) have shown reductions of 27–40% in the United States and of 17% in Europe (McNabola and Gill, 2009).
In general terms, over the past 60 years, a significant body of evi-dence on the dangers of tobacco use and ETS has been established and progress has been made in the control of tobacco. Thefirst global health treaty, the WHO Framework Convention on Tobacco Control (FCFC), was established recognising the global tobacco epidemic and setting standards for participating countries to effect its control (WHO, 2003). Article 8 of the FCFC relating to protection from exposure to tobacco smoke arises from the recent success of workplace bans on smoking across various jurisdictions (Clancy, 2009). Built into many such tobacco control policies has been an allowance for the provision of a designated smoking area on work premises. These designated smoking areas have been included to provide smokers with a controlled area within which smoking is permitted, providing protection against ETS exposure amongst non-smokers while being respectful of an individual's right to smoke should they wish to do so. As such, legislation has set out varying definitions of designated smoking areas (DSA) to which employers must adhere.
This paper presents an investigation of DSA policy in tobacco control legislation. DSAs tobacco control policy in various jurisdictions was reviewed in terms of its potential impacts on ETS exposure. Concentra-tions of ETS exposure in differing legislative definitions of DSAs in Irish pubs were measured and compared with levels of ETS exposure in the
‘smoke free’areas of these pubs. Computationalfluid dynamics (CFD) modelling was also carried out to examine the dispersion of ETS in dif-ferent hypothetical DSAs. The results of this investigation demonstrate the impact of DSAs with differing geometries on ETS exposure among non-smokers and produces recommendations for improvements in global DSA tobacco control policy.
2. Legislative background and review
DSAs, once they adhere to definitions set out in legislation, are zones within the workplace that are exempt from a ban on smoking because they are deemed to be open to natural ventilation to such an extent that they are considered to be effectively outdoors. There-fore the hypothesis behind a legal DSA is that the natural dispersion which occurs in outdoor environments is replicated in a DSA and hence levels of ETS exposure cannot reach the dangerously high values of an enclosed indoor environment.
2.1. Irish DSA legislation
The definition of a DSA under Irish tobacco control legislation (Irish Government, 2004) includes two forms, Type I and Type II. A Type I DSA refers to“a place or premises, or a part of a place or premises that is wholly uncovered by any roof, whetherfixed or movable”. A Type II DSA refers to“an outdoor part of a place or premises covered by a fixed or movable roof, provided that not more than 50% of the perimeter of that part is surrounded by one or more walls or similar structures (in-clusive of windows, doors, gates or other means of access to or egress from that part)”.
2.2. Review of Irish DSA legislation
A Type I smoking area is a setting that has no roof cover but can be surrounded by cover (e.g. walls) up to and including all sides. The legis-lation regarding this type of DSA stipulates no other design require-ment, other than having no roof, and importantly makes no constraint on the height of cover that can be provided in relation to thefloor area of the DSA. This ambiguity makes it possible for a workplace to con-tain a legal DSA with no roof, surrounded an all sides by high walls (e.g.
the internal courtyard of a building) such that the height to width ratio (H/W) of the DSA is large.
Significant research efforts have focused on the dispersion of air pollutants in outdoor environments which are enclosed by solid boundaries on one or more sides such as the common feature of urban street canyons. It is widely reported that the H/W ratio of the surrounding boundaries in these environments has a major influence on the levels of air pollutants at ground level and that a large H/W ratio can result in high concentrations of pollutants at ground level (Li et al., 2007; McNabola, 2010; Tiwary et al., 2011). A DSA with a large H/W ratio replicates the urban street canyon scenario and may in effect be a more restrictive environment in terms of dispersion, due to the likely smaller width in comparison to most urban streets. A Type II smoking area is a setting that has a roof but can only pro-vide side cover for up to 50% of the perimeter of the DSA. The legisla-tion in this case is such that it is possible to construct an almost entirely enclosed space while still satisfying legal requirements. As il-lustrated inFig. 1it is possible to construct a type II DSA with less than 50% of its perimeter under a roof being covered while maintain-ing an almost entirely enclosed space within the DSA. This is due to the lack of any constraints in legislation on the ratio between the plan width and length of the DSA.
The length to width (L/W) ratio of a DSA regardless of the type is also clearly an important factor in the likely level of ETS exposure present at ground level. The potential impacts of this ambiguity in the legislative definitions of DSAs are examined in the numerical modelling section of this paper.
Irish tobacco control policy in relation to DSAs is reviewed in relation to a number of examples of such policy in other jurisdictions following the experimental and numerical analysis of Irish DSAs in the following sections.
3. Methodology
This study comprised investigations in a number of key areas re-lating to DSAs: a review of DSAs in Irish tobacco control legislation as outlined above; followed by an experimentalfield measurement campaign of ETS exposure in the DSA and‘smoke free’areas of a num-ber of pubs in Dublin, Ireland. Finally a numerical modelling investi-gation of the dispersion of ETS in differing hypothetical DSAs was also completed.
3.1. Field measurements
[image:3.595.316.559.579.746.2]Air quality samples of known markers of ETS, benzene and 1,3 bu-tadiene (Aquilina et al., 2010; Hodgson et al., 1996), were recorded in a number of pubs in Dublin city centre. Samples were recorded during
times representative of busy periods, namely 8–10 pm on Tuesdays and Wednesdays coinciding with popular televised sporting events and 10 pm–1 am on Thursday and Friday evenings, typically busy pe-riods in the Dublin region. Nine pubs in total were sampled, four of which (Pubs A to D) had Type I DSAs and four of which (Pubs E to H) had Type II DSAs. The last location Pub X was chosen as a control to demonstrate the level of ETS concentrations in an entirely enclosed space with no mechanical ventilation. As such Pub X had an illegal DSA located in an enclosedfire escape corridor adjoined to the side of the premises with no mechanical ventilation.
Sampling in each of the nine pubs was carried out simultaneously in both the DSA and the‘smoke-free’area of the pub for comparison purposes. Samples were recorded over 30 minute periods in line with the definition of a habitual smoker, i.e. over the course of each 30 minute sample each habitual smoker in the pub will have smoked 1 cigarette (Repace, 2004). Samples were taken inside the‘ smoke-free’ part of the pub at locations representative of where the pub staff spent most of their time working. Samples taken inside the DSAs were carried out in a location closet to the highest level of smoking activity and as most patrons in the DSAs did not avail of the seating, samples were also recorded while standing to repre-sent the respiratory level of most of the smoking areas users. In total 18 samples of ETS were recorded across the 9 locations chosen.
3.2. ETS sample collection and analysis
ETS samples were collected using an SKC universal pump and Vac-U-Chamber containing SKC Tedlar 1 litre sampling bags. This method of sampling was developed specifically for mobile sampling of volatile organic compounds in ambient air and has been successfully used in a number of similar ETS personal exposure studies to date (McNabola et al., 2006). This method of VOC sampling operated by connecting the 1 litre bag sample to the outside environment in a sealed vacuum chamber from which air was drawn out of by the universal pump. As a result of the chamber being evacuated, the sampling bag inside filled with ambient air at a constantflow rate. Theflow rate was set at the start of each sample so that the sampling bag was at least 50% full at the end of each sample (400 ml of sample are required for analysis). The sampling inlet was placed in the breathing zone of the pub patron and all samples were analysed within a 12 hour peri-od to avoid degradation of the sample. Air samples recorded using this technique provide a mean concentration of air pollutants across the duration of the sampling period.
Gas Chromatography (GC) of the air samples was carried out using a Perkin Elmer ozone precursor monitoring system. The system com-prised an Autosystem GC containing two capillary columns and two flame ionisation detectors (FIDs); an automatic thermal desorption unit (ATD 400) complete with sampling accessory and controlling hardware and software as well as analysis software. Helium was used as the carrier gas, while the combustion of the sample in the FIDs was achieved using zero air and hydrogen. The sample vessels were prepared prior to sampling by repeatedly flushing with zero air (up to 15 times) followed by evacuation and sealing. The analysis system was calibrated on a weekly basis throughout the sampling period using a calibration gas containing known quantities of VOCs produced and certified by the UK National Physics Laboratories. This monitoring laboratory has previously been used in the analysis of VOCs for variousfixed site and personal exposure studies (McNabola et al., 2006). The particular VOCs analysed for data collection were ben-zene and 1,3 butadiene established markers of ETS.
In addition to ETS concentration data, the smoker density in each DSA was recorded during each sampling period. This was carried out by recording the mean number of actively smoking cigarettes during the sampling duration divided by thefloor area of the DSA.
3.3. Numerical modelling of DSAs
[image:4.595.300.554.534.678.2]Following the review of legislation and the results of the experi-mental measurements, the computationalfluid dynamics (CFD) soft-ware Fluent 6.3 was used to investigate the dispersion of ETS in Type I DSAs. This was carried out to demonstrate the potential variation in ETS exposure concentrations present in DSAs with varying H/W ratios (H/W = 1.0 and 2.0) and L/W ratios (L/W = 1.0 and 2.0).Fig. 2and Table 1outline the geometrical layout and variation in dimensions used in the 3D models of the Type I DSAs. In each case the emission of ETS was simulated by the release of benzene from the surface area of thefloor at a constant rate of 1×10⁻⁸kmol/m3. This emission rate was kept constant in each of the four numerical models to facilitate an equal comparison between the geometrical variations with realistic exposure concentration predictions at breathing level. Due to the numerous geo-metric permutations possible for Type II DSAs and for conciseness, Type II DSAs were not included in the numerical modelling.
Virtual models of the hypothetical Type I DSAs were constructed as a volume of air surrounded on all sides by walls but with an open roof. The turbulentflow of air over the roof and in the confines of the DSAs was simulated using the renormalised group (RNG)k–ε model. The RNG k–ε model was derived from the instantaneous Navier–Stokes equations using a rigorous statistical technique termed renormalisation group theory (Choudhury, 1993). This method of modelling turbulence was chosen over the standardk–εmodel as the effects of swirl on turbulence are included in the RNG model, en-hancing accuracy for swirlingflows inherent in partially enclosed en-vironments such as Type I DSAs (Ansys, 2006).
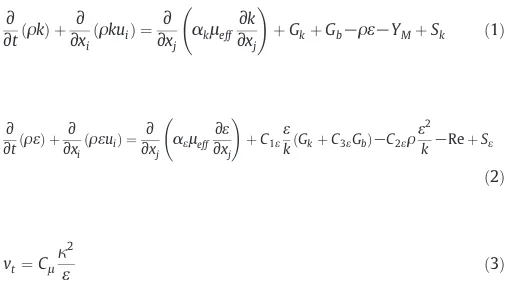
Thek–εgroup of models has been widely used for numerical in-vestigations of urban street canyons and the dispersion of exhaust plumes (Ning et al., 2005) and are similarly suitable for the simula-tion of airflow in this scenario. Thek–εmodel is a semi-empirical two equation model where expressions for the turbulent kinetic en-ergy,k, and the turbulence dissipation rate,ε, are solved. The values ofkandεare then used to solve a single equation for the turbulent velocity,vt. The RNGk–εmodel has a similar form to the standard k–εmodel as shown in Eqs.(1) and (2)for the turbulent kinetic ener-gy and turbulent dissipation rate respectively. The turbulent velocity is then calculated according to Eq.(3). Many of the uncommon terms in the following equations are defined in theNotationsection at the end of this paper.
∂ ∂tð Þ þρk
∂ ∂xi
ρkui ð Þ ¼ ∂
∂xj
αkμeff∂k ∂xj !
þGkþGb−ρε−YMþSk ð1Þ
∂ ∂tð Þ þρε
∂ ∂xi
ρεui ð Þ ¼ ∂
∂xj
αεμeff∂x∂ε j !
þC1εε
kðGkþC3εGbÞ−C2ερε 2
k−ReþSε ð2Þ
vt¼Cμκ
2
ε ð3Þ
source terms, originating from the turbulent kinetic energy and dissi-pation rate of the incoming airflow across roof level in this case.
Gk¼−ρu 0 iu
0 j
∂uj
∂xi ð
4Þ
Gb¼βgiμt Prt
∂T
∂xi ð
5Þ
YM¼2ρε k
c2 ð6Þ
The constantsCμ,C1ε,C2ε,σkandσεhave been determined in labora-tory experiments by previous investigators and are generally accepted as the following:Cμ= 0.09,C1ε= 1.44,C2ε= 1.92,σk=1.00 andσε= 1.30 (Launders and Spalding, 1972). The transport and dispersion of benzene in the turbulent airflow was predicted using Eq.(7), the species transport model. This was done by solving conservation equations for chemical species, local mass fractions of chemical speciesYiare predicted by the solution of a diffusion convention equation for theith species as shown below.
∂
∂tðρYiÞ þ∇⋅ ρ υ
→
Yi
¼−∇⋅JiþRiþSi ð7Þ
WhereRiis the net rate of production of the speciesiby chemical re-action (zero in this case),Siis the rate of creation from the dispersed phase plus any user defined sources (such as ETS emissions from ground level).Yiis the local mass fraction of the chemical speciesi,Ji is the diffusionflux,∇is the gradient and→υ is the velocity offlow. The four DSA models created for numerical analysis were examined under a varying wind speed at roof level (2.5 to 10 m/s, the typical
range of wind velocity in Dublin) and the mean predicted concentration of benzene at breathing level was monitored. The resulting numerical models and data enabled a comparison of ETS dispersion in differing configurations of Type I DSA.
4. Results
4.1. Field measurements
The results of thefield measurement campaign are summarised inTable 2. The mean concentrations of benzene in Type I and Type II DSAs were 5.11μg/m3
and 5.42μg/m3
respectively, while the mean concentrations of 1, 3 butadiene in Type I and Type II DSAs were 3.56μg/m3
and 4.46μg/m3
respectively. Comparing thesefi g-ures it can be seen that the mean concentrations of both benzene and 1,3 butadiene in both DSA types were similar. The results of a pairedt-test between the two sets of data confirms this with no statistically significant difference between the two (p=0.86 for benzene andp=0.64 for 1,3 butadiene). In addition no statistically significant difference was found between the smoker densityfigures for each location between the two forms of DSA (p =0.63).
In the‘smoke-free’areas of the pubs the mean concentrations of benzene in Type I and Type II pubs were 3.01μg/m3
and 1.42μg/m3
respectively, while the mean concen-trations of 1, 3 butadiene in Type I and Type II pubs were 2.44μg/m3
and 1.20μg/m3
[image:5.595.107.499.71.309.2]respectively. Comparing thesefigures an apparent, approximately two-fold, difference between the levels of ETS exposure in the‘smoke-free’areas of pubs with differing DSA types is evident: pubs with Type I DSA had a mean concentration of ETS 2.0–2.1 times higher than those pubs with Type II DSAs.
Fig. 2.Generic layout of the numerical model geometry.
Table 1
CFD models of Type I DSAs, variation of dimensions.
DSA model Length, L (m) Width, W (m) Height, H (m) H/W L/W
IA 10 10 10 1.0 1.0
IB 10 10 20 2.0 1.0
IC 20 10 10 1.0 2.0
[image:5.595.313.562.633.769.2]ID 20 10 20 2.0 2.0
Table 2
Benzene and 1,3 butadiene concentrations across 9 pubs in Dublin, in DSAs and
‘smoke-free’areas.
Location Benzene (μg/m3
) 1, 3 butadiene (μg/m3
) Smoker density (Cigs/m2
)
‘ Smoke-free’
DSA Ratio ‘Smoke-free’ DSA Ratio
Pub A 3.97 6.87 1.73 3.64 5.14 1.24 0.22 Pub B 2.79 3.40 1.22 1.35 1.73 1.28 0.03 Pub C 0.65 3.21 4.94 1.47 1.46 0.99 0.05 Pub D 4.62 6.97 1.51 3.30 5.89 1.78 0.21 Mean Type I 3.01 5.11 2.35 2.44 3.56 1.37 0.13
Pub E 0.78 5.39 6.91 0.27 4.47 16.56 0.10 Pub F 0.37 7.40 20.00 1.78 6.91 3.88 0.11 Pub G 3.18 5.01 1.58 1.72 3.44 2.00 0.18 Pub H 1.36 3.86 2.84 1.01 3.01 2.98 0.25 Mean Type II 1.42 5.42 7.83 1.20 4.46 6.35 0.16
[image:5.595.40.294.715.767.2]Pub X containing a DSA not conforming with either legal definition demonstrated the highest levels of ETS exposure both in the DSA itself and within the‘smoke-free’
area of the pub.
4.2. Numerical modelling of DSAs
The results of the numerical modelling of Type I DSAs are presented inTable 3, where the L/W ratio of the DSA was 1, notably higher concentrations were predicted for a H/W ratio of 2 compared to a H/W ratio of 1 (27% higher). Where the H/W ratio was held constant and the L/W ratio varied from 1 to 2, significantly higher con-centrations were predicted for the lower L/W ratio (up to 2.3 times higher).
5. Discussion
5.1. Exposure measurements
The field measurements campaign demonstrated that similar levels of ETS were present in the two DSA types tested. However varying levels of ETS exposure were found in the intended‘ smoke-free’areas of the pubs. This was likely to be due to the fact the Type I DSAs are most commonly located in internal courtyards or some other internal component of the building in question. Type II DSAs with their partial perimeter and enclosed roof tend to be constructed on the outside of a building. This highlights that in the case of Type II DSAs a greater proportion of the ETS emitted during smoking has the chance to disperse in the outside atmosphere than in Type I. In both cases a certain proportion of ETS will penetrate inside the building through natural ventilation from doors and windows.
In addition, as is common place outside the entrance to pubs in many parts of the world with bans on tobacco smoking, smokers often congregate outside entrances and the ETS emitted at these loca-tions is likely to increase the exposure of individuals inside. Future modifications to tobacco control policy should also examine the pos-sibility of discouraging this behaviour.
The variation between the concentrations of benzene and 1,3 bu-tadiene between all nine locations was in part due to variations in the smoker density, ventilation system type and rate and air tightness of each of the pubs. However it is clear from the nature of Type I & II DSAs and from the experimental data that this penetration of ETS oc-curs to a greater extent with Type I DSAs.
5.2. Exposure modelling
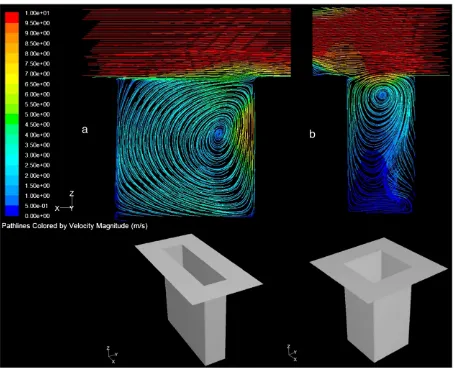
In addition to the differences in ETS exposure across DSA Types, numerical modelling of Type I DSAs with the samefloor area and the same rate of ETS emissions demonstrated that a wide range of concentrations were possible. The lowest ETS concentrations were found at higher ambient wind speeds as would be expected. Higher ETS concentrations were also found in Type I DSAs in which disper-sion was more restricted geometrically. Secondary currents were pro-duced by the skimmingflow of air at roof level and the speed of rotation of these secondary currents determined the degree of disper-sion and hence ETS concentrations at breathing level.Fig. 3shows a comparison of wind speed velocity path lines plotted on the central y-axis between models IB and ID (refer toTable 1).
Taking the four comparisons modelled in this investigation, the degree of variation in concentrations highlights the need for further research. The development of a set of robust design guidelines for
DSA construction is required which takes account of the dispersion of ETS within these confined environments such that concentration levels at breathing height are minimised. The hypothesis behind the exemption of DSA to smoking bans was that they were‘open to natural ventilation to such an extent that they are considered as effectively out-doors’. The results of this investigation clearly show that concentrations of ETS in Type I DSAs are unlikely to be open to natural ventilation on the same level as open outdoor environments.
Considering both the measured variation in ETS exposures in smoke free areas of pubs and the predicted variation of ETS exposure in Type I DSAs, the ambiguity of DSA legislation has been highlighted as an area of tobacco control policy warranting more rigorous defi ni-tion where restricni-tions on L/W ratios and H/W ratios are stipulated. Despite the shortcomings highlighted in this investigation, the con-centrations of ETS measured in Pub X demonstrate the effectiveness of current legislation in protecting workers and the population for ex-treme levels of ETS exposure. This investigation has highlighted areas were refinements of legislation can result in further improvements in the effectiveness of this legislation and in the control of ETS.
5.3. Comparisons with international tobacco control policy
Like Ireland, smoking is banned in the workplace and in public pre-mises in many other countries. The tobacco control policy enacting these laws also includes exemptions and other clauses under which DSAs may legally exist. Examples of such jurisdictions include England, Scotland, Wales and Northern Ireland.
In Scotland the Public Health Act, 2006 No. 90 prohibits smoking in a number of listed premises (including pubs and restaurants) which are wholly or substantially enclosed. The definition of a wholly enclosed premises is that which has roof and is wholly enclosed by walls and or other such features. The definition of substantially enclosed premises is that which has a roof and where the opening in the premises has an area of less than half of the enclosing walls.
As such any premises without a roof may constitute an exemption which could be used as a DSA with no control over the height of enclosing walls or on other internal dimensions of the space. Where a premises has a roof, it may still be used as a DSA as long as the area of the opening is greater than or equal to 50% of the enclosing walls. In both cases the Scottish legislation is similar to the Irish legislation in controlling for the presence of roof cover and/or the extent to which the area is enclosed.
In Wales, England and Northern Ireland all three have enacted a Public Health Act (Northern Ireland Assembly, 2007; UK Government, 2006; Welsh Assembly Government, 2007) enacting‘smoke-free’ pre-mises with exemptions again referring to wholly or substantially enclosed premises. In these three jurisdictions a structure enclosed on all sides except the roof is exempt from the Act as are premises which have a roof but are only partially enclosed. In each case the definition of this partial enclosure is slightly different but hinges on the concept of 50% of the perimeter being open.
Ireland was thefirst country to introduce a nationwide ban on smoking in the hospitality sector and perhaps its close neighbours have developed their own tobacco control policy based on the Irish model. However it is clear from thefindings of this investigation that this policy requires more stringent and scientifically based controls on DSAs in order to further protect the population from exposure to ETS.
6. Conclusions
[image:6.595.32.285.724.768.2]The results of this investigation highlight the weakness of the current legal definitions of DSAs in the legislation of many countries and demon-strate through numerical modelling the large degree of variation in ETS exposure concentrations possible in similar DSAs of differing dimen-sions. The absence of control on the dimensions of DSA in legislation is
Table 3
Comparison of predicted benzene concentrations (μg/m3
) in Type I DSAs of varying H/ W and L/W ratios.
L/W = 1 L/W = 2
Wind speed (m/s) 2.5 5 10 2.5 5 10
outlined as an area of tobacco control policy warranting further research and refinement.
The existing levels of ETS exposure recorded in pubs in Dublin Ireland can be seen to be significantly improved from pre tobacco control levels both in pubs and in DSAs. Type II DSAs primarily located on the outside of building were found to produce less penetration of ETS into the smoke free areas of the premises.
Further research is required to develop a set of DSA construction guidelines whereby concentrations of ETS are minimised both in the DSA itself and in smoke free areas of pubs.
Notation
k turbulent kinetic energy (m2/s2)
ε turbulent kinetic energy dissipation rate (m2/s3)
ρ density (kg/m3)
ui velocity in the ith direction (m/s) uj velocity in the jth direction (m/s) xi distance in the ith direction (m) xj distance in the jth direction (m)
αk inverse effective Prandtl number fork
αε inverse effective Prandtl number forε
μeff effective viscosity (Pa.s)
β coefficient of thermal expansion c speed of sound (m/s)
gi acceleration due to gravity in the ith direction (m/s2) T Temperature (K)
Prt turbulent Prandtl number
Acknowledgements
The authors would like to thank the Centre for Transport Research (PRTLI programme) and the ETI project (ERTDI programme), Trinity College Dublin for funding this investigation.
References
Ansys Fluent. Users guide: modeling turbulence; 2006.
Aquilina NJ, Delgado-Saborit JM, Meddings C, Baker S, Harrison RM, Jacob P, et al. Environmental and biological monitoring of exposures to PAHs and ETS in the general population. Environ Int 2010;36(7):763–71.
Baker RR, Proctor CJ. The origins and properties of environmental tobacco smoke. Environ Int 1990;16:231–45.
Barnoya GJ. Cardiovascular effects of secondhand smoke: nearly as large as smoking. Circulation 2005;111:2684–98.
Bates MN, Fawcett J. Exposure of hospitality workers to environmental tobacco smoke. Tob Control 2002;11:125–9.
Choudhury D. Introduction to the renormalization group method and turbulence modeling. Fluent Inc. Technical Memorandum TM-107; 1993.
Clancy L. Progress in tobacco control. Health Policy 2009(Suppl. 1):S3-S14. Donnelly P, Whittle P. After the smoke has cleared—reflections on Scotland's tobacco
control legislation. J R Inst Public Health 2008;122:762–6.
[image:7.595.76.531.74.442.2]Hodgson AT, Daisey JM, Mahanama KRR, Ten Brinke J, Alevantis LE. Use of volatile tracers to determine the contribution of environmental tobacco smoke to
concentrations of volatile organic compounds in smoking environments. Environ Int 1996;22(3):295–307.
Irish Government. Public Health (tobacco) (amendment) Act, No. 6 of 2004. Launders BE, Spalding DB. Lectures in mathematical modeling of turbulence. London,
England: Academic Press; 1972.
Li X-X, Liu C-H, Leung DYC. Large-eddy simulation offlowfield and pollutant transport inside urban street canyons with high aspect ratios. Seventh Symposium on the Urban Environment. San Diego, California: AMS; 2007.
McNabola A. New directions: passive control of personal air pollution exposure from traffic emissions in urban street canyons. Atmos Environ 2010;44:2940–1. McNabola A, Gill LW. The control of environmental tobacco smoke: a policy review. Int
J Environ Pollut Health 2009;6(2):741–58.
McNabola A, Broderick BM, Johnston PJ, Gill LW. Effects of the smoking ban on benzene and 1, 3-butadiene levels in pubs in Dublin. J Environ Sci Health 2006;41(5):799–810. Meyers DG, Neuberger JS. Cardiovascular effect of bans on smoking in public places.
Am J Cardiol 2009;54:1249–55.
Mulcahy M, Evans DS, Hammond SK, Repace JL, Byrne MA. How does the Irish smoking ban measure up? A before and after study of particle concentrations in Irish pubs. Indoor Air 2005;15(Suppl. 11):86–92.
Nelson PR, Conrad FW, Kellym SP, Maiolo KC, Richardson JD, Ogden MW. Composition of environmental tobacco smoke (ETS) from international cigarettes Part II: nine country follow-up. Environ Int 1998;24(3):251–7.
Ning Z, Cheung CS, Lu Y, Liu MA, Hung WT. Experimental and numerical study of the dispersion of motor vehicle pollutants under idle condition. Atmos Environ 2005;39:7880–93.
Northern Ireland Assembly Government. Public Health Statutory Instrument 2007 No. 94. Repace J. Respirable particles and carcinogens in the air of Delaware hospitality venues
before and after a smoking ban. J Environ Med 2004;46(9):887–905.
Repace J, Lowery AH. A quantitative estimate of nonsmokers' lung cancer risk from passive smoking. Environ Int 1985;11:3-22.
The Office of Tobacco Control (OTC). Report on the health effects of environmental tobacco smoke (ETS) in the workplace. Dublin, Ireland: The Office of Tobacco Control, Depart-ment of Health and Children; 2002.
Tiwary A, Robins A, Namdeo A, Bell M. Airflow and concentrationfields at urban road intersections for improved understanding of personal exposure. Environ Int 2011;37(5):1005–18.
UK Government. Health Act 2006.
Welsh Assembly Government. Public Health Wales, Statutory Instruments 2007 No. 787 (W.68).