Potato holds a strong position as a nutritious and versatile food crop. Due to the staple nature of potato in the diet and its wide range of industrial applications, it is one of the most important crops improving food security in the World. During the growing season, the crop is, however, highly sensitive to both abiotic and biotic factors. In consequence, yields show a high fluctuation between countries and within regions of a particular country (Devaux et al. 2014, Andrivon 2017). The in-season tuber yield prediction is a big challenge for farmers. The most critical stage of yield formation is the onset of tuberisation. An excess or shortage of nitrogen (N) leads to a disturbance in the transformation of stolon into tubers (Jackson 1999). Potato N status depends not only on its supply to the growing plants but also on the relationships with the contents of other nutrients. The 4th leaf of potato at the onset of tuberisation is considered an indicatory plant part, useful for evaluation of the crop nutritional status (MacKay et al. 1987, Walworth and Muniz 1993).
There are numerous statistical methods for the in-season tuber yield prognosis. The weakest aspect of the correlation analysis is a lack of recognition of the causal-effect relationships. This uncertainty can be solved by using path analysis. The procedure allows discriminating against the direct and indirect effects of the causal components on the effect component, such as yield (Hair et al. 2014). The diagnosis and recommendation integrated system (DRIS) is a cal-culation procedure, defining the nutritional status of the crop in critical stages of yield formation. The deficiency (–) or excess (+) of nutrients with respect to the adopted norms leads to a disturbance of plant growth. The interpretation of plant nutritional con-dition with the use of the DRIS indices assumes that for a pair of elements included in the analysis, the sum of indices always equals zero (MacKay et al. 1987, Walworth and Sumner 1987).
The key objective of the study was to evaluate the reliability of three statistical methods, i.e., stepwise
Potato nutritional status at the onset of tuberisation – a yield
prediction tool
Karolina Frąckowiak
1,2, Jarosław Potarzycki
1*, Witold Grzebisz
1,
Witold Szczepaniak
11Department of Agricultural Chemistry and Environmental Biogeochemistry,
University of Life Sciences, Poznan, Poland
2Yara Poland Sp. z o.o., Szczecin, Poland
*Corresponding author: [email protected]
Citation: Frąckowiak K., Potarzycki J., Grzebisz W., Szczepaniak W. (2020): Potato nutritional status at the onset of tuberisation – a yield prediction tool. Plant Soil Environ., 66: 86–92.
Abstract: A reliable tuber yield prognosis requires a complex statistical analysis of potato nutritional status in
the fully developed 4th leaf at the onset of tuberisation. This hypothesis was validated in the series of field experiments
conducted in 2006–2008 in Poland. The experimental design was composed of two nitrogen (N) rates (60, 120 kg/ha), two N fertilisers (Urea and Agrotain), two rates of sulfur (0, 50 kg/ha). The marketable tuber yield of cv. Zeus ranged from 31.3 to 59.3 t/ha in 2008 and 2006, respectively. Despite annual variability, the potato presented a good nutritional status. In 2008, the contents of N, Mg, Cu and Zn were about 33% lower as compared to 2006. The stepwise and path analyses indicated N, Mg and Cu as the key yield-limiting nutrients. The diagnosis and re-commendation integrated system (DRIS) showed that a slight imbalance of N and Mg did not disturb tuber yield, provided a positive balance of K was maintained. The Mg index, as a result of the DRIS procedure, emerged as the best single predictor of potato yield.
regression analysis, path analysis, and DRIS procedure for the marketable tuber yield prediction, considered as the effect component. The causal components were nutrient contents in the 4th leaf of potato at the onset of tuberisation.
MATERIAL AND METHODS
[image:2.595.67.535.556.742.2]The field experiment was conducted in three vegeta-tive seasons (2006, 2007, and 2008) at Kicin (52°46'N, 17°02'E, Poland) on soil originated from a silty-clay loam, classified as Gleyic/Stagnic Chernozem (Kabała et al. 2019). Soil pH was within the neutral range (1.0 mol/L KCl). The content of organic carbon (Corg) in the topsoil ranged from 27 to 55 g/kg soil. Contents of available nutrients, measured each year before the application of fertilisers, were 280–340 for P; 160–250 for K; 110–140 for Mg; 1 600–2 200 mg/kg soil for Ca (Mehlich III; Mehlich 1984). The content of mineral nitrogen (Nmin) measured in the 0–60 cm layer ranged from 60 to 85 kg/ha (0.01 mol/L CaCl2, Van Erp et al. 1998). The local climate, classified as intermediate between Atlantic and Continental, is seasonally variable, particularly during the summer (Figure 1). The total amount of precipitation for June and July, the critical months for potato growth, was 114 mm in 2006, 157 mm in 2007 and 66 mm in 2008, whereas the long-term average is 144 mm. The average temperature for these months in con-secutive years of the study was 22.2 ± 4.0 °C, 18.9 ± 3.4 °C and 19.6 ± 2.9 °C, respectively.
The field experiment was arranged as a three-factorial split-block design, replicated 4-fold: (1) N rate (acronym N): 60 and 120 kg N/ha;
(2) nitrogen fertiliser type (F): urea (U) and urea + NBPT [N-(n-butyl) thiophosphoric triamide] (Agrotain, A);
(3) sulfur: without (–S), with (+S).
Phosphorus (P) as triple superphosphate (19.8% P2O5) was applied in the rate of 25.8 kg P/ha; K as KCl in the rate of 99.6 kg K/ha, and sulfur as elemental sulfur (S0). All nutrients were applied together with N two weeks before potato planting. The total area of a single plot was 58.5 m2. The potato cv. Zeuswas planted in the second half of April and managed consistently with the code of good agricultural practice (Wójtowicz and Mrówczyński 2017). The preceding crop was spring barley. Potato tubers, in the amount of 53 000, were planted in a row-space of 75 cm and a distance of 25 cm within a row. The tubers were mechanically harvested from an area of 19.5 m2 150 days after planting.
The plant material, i.e., the 4th leaf on the potato stem, used for dry matter determination and measure-ment of the nutrient concentrations, were collected randomly from 30 plants on the plot. N concentration in plant samples was determined using a standard macro-Kjeldahl procedure. For mineral nutrients, the harvested plant sample was dried at 65 °C and then mineralised at 550 °C. The obtained ash was then dissolved in 33% HNO3. P concentration was meas-ured by the vanadium-molybdenum method using a Specord 2XX/40 (Analytik Jena, Jena, Germany) at a wavelength of 436 nm. The concentration of K, Mg, Fe, Mn, Zn, and Cu was determined using atomic absorption spectrometry – flame type. The results are expressed on a dry matter basis.
The collected data were subjected to ANOVA using Statistica® 10 (Tulsa, USA). The differences between
0 5 10 15 20 25 30 0 5 10 15 20 25 30 1-04 21 -0 4 11 -0 5 31 -0 5 20 -0 6 10 -0 7 30 -0 7 19 -0 8 8-09 28 -0 9 11 -0 4 1-05 21 -0 5 10 -0 6 30 -0 6 20 -0 7 9-08 29 -0 8 18 -0 9 1-04 21 -0 4 11 -0 5 31 -0 5 20 -0 6 10 -0 7 30 -0 7 19 -0 8 8-09 28 -0 9
2006 2007 2008
Pr ec ip ita tio n (m m ) Te m pe ra tu re (° C ) Precipitation Temperature
the treatments were evaluated using Tukey’s test. In the 2nd step of the diagnostic procedure, stepwise regres-sion was applied to define an optimal set of nutrients for the yield prognosis. In the computational procedure, a consecutive variable was removed from the mul-tiple linear regressions in a step-by-step manner. The best regression model was chosen based on the highest F-value for the model. Path analysis was conducted based on Konys and Wiśniewski (1984). The potato nutritional status was evaluated based on the diagnosis and recommendation integrated system (DRIS) (Walworth and Sumner 1987), using norms developed by MacKay et al. (1987).
RESULTS AND DISCUSSION
The primary evaluation of potato nutritional status at the onset of tuberisation was conducted based on
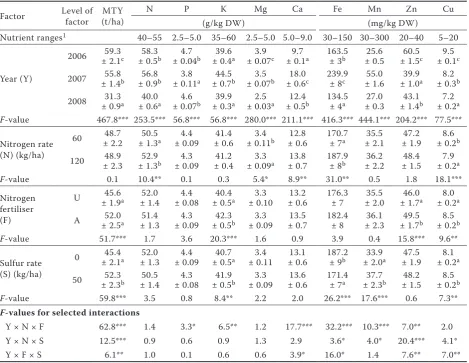
[image:3.595.64.534.366.729.2]the ANOVA and nutrient threshold ranges (Walworth and Muniz 1993). The nutrient content in the 4th leaf showed high year-to-year variability (Table 1). The N content was in the optimum range during the whole study, but in 2008, as compared to 2006, it decreased by 33%. The same trend was observed for Mg, Zn, and Cu with a relative drop of 33, 29 and 26%, respectively. The content of Mg and Cu were in the optimum ranges, irrespective of the year, but Zn was above the threshold maximum. Due to drought in May and June, the marketable tuber yield (MTY) was by almost 50% lower in 2008, as compared to 2006. The similarities of both trends indicate that these four nutrients were critical for the MTY. P content was in the optimum range, but it showed a different annual trend with respect to N. The lowest value was recorded in 2007, but it was higher in the other two years. K content showed an opposite trend
Table 1. Nutrient content in the 4th leaf on the potato stem at the onset of tuberisation (BBCH 39/40)
Factor Level of factor (t/ha)MTY N P K Mg Ca Fe Mn Zn Cu
(g/kg DW) (mg/kg DW)
Nutrient ranges1 40–55 2.5–5.0 35–60 2.5–5.0 5.0–9.0 30–150 30–300 20–40 5–20
Year (Y)
2006 ± 2.159.3 c ± 0.558.3 b ± 0.044.7 b ± 0.439.6 a ± 0.073.9 c ± 0.19.7 a 163.5 ± 3b ± 0.525.6 ± 1.560.5 c ± 0.19.5 c
2007 ± 1.455.8 b ± 0.956.8 b ± 0.113.8 a ± 0.744.5 b ± 0.073.5 b ± 0.618.0 c 239.9 ± 8c ± 1.655.0 ± 1.039.9 a ± 0.38.2 b
2008 ± 0.931.3 a ± 0.640.0 a ± 0.074.6 b ± 0.339.9 a ± 0.032.5 a ± 0.512.4 b 134.5 ± 4a ± 0.327.0 ± 1.443.1 b ± 0.27.2 a
F-value 467.8*** 253.5*** 56.8*** 56.8*** 280.0*** 211.1*** 416.3*** 444.1*** 204.2*** 77.5***
Nitrogen rate (N) (kg/ha)
60 ± 2.248.7 ± 1.350.5 a ± 0.094.4 ± 0.641.4 ± 0.113.4 b ± 0.612.8 170.7 ± 7a ± 2.135.5 ± 1.947.2 ± 0.28.6 b
120 ± 2.348.9 ± 1.352.9 b ± 0.094.3 ± 0.441.2 ± 0.093.3 a ± 0.713.8 187.9 ± 8b ± 2.236.2 ± 1.548.4 ± 0.27.9 a
F-value 0.1 10.4** 0.1 0.3 5.4* 8.9** 31.0** 0.5 1.8 18.1***
Nitrogen fertiliser (F)
U ± 1.945.6 a ± 1.452.0 ± 0.084.4 ± 0.540.4 a ± 0.103.3 ± 0.613.2 176.3 ± 7 ± 2.035.5 ± 1.746.0 a ± 0.28.0 a
A ± 2.552.0 a ± 1.351.4 ± 0.094.3 ± 0.542.3 b ± 0.093.3 ± 0.713.5 182.4 ± 8 ± 2.336.1 ± 1.749.5 b ± 0.28.5 b
F-value 51.7*** 1.7 3.6 20.3*** 1.6 0.9 3.9 0.4 15.8*** 9.6**
Sulfur rate (S) (kg/ha)
0 ± 2.145.4 a ± 1.352.0 ± 0.094.4 ± 0.540.7 a ± 0.113.4 ± 0.613.1 187.2 ± 9b ± 2.033.9 a ± 1.947.5 ± 0.28.1 a
50 ± 2.352.3 b ± 1.450.5 ± 0.084.3 ± 0.541.9 b ± 0.093.3 ± 0.613.6 171.4 ± 7a ± 2.337.7 b ± 1.548.2 ± 0.28.5 b
F-value 59.8*** 3.5 0.8 8.4** 2.2 2.0 26.2*** 17.6*** 0.6 7.3**
F-values for selected interactions
Y × N × F 62.8*** 1.4 3.3* 6.5** 1.2 17.7*** 32.2*** 10.3*** 7.0** 2.0
Y × N × S 12.5*** 0.9 0.6 0.9 1.3 2.9 3.6* 4.0* 20.4*** 4.1*
Y × F × S 6.1** 1.0 0.1 0.6 0.6 3.9* 16.0* 1.4 7.6** 7.0**
1Rosen (2001); athe same letter indicates a lack of significant differences within the treatment. MTY – marketable tuber
to that recorded for P but was only slightly above the threshold minimum. The same trend was recorded for Ca, Fe and Mn. For Ca, its content exceeded the threshold maximum. The highest values of this set of nutrients were recorded in 2007, in which they were twice as high for Ca and by 60% higher for Fe with respect to their threshold maxima.
The effect of N dose on the nutrient content was recorded for N, Ca, Fe, Mg, and Fe. For the first three nutrients, the N dose of 120 kg/ha resulted in significantly higher content, whereas for Mg and Cu, an opposite trend was observed. The effect of the N fertiliser type was recorded for MTY and also for K, Zn and Cu. The MTY was by 14% higher on the plot fertilised with Agrotain. The MTY increase, due to the S0 application, was 15%. The positive response of nutrients was recorded for K, Mn and Cu, whereas negative for Fe.
The analysis of relationships between the con-tent of nutrients in the 4th potato leaf and the MTY clearly showed a dominance of N and Mg as the most yield-limiting nutrients. Contents of both nutri-ents were too low, in spite of being in the optimum
range, to realise the marketable yield potential of potato in 2008. This study supports the Ncmax (tu-ber maximum nitrogen concentration) hypotheses by Grzebisz and Potarzycki (2020), who stated that these two nutrients in the initial stages of tuber yield development were responsible for the final yield. A slightly lower but positive impact on the yield was exerted by Cu and Fe. All these four nutrients were significantly and positively correlated with each other (Table 2). The N content was considerably correlated with Mg, followed by Cu and Fe. The stepwise regression analysis corroborated the yield forming effect of N and Mg:
MTY = –29.6 + 1.02N*** + 2.97Cu***
for n = 96, R2 = 0.59 and P ≤ 0.001
The frequency of a particular nutrient response to the experimental factors was the highest for the Y × N × F interaction (Table 1). The analysis of other interactions implicitly showed that only the plants fertilised with Agrotain, throughout all studied years, contained more Zn and K, but only in years with the distribution of precipitation. The impact of N
fertilis-Table 2. Correlation matrix between nutrient contents and the marketable tuber yield (MTY) (n = 96)
N P K Ca Mg Fe Mn Zn Cu
MTY 0.73*** –0.18 0.31** 0.05 0.64*** 0.44*** 0.37*** 0.24* 0.55***
N 1.00 –0.22* 0.16 0.16 0.78*** 0.59*** 0.32** 0.34** 0.42***
P 1.00 –0.53*** –0.69*** –0.19 –0.64*** –0.67*** 0.36** 0.01
K 1.00 0.62*** 0.12 0.52*** 0.71** –0.20 0.07
Ca 1.00 0.04 0.66*** 0.75*** –0.47** –0.22*
Mg 1.00 0.37*** 0.15 0.49*** 0.64***
Fe 1.00 0.73*** –0.24* 0.03
Mn 1.00 –0.48*** –0.00
Zn 1.00 0.51***
[image:4.595.64.533.112.257.2]*P < 0.05; **P < 0.01; ***P < 0.001
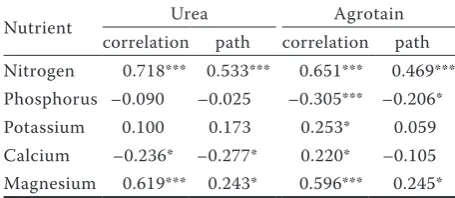
Table 3. Correlation and path coefficients for relation-ships between macronutrients content and tuber yield
(n = 48)
Nutrient Urea Agrotain
correlation path correlation path
Nitrogen 0.718*** 0.533*** 0.651*** 0.469***
Phosphorus –0.090 –0.025 –0.305*** –0.206*
Potassium 0.100 0.173 0.253* 0.059
Calcium –0.236* –0.277* 0.220* –0.105
Magnesium 0.619*** 0.243* 0.596*** 0.245*
[image:4.595.305.532.642.728.2]*P < 0.05; **P < 0.01; ***P < 0.001
Table 4. Correlation and path coefficients for relation-ships between micronutrients content and tuber yield
(n = 48)
Nutrient Urea Agrotain
correlation path correlation path
Iron 0.461*** 0.524*** 0.314** 0.214
Manganese 0.129 –0.169 0.397*** 0.507***
Zinc 0.267* –0.091 0.272* 0.494***
Copper 0.529*** 0.494*** 0.446*** 0.275*
*P < 0.05; **P < 0.01; ***P < 0.001
[image:4.595.62.290.643.742.2]ers on yield, affecting variability in nutrient content, was further evaluated by path analysis and DRIS.
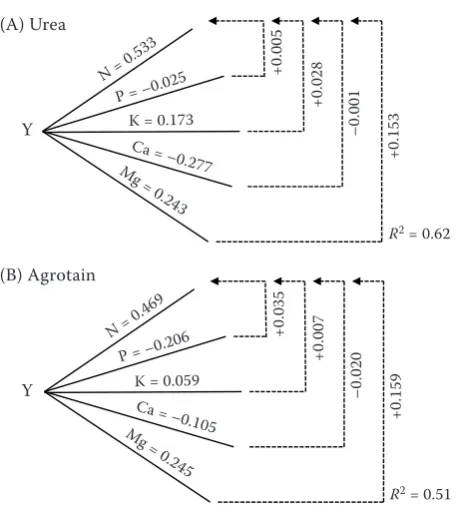
Tuber yield, as results from simple correlation coefficients (r) for urea treated plants depended significantly on the content of N and Mg (Table 3). The direct effect of Mg on yield was positive, yet low. The highest direct effect was exerted by N, which was positively strengthened by Mg, but at the same time negatively reinforced by Ca (Figure 2A). The Ca antagonism was due to a tremendous increase of its content in 2007 with respect to the threshold maximum (Table 1). In high yielding potato planta-tion the maximum Ca content is revealed between
[image:5.595.64.295.88.342.2]89 and 110 day after planting. Any increase in its content in the early stages of potato growth results in a significant yield decline (Potarzycki and Grzebisz 2020) The indirect effect of other macronutrients was negligible. The same pattern of the relationship between nutrient content in the 4th potato leaf and tuber yield was observed for plants fertilised with Agrotain (Figure 2B). The direct effect of nutrients on the yield was much weaker for A with respect to U. Higher values of r for plants fertilised with A indicate, however, their considerably greater nutri-tional stability, which consequently led to the higher tuber yield.
Table 5. Nitrogen fertiliser form and indices of nutrient imbalance by the diagnosis and recommendation inte-grated system (DRIS) method
Year fertiliserN DRIS nutrients indices nutrientsLimiting ASI
N P K Ca Mg
2006 UA –1.89–2.69 –3.16–3.34 4.956.01 8.737.5 –8.62–7.4 Mg > P > NMg > P > N 24.929.5
2007 UA –4.06–5.74 –16.84–31.15 4.188.24 29.0339.49 –12.22–10.85 P > Mg > NP > Mg > N 66.495.5
2008 UA –10.26–10.01 –7.25–4.00 12.359.74 22.0315.02 –14.26–13.36 Mg > N > PMg > N > P 63.554.7
U – urea; A – Agrotain; AIS – absolute sum of DRIS indices
Y
K = 0.173+ 0.
005 + 0.
028
- 0.
001 + 0.
153
A. Urea
R2 = 0.62
Y
K = 0.059+ 0.
035 + 0.
007
- 0.
020 + 0.
159
B. Agrotain
[image:5.595.309.533.92.341.2]R2 = 0.51
Figure 2. Path diagram of the macronutrient content in
the 4th leaf and tuber yield (Y) Figure 3. Path diagram of the micronutrient content in the 4th leaf and tuber yield (Y)
Y
+ 0.
053
+ 0.
033
+ 0.
055
A. Urea
R2 = 0.62
Y
+ 0.
200
+ 0.
008
- 0.
037
B. Agrotain
R2 = 0.53
(A) Urea (A) Urea
(B) Agrotain (B) Agrotain
Y Y
Y Y
N = 0.5 33
P = –0.025
K = 0.173
Ca = –0.277 Mg =
0.243
+0
.0
05
+0
.0
28
–0
.0
01
+0
.1
53
R2 = 0.62
N = 0.4 69
P = –0.206
K = 0.059
Ca = –0.105 Mg =
0.245
R2 = 0.51
+0
.0
35
+0
.0
07
–0
.0
20
+0
.1
59
Fe = 0.52 4
R2 = 0.62
Mn = –0.169
Zn = –0.091 Cu =
0.494
+0
.0
53 +0
.0
33 +0
.0
55
R2 = 0.53
Fe = 0.21 4
Mn = 0.507
Zn = 0.494 Cu =
0.275
+0
.2
00 +0
.0
08 –0
.0
[image:5.595.64.532.625.739.2]Among micronutrients, Cu, as indicated by the
r-value, had the most critical impact on the yield (Table 4). On plots fertilised with U, the direct effect of Cu was slightly lower as compared to Fe. Higher
r-value for Cu results from the indirect and positive effect of Fe and Mn, while a negative influence is ex-erted by Zn (Figure 3A). The same trend was observed for potato fertilised with A (Figure 3B). The direct effect of Cu was significantly lower as compared to Mn and Zn. The latter nutrient was recognised as the player, increasing r for Cu, but at the same time decreasing it for Mn. As a result of a higher number of significant correlations, plants fertilised with A as compared to U were more nutritionally balanced.
The DRIS procedure implicitly showed a significant impact of weather and, in particular, years on potato nutritional status (Table 5). In the dry year 2008, values of K indices were much higher as compared to both previous years. A reverse situation was re-corded for N and Mg. The most stable conditions were recorded in 2006. The absolute sum of indices (ASI) was below 30. The highest imbalance was cal-culated for Mg, which was negative. Slightly higher values for particular nutrients, and in consequence for ASI, were recorded for plants fertilised with A. ASI values in 2007 were about 3-fold higher as compared to 2006. The key reason for the high ASI was the double increase in Ca and a simultaneous decrease in P contents. In soil naturally rich in Ca and with pH in the neutral range, as in the studied case, there is a high probability of P ion precipitation (Fixen and Brullsema 2014). It is necessary to stress that the recorded imbalance did not have a negative effect on the MTY. In 2008, the highest imbalance was recorded for Ca and Mg, followed by N.
The obtained DRIS indices were then correlated with the potato yield (Table 6). The significant lin-ear models were obtained only for N and Mg. The
[image:6.595.64.291.139.233.2]higher correlation coefficient for N clearly stresses its dominant and predictive role. However, as shown in Figures 4A–C, DRIS indices for N, Mg, and K fit-ted the quadratic regression model the best. The Mg imbalance of –9.4 resulted in the prediction of the highest tuber, i.e., 63.2 t/ha. The regression model for N was slightly weaker. The N imbalance of –3.8 indicated the tuber yield at the level of 59.1 t/ha. The regression model for K showed a completely different course. The K balance of +5.3 resulted in the tuber yield prognosis at 56.0 t/ha. The positive K
Table 6. Linear regression models between the diagnosis and recommendation integrated system (DRIS) indices
for particular nutrients and tuber yield (Y) (n = 6)
Nutrient Equation R2 P
Nitrogen Y = 3.52N + 69.14 0.79 0.01
Phosphorus Y = –0.46P + 43.81 0.13 ns
Potassium Y = –3.34K + 74.14 0.53 ns
Calcium Y = 0.08Ca + 47.20 0.00 ns
Magnesium Y = 4.35Mg + 97.17 0.66 0.05
[image:6.595.304.530.269.708.2]ns – non significant
Figure 4. Tuber yield as a function of the diagnosis and recommendation integrated system (DRIS) indices for particular nutrients. MTY – marketable tuber yield
MTY = –0.7Ni2 – 5.23Ni + 49.1
R² = 0.90, n = 6, P < 0.01
–15 –10 –5 0
M
TY
(t
/h
a)
N DRIS index (Ni)
MTY = –1.53Mgi2 – 28.6Mgi – 71.4
R² = 0.93, n = 6, P < 0.01
–15 –10 –5 0
Mg DRIS index (Mgi)
MTY = –0.63Ki2 + 6.94Ki + 37.5
R² = 0.64, n = 6, P < 0.05
0 10 20 30 40 50 60 70
0 5 10 15
M
TY
(t
/h
a)
K DRIS index (Ki)
MTY = –0.7Ni2 – 5.23Ni + 49.1
R² = 0.90, n = 6, P < 0.01
–15 –10 –5 0
M
TY
(t
/h
a)
N DRIS index (Ni)
MTY = –1.53Mgi2 – 28.6Mgi – 71.4
R² = 0.93, n = 6, P < 0.01
–15 –10 –5 0
Mg DRIS index (Mgi)
MTY = –0.63Ki2 + 6.94Ki + 37.5
R² = 0.64, n = 6, P < 0.05
0 10 20 30 40 50 60 70
0 5 10 15
M T Y (t/ ha )
K DRIS index (Ki)
MTY = –0.7Ni2 – 5.23Ni + 49.1
R² = 0.90, n = 6, P < 0.01
–15 –10 –5 0
M
TY
(t
/h
a)
N DRIS index (Ni)
MTY = –1.53Mgi2 – 28.6Mgi – 71.4
R² = 0.93, n = 6, P < 0.01
–15 –10 –5 0
Mg DRIS index (Mgi)
MTY = –0.63Ki2 + 6.94Ki + 37.5
R² = 0.64, n = 6, P < 0.05
0 10 20 30 40 50 60 70
0 5 10 15
M
TY
(t
/h
a)
K DRIS index (Ki)
balance corroborates its yield-forming effect at the onset of potato tuberisation (Grzebisz et al. 2018).
The tuber yield patterns based on nutrient contents in the 4th leaf, using different statistical models, cor-roborate correctness of the yield model obtained using the stepwise regression analysis. The path analysis allowed distinguishing the effect of a stabilised form of urea, i.e., Agrotain. The higher degree of nutrient balance in potato plants at the onset of tuberisation, resulted in the higher tuber yield. The yield models based on DRIS indices show that a slight imbalance of N and Mg at the onset of potato tuberisation, with a good balance of K, is a typical attribute of the high-yielding plantation.
REFERENCES
Andrivon D. (2017): Potato facing global challenges: how, how much, how well? Potato Research, 60: 389–400.
Devaux A., Kromann P., Ortiz O. (2014): Potatoes for sustainable global food security. Potato Research, 57: 185–199.
Fixen P.E., Bruulsema T.W. (2014): Potato management challenges created by phosphorus chemistry and plant roots. American Journal of Potato Research, 91: 121–131.
Grzebisz W., Potarzycki J. (2020): The in-season nitrogen concen-tration in the potato tuber as the yield driver. Agronomy Journal, 1–20. https://doi.org/10.1002/agj2.20000
Grzebisz W., Potarzycki J., Biber M. (2018): The early prognosis of tuber yield based on nitrogen status in potato tops. Plant, Soil and Environment, 64: 539–545.
Hair J.F.Jr., Black W.C., Babin B.J., Anderson R.E. (2014): Multivari-ate Data Analysis. 7th Edition. Harlow, Pearson Education Lim-ited. ISBN 13: 978-1-292-02190-4
Jackson S.D. (1999): Multiple signaling pathways control tuber in-duction in potato. Plant Physiology, 119: 1–8.
Kabała C., Charzyński P., Chodorowski J., Drewnik M., Glina B., Greinert A., Hulisz P., Jankowski M., Jonczak J., Labaz B., Lachacz A., Marzec M., Mendyk L., Musial P., Musielok L., Smreczak B., Sowinski, Switoniak M., Uzarowicz L., Waroszewski J. (2019): Polish Soil Classification, 6th edition – principles, classification scheme and correlations. Soil Science Annual, 70: 71–97. Konys L., Wiśniewski P. (1984): Path analysis in cause and
ef-fect relationships. Roczniki AR w Poznaniu, CLIII: 37–54. (In Polish)
MacKay D.C., Carefoot J.M., Entz T. (1987): Evaluation of the DRIS procedure for assessing the nutritional status of potato (Solanum tuberosum L.). Communications in Soil Science and Plant Analysis, 18: 1331–1353.
Mehlich A. (1984): Mehlich 3 soil test extractant: a modification of Mehlich 2 extractant. Communications in Soil Science and Plant Analysis, 15: 1409–1416.
Potarzycki J., Grzebisz W. (2020): The in-season variability in the calcium concentration in potato organs and its relationship with the tuber yield. Journal of Elementology, 25: 107–124.
Rosen C. (2001): Tissue Analysis as a Nutrient Management Tool for Potatoes. Minnesota, Vegetable IPM Newsletter 3, v. 9. Van Erp P.J., Houba Y.J.G., Van Beusichem M.L. (1998): One
hun-dredth molar calcium chloride extraction procedure. Part I: A review of soil chemical, analytical, and plant nutritional as-pects. Communications in Soil Science and Plant Analysis, 29: 1603–1623.
Walworth J.L., Sumner M.E. (1987): The diagnosis and recommen-dation integrated system (DRIS). Advances in Soil Science, 6: 149–188.
Walworth J.L., Muniz J.E. (1993): A compendium of tissue nutrient concentrations for field-grown potatoes. American Potato Jour-nal,70: 579–597.
Wójtowicz A., Mrówczyński M. (2017): A Methodic of Integrated Potato Protection. Poznan, Institute of Plant Protection, Nation-al Research Institute, 252. (In Polish)