During the investigation of forest stands damage most-ly increment reduction and production reduction in rela-tion to partial tree or stand characteristics in current area units are studied. Particularly, for a tree it can be diameter, height or volume increment and for a stand mean diameter increment, height increment or increment of mean stem volume, but mostly it is the increment of standing volume. When tree production is examined, it is particularly total current increment and mean total increment. These incre-ments are very important in forest production as they in-tegrate the increment of main stand as well as secondary crop not only at a certain time but also for a longer time period from its establishment. Their direct measurements and determination in forest stands are very difficult and complicated as to methodology as well as field measure-ments. This is particularly important especially for dam-aged stands. In this case the difficulties occur not only due to availability of empirical material but mostly due to a longer time necessary for its collection.
Due to these reasons we searched for alternative methods to derive increment and production reduction for dam-aged stands. One of them is simulation of reduction by means of growth and production models of undamaged stands and reduction of volume increment, or of the qual-ity of damaged trees. This procedure was already used
for spruce and pine stands by PRIESOL (1989), PETRÁŠ
and HALAJ (1993), PETRÁŠ et al. (1999), PETRÁŠ and MEC
-KO (2001). The reduction of value production of spruce
stands due to lower diameter and volume increments was
published by PETRÁŠ (2002). According to his algorithm
the value production was determined from a financial ex-pression of volume and timber quality, from which costs of timber felling were deducted. Lower timber quality is thus characterized only by a smaller diameter of logs due to lower diameter increments of damaged stands. As the reduction of production for living trees was investigated in this case, other changes in timber quality that follow tree drying were not considered.
The aim of this work is to describe the methodology of the derivation of models and based on them the quantifi-cation of a reduction in value production of spruce stands from the time when the damage started until their dieback, which is accompanied particularly by marked deteriora-tion of timber quality.
METHODS AND PROCEDURES
The value of timber from damaged spruce stands after their dieback was derived from models of value production of damaged stands before their dieback and models for adjustment of the structure of assortments from dead trees as given by PETRÁŠ et al. (1995). PETRÁŠ (2002) reasoned out the models of value production of damaged stands whilst he based his reasoning on partial models as follows:
– Total volume production (PETRÁŠ, MECKO 2001),
– Development of mean diameters (PETRÁŠ et al. 1993),
– Development of mean stem volume (PETRÁŠ et al. 1993), – Stand assortment tables (PETRÁŠ, NOCIAR 1991),
– Mean prices of timber assortments (PETRÁŠOVÁ et al.
2001),
Reduction of timber value from damaged spruce stands
after their dieback
R. P
ETRÁŠForest Research Institute, Zvolen, Slovak Republic
ABSTRACT: The paper presents a method for the derivation of total timber production and of increments in value units,
particularly in net financial yield for spruce stands damaged by crown defoliation after their dieback. The value production was derived by means of value growth models of undamaged stands and models for the adjustment of volume and qualitative production of damaged and died stands. Changes in timber quality after tree drying and changes in the production of dam-aged stands compared with undamdam-aged ones are illustrated in tables and graphs. The changes are expressed by means of the indexes of total mean increment and total current increment. They depend mainly on the degree of stand damage expressed by crown defoliation, age and yield class of stand, the age of stand when the damage started and duration of damage. The value of damaged stands after their dieback is lover minimally by 50% than before their dieback. It is caused mainly by deteriorated quality of timber from dead trees in stand.
Keywords: spruce; total value production of timber; increments
– Own costs of logging (PETRÁŠOVÁ et al. 2001). He derived the value production of damaged stands from these partial models by converting the volume pro-duction into the propro-duction of assortments by means of assortment models and the latter into gross financial yield by means of timber prices. He deducted from that model own costs of logging and obtained net financial yield. As damaged stands have lower volume production and small-er tree diametsmall-ers, consequently they have lowsmall-er value production than undamaged stands.
A main factor influencing the value production, in addi-tion to the volume, is the quality of timber that was as-sessed according to the structure of timber assortments.
According to the models of assortment tables (PETRÁŠ
1992) the proportion of assortments in spruce stands de-pends on their mean diameter, external quality and me-chanical damage of stems. It can be expressed as follows:
Vsort%= f
(
dv,kv,p)
( 1 )where: Vsort% – percentage of the assortments in standing volume,
dv – mean diameter of stand, kv – external quality of stems,
p – proportion of mechanically damaged stems.
This basic relation is valid for damaged or living trees until their dieback. After dieback the situation changes
significantly. Wood of trees starts to decay, which results in quality deterioration. Thus the assortment structure of
such trees and stands undergoes changes as well. PETRÁŠ
et al. (1995) investigated this issue on a relatively vast empirical material of sample trees. He found that in com-parison with living trees dead trees, so called snags, have zero proportions of the highest quality classes of logs, namely quality class I and II and markedly lower propor-tions of high quality classes of saw logs, namely quality class III A. On the other hand, they have significantly higher proportions of lower quality saw logs of III B qual-ity class, of pulpwood, qualqual-ity class V, fuelwood – qualqual-ity class VI and waste wood. He classified dead trees into three classes according to the intensity of damage to sap-wood by decay and discolouration. These classes are as follows:
Class 1 – fresh snag. The tree shortly after its dieback, mostly with bark without larger surface cracks. It has only very slight damage to sapwood by discolouration, maxi-mally to 1/10 of the butt end diameter. The stem is without any sapwood damage.
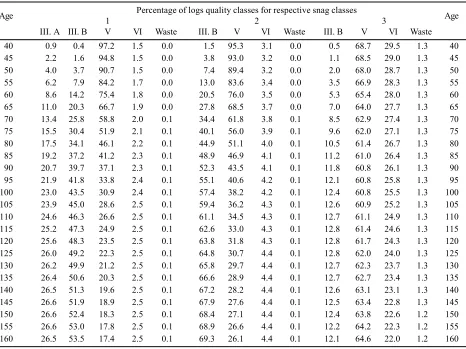
[image:2.595.59.526.413.761.2]Class 2 – older snag, the stem mostly without bark with large surface desiccation cracks. If with bark it shows a significant incipient fungal attack of timber. In a cross-section of the stem sapwood discolouration larger than 1/10 of the butt end, but surface decay of sapwood is maximally on 1/10 of the butt end diameter.
Table 1. Assortment yield tables of spruce snag stands for the main stand of yield class 30
Percentage of log quality classes for respective classes of snags
Age 1 2 3 Age
III. A III. B V VI Waste III. B V VI Waste III. B V VI Waste
40 8.4 9.8 80.3 1.5 0.0 16.6 80.2 3.2 0.0 4.4 66.3 28.1 1.3 40
45 12.2 19.2 67.0 1.6 0.0 27.9 68.7 3.3 0.0 7.1 64.1 27.6 1.3 45
50 15.9 27.2 55.2 1.7 0.0 37.8 58.7 3.5 0.0 9.2 62.4 27.1 1.3 50
55 19.1 33.4 45.6 1.8 0.0 45.7 50.6 3.6 0.0 10.8 61.3 26.6 1.3 55
60 21.9 37.9 38.2 1.9 0.1 51.8 44.4 3.7 0.1 11.9 60.7 26.1 1.3 60
65 24.2 41.2 32.6 2.0 0.1 56.5 39.6 3.7 0.1 12.6 60.5 25.7 1.3 65
70 26.1 43.6 28.2 2.0 0.1 60.2 35.9 3.8 0.1 13.0 60.5 25.2 1.3 70
75 27.5 45.5 24.9 2.0 0.1 63.0 33.1 3.8 0.1 13.3 60.7 24.7 1.3 75
80 28.7 46.9 22.3 2.0 0.1 65.2 30.8 3.9 0.1 13.4 61.1 24.3 1.3 80
85 29.5 48.1 20.2 2.0 0.1 67.0 29.0 3.9 0.1 13.4 61.5 23.8 1.3 85
90 30.2 49.1 18.6 2.0 0.1 68.5 27.5 3.9 0.1 13.3 62.0 23.4 1.2 90
95 30.6 50.0 17.3 2.0 0.1 69.6 26.4 3.9 0.1 13.2 62.6 23.0 1.2 95
Class 3 – old snag with surface decay of the stem on more than 1/10 of the butt end diameter. For fresh snags classified into class 1 the greatest shift of quality classes of logs was recorded from class I–III A into class III B, for older snags classified into class 2 from quality class I–III A into quality class III B as well as almost equally into qua-lity class V and VI. For older snags classified into class 3 the shift occurs in whole classes I–III A and partially of quality class III B into quality class V and VI. Based
on these facts PETRÁŠ et al. (1995) derived the models
for the adjustment of assortment structure from dead trees.
By means of the models for timber value production in
damaged stands before their dieback PETRÁŠ (2002) and
the models for the adjustment of assortment structure from dead trees PETRÁŠ et al. (1995) assortment yield ta-bles for snag spruce stands were derived. These tata-bles represent only a theoretical possibility that all trees in the stand would dry simultaneously at a particular age. They are classified according to classes of snags 1, 2 and 3, age of stands 40–160 years and yield class of the stand 14–42. Assortment yield tables of snag stands give the percent-age of quality classes III A–VI. The proportions of qual-ity classes I–II equal zero for all yield classes. A summary from these tables for yield class 30 is presented in Table 1 for the main stand and in Table 2 for a secondary crop.
Based on assortment yield tables for snag stands of class 2 we derived value yield tables for snag stands that give the value of net financial yield of damaged stands immediately after their dieback. These yield tables also contain the data on total mean increment and total current increment in net financial yield. Increment indexes were calculated as the quotient of total mean increment of dam-aged stand after dieback and total mean increment of un-damaged stand. The index for total mean increment is as follows:
n ps CPP
CPP CPP
I = ( 2 )
where: ICPP– increment index of total mean increment, CPPps, CPPn– total mean increment of damaged stand
after dieback (ps) and of undamaged stand (n).
[image:3.595.72.538.72.421.2]Increment indexes for total current increment ICBP were also calculated according to formula (2) using the value of total current increment. These increment indexes are a very good measure to express relative increment changes for damaged stands after their dieback in comparison with living and undamaged stands. Their hundredfold value gives these changes in per cent. A complement to 100% gives relative reduction of net financial yield of these stands in comparison with living and healthy stands.
Table 2. Assortment yield tables of spruce snag stands for the secondary crop of yield class 30
Age 1 Percentage of logs quality classes for respective snag classes 2 3 Age III. A III. B V VI Waste III. B V VI Waste III. B V VI Waste
40 0.9 0.4 97.2 1.5 0.0 1.5 95.3 3.1 0.0 0.5 68.7 29.5 1.3 40
45 2.2 1.6 94.8 1.5 0.0 3.8 93.0 3.2 0.0 1.1 68.5 29.0 1.3 45
50 4.0 3.7 90.7 1.5 0.0 7.4 89.4 3.2 0.0 2.0 68.0 28.7 1.3 50
55 6.2 7.9 84.2 1.7 0.0 13.0 83.6 3.4 0.0 3.5 66.9 28.3 1.3 55
60 8.6 14.2 75.4 1.8 0.0 20.5 76.0 3.5 0.0 5.3 65.4 28.0 1.3 60
65 11.0 20.3 66.7 1.9 0.0 27.8 68.5 3.7 0.0 7.0 64.0 27.7 1.3 65
70 13.4 25.8 58.8 2.0 0.1 34.4 61.8 3.8 0.1 8.5 62.9 27.4 1.3 70
75 15.5 30.4 51.9 2.1 0.1 40.1 56.0 3.9 0.1 9.6 62.0 27.1 1.3 75
80 17.5 34.1 46.1 2.2 0.1 44.9 51.1 4.0 0.1 10.5 61.4 26.7 1.3 80
85 19.2 37.2 41.2 2.3 0.1 48.9 46.9 4.1 0.1 11.2 61.0 26.4 1.3 85
90 20.7 39.7 37.1 2.3 0.1 52.3 43.5 4.1 0.1 11.8 60.8 26.1 1.3 90
95 21.9 41.8 33.8 2.4 0.1 55.1 40.6 4.2 0.1 12.1 60.8 25.8 1.3 95
RESULTS AND DISCUSSION
To derive and assess required results we calculated in-crement indexes for damaged spruce stands with mean
defoliation 20% and 67%, according to PETRÁŠ and HALAJ
(1993) corresponding to the lowest degrees of damage 0 + 1 and the highest degrees of damage 3 + 4. We calculated them according to formula (2). The initial age of stands when damage started was 50 or 100 years. Damage by constant defoliation 20% or 67% lasted until the chosen age, when all trees suddenly died. After the dieback the 3rd class of snags is considered.
Graphs that were plotted from calculated indexes illus-trate these results. The development of the indexes of total mean increment in dependence on the age for spruce stand of yield class 40, with damage beginning at the age of 50 or 100 years, is illustrated in Fig. 1. For defolia-tion 20% the index increases with higher age in a non-linear form. With the initial age of damage 50 years in the interval 0.26–0.51 and the initial age of damage 100 years the indexes are higher only by 0.05–0.06. For defolia-tion 67% the indexes of total mean increment have signif-icantly lower values. With the initial age of damage 50 years they slightly increase with higher age in a liner form in the interval 0.18–0.20. For the initial age of damage 100 years they decrease with higher age in the interval 0.49–0.41.
The development of some indexes of total current in-crement for yield class 40 in dependence on age is pre-sented in Fig. 2. For defoliation 20% the indexes of total current increment increase with higher age, particularly for the initial age of damage 50 years in the interval 0.45–0.66. For the initial age of damage 100 years the in-dexes are higher maximally by 0.02. For defoliation 67% the indexes of total current increment have significantly lower values. For the initial age of damage 50 years they slightly increase with higher age within the range 0.18–0.25. For the initial age of damage 100 years the indexes are higher by about only 0.05.
Summarizing the comparison of increment changes ex-pressed by increment indexes from value production of damaged and dead spruce stands we can state that they depend differently on the basic stand characteristics and following factors:
– Degree of stand damage expressed by crown defoliation, – Age of stand when the damage started and damage
duration,
– Yield class of stand.
The importance of these factors changes and largely depends on the respective increment. In general, we can state that both indexes are influenced to the largest extent by crown defoliation, followed by the age of stand when damage started, duration of damage and yield class of the stand. The effect of these factors is more significant for total mean increment than for total current increment.
0.0 0.1 0.2 0.3 0.4 0.5 0.6
50 60 70 80 90 100 110 120 130 140 150 160 Age (years) Index
defoliation 20 % defoliation 67 % 50 years 100 years 50 years 100 years Initial age of damage
defoliation 67% 0.6
0.5
0.4
0.3
0.2
0.1
0.0
defoliation 20%
Index Initial age of
damage
100 years
100 years
50 years 50 years
Age (years)
[image:4.595.61.280.58.340.2]5050 6060 7070 8080 90 100 110 120 130 140 150 16090 100 110 120 130 140 150 160
Fig. 1. Development of the indexes of total mean increment from the net yield of snag spruce stands with yield class 40 and 20% and 67% crown defoliation
0.0 0.1 0.2 0.3 0.4 0.5 0.6 0.7 0.8
50 60 70 80 90 100 110 120 130 140 150 160 Age (years) Index
50 years 100 years 100 years
50 years Initial age of
damage
Fig. 2. Development of the indexes of total current increment from the net yield of snag spruce stands with yield class 40 and 20% and 67% crown defoliation
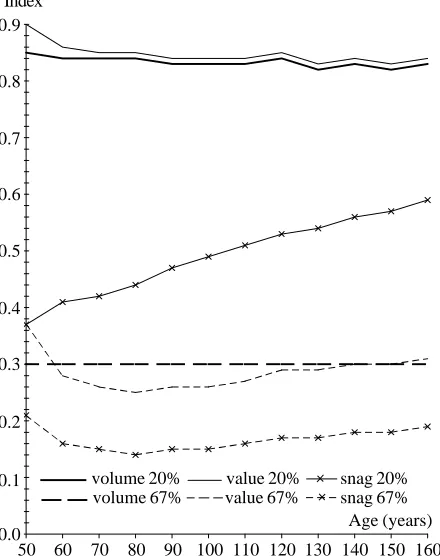
[image:4.595.303.519.416.708.2]To evaluate the importance of increment reduction as-sessment from value production of damaged and dead stands in a more complex way we also made a comparison with similar indicators of volume production as presented by PETRÁŠ and MECKO (2001) and value production as presented by PETRÁŠ (2002). Fig. 3 illustrates such a com-parison by means of the indexes of total mean increment for yield class 30, which is approximately an average yield class of spruce stands in Slovakia with defoliation 20% and 67% and initial age of damage 50 years. Fig. 3 shows that increment indexes for volume increment have the highest values. For 20% defoliation these values decrease with higher age in the interval 0.97–0.87. The indexes of value increment have almost the same constant value 0.84 in the whole age range, which is less by about 0.03–0.11 than for volume production. Unanimously, the indexes of total mean increment from value production of snag stands have the lowest value. They increase with higher age of stands, within the range 0.0–0.42. Thus only for the highest values it is only a half value of earlier men-tioned indexes. For 67% defoliation the increment indexes have the same trend with higher age as for 20% defolia-tion. The values of these indexes are markedly lower. At the same time there are larger differences between the indexes of total mean increment from volume and value production as well as production of snag stands. Al-though the largest differences between these indexes were determined for the lowest age, they are relatively
[image:5.595.318.538.61.341.2]high also at the highest age of 160 years. The indexes of total mean increment from volume and value production of damaged and snag stands have the values 0.46, 0.25 and 0.09.
Fig. 4 illustrates the indexes of total current increment for the same input parameters as for total mean increment. The value index of total current increment has the highest value that slightly decreases with higher age within the range of 0.90–0.84. The volume index has the values low-er by 0.01 only in comparison with the value index. The trend and the value of the index of total current increment for snag stands are totally different. Its values increase with higher age in a linear form. At the beginning of dam-age the value is 0.37 and at the dam-age 160 years 0.59. The indexes of total current increment for the stands with 67% defoliation have obviously substantially lower va-lues. For volume production it is a constant value 0.30 and for value production it is almost the same value. The indexes of total current increment for snag stands are al-most parallel to the indexes of total current increment from value production. They are lower by about 0.10. By com-paring the trend of the indexes of total current increments and total mean increments we can state that the indexes of total current increments from volume production and value production have very similar values for 20% defoliation and 67% defoliation. The indexes of total current incre-ments for snag stands have much more lower values.
Based on this analysis we drew some conclusions that are very important for practice. They are as follows:
0.0 0.1 0.2 0.3 0.4 0.5 0.6 0.7 0.8 0.9
50 60 70 80 90 100 110 120 130 140 150 160 Age (years) Index
volume 20 % value 20 % snag 20 % volume 67 % value 67 % snag 67 %
Age (years) 0.9 0.8 0.7 0.6 0.5 0.4 0.3 0.2 0.1 0.0 snag 20% snag 67% volume 20% volume 67% value 20% value 67% Index
50 60 70 80 90 100 110 120 130 140 150 160
Fig. 4. Comparison of the indexes of total current increment from volume and value production of damaged and snag stands with yield class 30 and 20%, 67% defoliation respectively
0.0 0.1 0.2 0.3 0.4 0.5 0.6 0.7 0.8 0.9 1.0
50 60 70 80 90 100 110 120 130 140 150 160 Age (years) Index
volume 20 % value 20 % snag 20 % volume 67 % value 67 % snag 67 %
50 60 70 80 90 100 110 120 130 140 150 160 Age (years) snag 20% snag 67% volume 20% volume 67% value 20% value 67% Index 1.0 0.9 0.8 0.7 0.6 0.5 0.4 0.3 0.2 0.1 0.0
[image:5.595.75.294.415.708.2]– In the quantification and evaluation of direct increment reduction of timber production for damaged stands it is necessary to investigate also its value production in financial units in addition to timber volume.
– In dependence on the degree of damage the value pro-duction of damaged stand is lower by about 5–50% and by 1–5% only than volume production for total mean increment and total current increment, respec-tively.
– The value production of damaged and dead trees, so called snags, is even lower. The value of stand produc-tion after dieback is lower at least by a half than before dieback.
– From the methodological as well as practical point of view the application of production and increment re-duction requires to recognize principal differences be-tween total mean increment and total current incre-ment.
CONCLUSION
A method for the derivation of value production of dam-aged spruce stands after their dieback is described. Their value production is expressed by net financial yield from timber production by means of total mean increment and total current increment. To evaluate increment changes in more general terms we calculated their increment indexes from the investigated increments as the quotient of the increments of damaged and undamaged stands. A com-plement to the value 1.0 represents a relative financial loss of net yield from produced timber in such stand. Based on the presented analysis we can state that the value production of damaged stands and dead stands depends mainly on the degree of stand damage given by crown defoliation, age of stand, yield class of stand as
well as the age of stand, when damage started including the duration of damage. The value of damaged stands after their dieback is lower minimally by a half than before the dieback. It is caused only by the impaired quality of timber after the dieback of trees in the stand.
R e f e r e n c e s
PETRÁŠ R., NOCIAR V., 1991. Sortimentačné tabuľky hlavných drevín. Bratislava, Veda: 304.
PETRÁŠ R., 1992. Mathematisches Modell der Sortiments-tafeln für Hauptbaumarten. Lesn. Čas., 38: 323–332. PETRÁŠ R., HALAJ J., 1993. Prírastky imisne poškodených
smrekových porastov. Lesn. Čas. – Forestry Journal, 39: 553–558.
PETRÁŠ R., NOCIAR V., PAJTÍK J., 1993. Changes in incre-ment of spruce damaged by air pollution. Lesnictví, 39: 116– 122.
PETRÁŠ R., MECKO J., NOCIAR V., 1995. Redukčné koefi-cienty pre sortimentáciu smrekových suchárov. Lesn. Čas. – Forestry Journal, 41: 219–229.
PETRÁŠ R., MECKO J., NOCIAR V., 1999. Prírastky zásob dreva poškodených borovicových porastov. Lesn. Čas. – Forestry Journal, 45: 205–216.
PETRÁŠ R., MECKO J., 2001. Model of volume production of damaged spruce stands. J. For. Sci., 47: 158–163. PETRÁŠ R., 2002. Value production of damaged spruce stands.
Ekológia (Bratislava) (submitted).
PETRÁŠOVÁ V., MECKO J., PETRÁŠ R., 2001. Prices of spruce timber and costs of spruce timber logging. J. For. Sci., 47: 322–330.
PRIESOL A., 1989. Produkcia smrekových porastov poškod-zovaných imisiami. Lesnictví, 35: 899–910.
Received 31 December 2001
Straty na hodnote dreva poškodzovaných smrekových porastov po ich odumretí
R. PETRÁŠ
Lesnícky výskumný ústav, Zvolen, Slovenská republika
ABSTRAKT: Práca prezentuje postup odvodenia celkovej produkcie dreva a jej prírastkov v hodnotových jednotkách, tj. čistom finančnom výnose pre smrekové porasty poškodené defoliáciou korún po ich odumretí. Hodnotová produkcia sa odvodila pomocou hodnotových rastových modelov nepoškodených porastov a modelov na korekciu objemovej a kvalitatívnej produkcie poškodených a odumretých porastov. V tabuľkách a na obrázkoch sú prezentované zmeny v kvalite dreva po uschnutí stromov a produkčné zmeny poškodených porastov voči nepoškodeným. Zmeny sú vyjadrené prostredníctvom indexov celkového priemerného prírastku a celkového bežného prírastku. Tie závisia hlavne od stupňa poškodenia porastu vyjadreného defoliáciou korún, veku a bonity porastu, veku porastu, v ktorom poškodenie začalo, a od doby jeho trvania. Hodnota poškodzovaných porastov je po ich odumretí minimálne o polovicu menšia ako pred odumretím. Je to spôsobené hlavne zhoršenou kvalitou dreva po odumretí stromov v poraste.
Cieľom práce je popísať metodiku odvodenia modelov
a podľa nich aj kvantifikovať straty na hodnotovej
produkcii dreva smrekových porastov od začiatku ich
poškodzovania až po ich odumretie, pri ktorom dochádza najmä k výraznému zhoršeniu kvality dreva.
Hodnota dreva poškodzovaných smrekových porastov po ich odumretí sa odvodila z modelov hodnotovej produkcie poškodzovaných porastov pred ich odumretím a modelov na korekciu štruktúry sortimentov z odumre-tých stromov, ako ich uvádza PETRÁŠ et al. (1995). Mode-ly hodnotovej produkcie poškodzovaných porastov pred
ich odumretím podrobne zdôvodnil PETRÁŠ (2002) a
vy-chádzal pritom z parciálnych modelov:
– celkovej objemovej produkcie (PETRÁŠ, MECKO 2001),
– vývoja stredných hrúbok (PETRÁŠ et al. 1993),
– vývoja objemu stredného kmeňa (PETRÁŠ et al. 1993),
– porastových sortimentačných tabuliek (PETRÁŠ, NO
-CIAR 1991),
– priemerných cien sortimentov dreva (PETRÁŠOVÁ et
al. 2001),
– vlastných nákladov ťažbovej činnosti (PETRÁŠOVÁ et al. 2001).
Hodnotovú produkciu poškodených porastov odvodil z týchto parciálnych modelov tak, že objemovú produkciu
prepočítal prostredníctvom sortimentačných modelov na
produkciu sortimentov a túto prostredníctvom cien dreva
na hrubý finančný výnos. Od tohto odpočítal modelové
vlastné náklady na ťažbu dreva a dostal čistý finančný výnos. Vzhľadom na to, že poškodené porasty majú nižšiu objemovú produkciu a menšie hrúbky stromov, majú po-tom aj menšiu hodnotovú produkciu ako nepoškodené porasty.
Hlavným faktorom, ktorý hodnotovú produkciu
ovplyv-ňuje, je popri objeme najmä kvalita produkovaného dreva,
ktorá sa hodnotila podľa štruktúry sortimentov. Podľa
modelov sortimentačných tabuliek (PETRÁŠ et al. 1992) podiel sortimentov v smrekových porastoch závisí od ich strednej hrúbky, vonkajšej kvality a mechanického po-škodenia kmeňov.
Tento základný vzťah platí pre poškodené, ale žijúce
stromy až do okamihu ich odumretia. Po odumretí stro-mov sa ich situácia výrazne mení. Ich drevo postupne
nahníva, čím významne mení svoju kvalitu. Z tohto
dôvodu sa mení aj skladba sortimentov z takýchto
stro-mov a porastov. Túto otázku na relatívne veľkom
empi-rickom materiáli stromových vzorníkov podrobne
preskúmali PETRÁŠ et al. (1995) a zistili, že odumreté
stromy – tzv. sucháre – majú oproti živým stromom nu-lové podiely najcennejších akostných tried výrezov I a II a výrazne nižšie podiely kvalitnejších piliarskych výre-zov triedy III A. Naproti tomu majú výrazne vyššie podie-ly menej kvalitných piliarskych výrezov triedy III B, vlákninového dreva triedy V, palivového dreva triedy VI a odpadu. Podľa intenzity poškodenia beľovej časti dreva jej sfarbením a hnilobou zatrieďovali odumreté stromy do troch tried s touto charakteristikou:
Trieda 1 – čerstvý suchár, strom v krátkom čase po
odumretí prevažne ešte v kôre, bez väčších povrchových
trhlín. Má len veľmi slabé poškodenie beli, a to len jej sfarbením najviac do 1/10 hrúbky čela. Kmeň ešte nemá žiadnu hnilobu beli.
Trieda 2 – starší suchár, kmeň je prevažne už bez kôry,
s veľkými povrchovými výsušnými trhlinami. Keď je
v kôre, tak má výrazné zaparenie dreva. Na priečnom reze kmeňa má sfarbenie beli väčšie ako 1/10 čela, ale povrcho-vá hniloba beli siaha najviac do 1/10 hrúbky čela.
Trieda 3 – starý suchár s povrchovou hnilobou kmeňa
na viac ako 1/10 hrúbky čela.
Pomocou modelov hodnotovej produkcie dreva
poško-dzovaných porastov pred ich odumretím (PETRÁŠ 2002)
a modelov na korekciu štruktúry sortimentov z odumre-tých stromov (PETRÁŠ et al. 1995) sa odvodili
sortimen-tačné rastové tabuľky suchárových smrekových
porastov. Tieto tabuľky predstavujú len teoretickú
možnosť, že všetky stromy v poraste by v konkrétnom
veku naraz uschli. Sú členené podľa tried suchárov 1, 2 a 3, veku porastov 40–160 rokov a bonity porastu 14–42.
Sortimentačné rastové tabuľky suchárových porastov
obsahujú percentuálne podiely akostných tried výrezov III A–VI. Podiely akostných tried výrezov I–II sú pri všet-kých bonitách nulové.
Zo sortimentačných rastových tabuliek suchárových
porastov s triedou suchárov 2 sa odvodili hodnotové
ras-tové tabuľky suchárových porastov, ktoré udávajú
hod-notu čistého finančného výnosu poškodených porastov
ihneď po ich odumretí. Tieto rastové tabuľky obsahujú aj údaje celkového priemerného prírastku (CPP) a celkového bežného prírastku (CBP) v čistom finančnom výnose. Ich podielom s hodnotami živých a nepoškodených porastov sa vypočítali prírastkové indexy.
Pre odvodenie a zhodnotenie požadovaných výsled-kov sa vypočítali podľa vzorca (2) prírastkové indexy pre poškodené smrekové porasty s priemernou defoliáciou 20 % a 67 %, ktoré odpovedajú podľa PETRÁŠA a HALAJA
(1993) najslabším stupňom poškodenia stromov 0 + 1
a najsilnejším stupňom poškodenia stromov 3 + 4. Poč ia-točný vek poškodenia porastov je od 50 alebo 100 rokov. Poškodenie konštantnou defoliáciou 20 % alebo 67 % trvá až po zvolený vek, v ktorom všetky stromy náhle odu-mrú. Po odumretí sa uvažuje s 3. triedou suchárov.
Vývoj indexov celkového priemerného prírastku (ICPP) v závislosti od veku pre smrekový porast bonity 40, ktorý je poškodzovaný od 50 alebo 100 rokov, je znázornený na obr. 1. Na obr. 2 je vidieť vývoj vybraných indexov
cel-kového bežného prírastku (ICBP) pre bonitu porastu 40
v závislosti od jeho veku. Po súhrnnom porovnaní prírast-kových zmien vyjadrených prostredníctvom prírastko-vých indexov z hodnotovej produkcie poškodených
a odumretých smrekových porastov môžeme konštatovať,
že tieto rôznou mierou závisia od hlavných porastových veličín a faktorov, ako sú:
– stupeň poškodenia porastu vyjadrený defoliáciou
ko-rún stromov,
– vek porastu, v ktorom poškodenie začalo, a doba jeho
Významnosť týchto faktorov sa mení a veľmi závisí aj
od toho, na ktorý prírastok sa vzťahuje. Po väčšom
zovšeobecnení môžeme konštatovať, že obidva indexy
najviac ovplyvňuje defoliácia korún stromov, potom
nasleduje vek porastu, pri ktorom poškodenie začalo,
a doba jeho poškodzovania a nakoniec je to bonita po-rastu. Pri celkovom priemernom prírastku je vplyv týchto faktorov významnejší ako pri celkovom bežnom prírastku. Z predchádzajúceho rozboru sa odvodili niektoré dôležité poznatky, ktoré majú aj značný praktický význam. Sú nasledujúce:
– Pri kvantifikácii a ohodnocovaní priamych prírast-kových strát na produkcii dreva poškodzovaných
po-rastov je potrebné popri objeme dreva skúmať najmä
jeho hodnotovú produkciu vo finančných jednotkách.
– Hodnotová produkcia poškodeného porastu je aj
v závislosti od jeho stupňa poškodenia pri celkovom
priemernom prírastku približne o 5–50 % a pri celko-vom bežnom prírastku len o 1–5 % nižšia ako objemová produkcia.
– Ešte podstatne nižšia je hodnotová produkcia poško-dených a odumretých (tzv. suchárových) porastov. Hodnota produkcie porastu po odumretí je minimálne o polovicu menšia ako pred odumretím.
– Pri aplikácii produkčných a prírastkových strát je po-trebné z metodologického, ale aj praktického hľadiska
uznávať principiálne rozdiely medzi celkovým
prie-merným a celkovým bežným prírastkom.
Corresponding author: