JOURNAL OF FOREST SCIENCE, 64, 2018 (8): 358–370
https://doi.org/10.17221/13/2018-JFS
Effects of anthropogenic disturbance on plant
composition, plant diversity and soil properties
in oak forests, Iran
Javad ESHAGHI RAD
1*, Gelare VALADI
1, Osman SALEHZADEH
1, Hosein MAROOFI
21Department of Forestry, Faculty of Natural Resources, Urmia University, Urmia, Iran
2Agricultural and Natural Resources Research Center, Sanandaj, Iran
*Corresponding author: javad.eshaghi@yahoo.com
Abstract
Eshaghi Rad J., Valadi G., Salehzadeh O., Maroofi H. (2018): Effects of anthropogenic disturbance on plant composition, plant diversity and soil properties in oak forests, Iran. J. For. Sci., 64: 358–370.
Three sites including “less disturbed”, “moderately disturbed” and “severely disturbed” were selected in Zagros forests in Kurdistan province (Iran). Three forest stands with similar physiographic conditions of each site were selected and three 400 m2 plots were assessed in each stand to record the floristic information and soil sample (0–30 cm). Different
diversity indices were calculated for each sample. Cluster analysis and to collect soil samples detrended correspond-ence analysis were applied to categorize and investigate the vegetation trend. Indicator species analysis was used to determine the characteristic species. Tukey test was used to compare the variables amongst sites. The results showed that 47, 25, 15 species were exclusively observed in less disturbed, moderately disturbed and severely disturbed sites, respectively. Furthermore, cluster analysis illustrated the distinction amongst sites and detrended correspondence analysis result showed that the vegetation of the regions was ordinated by disturbance gradient. 21, 5, 7 characteristic species were respectively indicated in less disturbed, moderately disturbed and severely disturbed sites. In general, plant composition, plant diversity and soil quality were decreased dramatically along the disturbance gradient. Keywords: Quercus brantii; richness; understory species; Zagros forests; canopy cover
Politic and scientific sensitivities on the biodi-versity issue have increased since the remarkable enhancement of the extinction rate of species because of human activities (Ehrlich, Wilson 1991) and ecologists and natural resources manag-ers have shown great attention to the relationship between anthropogenic disturbance and species diversity (Robert, Gilliam 1995). The exact un-derstating of the relationship between biotic and abiotic sections of forest ecosystems and human influences on plants’ biodiversity is crucial for for-est managerial and protective activities. Scott et al. (1998) emphasized the impact of improper use and land use change on decline of species diversity and ecosystem destruction. Also, Ruprecht et al. (2009) stated that structure and biodiversity of the
plant diversity and changing the species distribu-tion pattern. Blanko and Pereira (2015) evalu-ated the anthropogenic disturbance on natural vegetation in fragmented forests and showed that protection of woodland habitats were necessary for conservation of plant richness in the remain-ing stands. Shaheen et al. (2001) investigated the effects of human exploitation on structural diver-sity and community composition in the subtropi-cal forests of India and demonstrated that density, basal area and the number of species were less than those in similar undisturbed stands. Furthermore, they mentioned that this destruction caused much pressure on Quercus ilex Linnaeus, Quercus dila-tata Lindley ex de Candolle, Pinus wallichiana A.B. Jackson, and Pinus roxburghii Sargent spe-cies. Despite abovementioned studies, Linares et al. (2011) stated that the species diversity of those stands that experienced low human intervention was five times more than species diversity in pro-tected areas. Moreover Shrestha et al. (2012) evaluated the effects of human-made disturbance on the vascular plant diversity in oak forests in Ne-pal and illustrated that all diversity indices were enhanced where forest disturbance was at inter-mediate level. On the other hand, the soil proper-ties of forest can be affected by human activiproper-ties (Gömöryová et al. 2008). In the forest ecosystems tree and herb species could influence soil proper-ties and also there is an interaction between trees and soil, in other words, growth and production of trees depend on the soil fertility. In addition, the amount of mineralization and nitrification of or-ganic matter in soil is associated with species rich-ness (Augusto et al. 2002). Moreno et al. (2007) stated that harvesting of trees resulted in reduction of organic matter and soil quality; therefore, dis-turbance caused by human activities could change the composition, quality and quantity situation of tree species and as a result affect the soil properties in forest ecosystems. Latty et al. (2004) evaluated the influences of land-use history on soil charac-teristics and nutrient dynamics in northern hard-wood forests of the Adirondack Mountains. The results showed that anthropogenic disturbance decreased the soil carbon and nitrogen pools com-pared to old-growth. Also, Borrelli et al. (2017) demonstrated that 45.3% of soil loss is caused by water erosion in the logged forests in Italy.
Zagros forest is the largest forest land in Iran in which oak genus is the main woody species. These forests are divided into northern and southern parts based on oak species occurrence. The north-ern part is the specific habitat of Quercus
infec-toria Olivier, but in some regions it is combined with Quercus libani Olivier and Quercus brantii Lindley, while the southern part is just covered by Q. brantii (Fattahi 1995). From the past to pres-ent, these forests have been inhabited by residents and nomads who have caused deforestation in some parts and severe damages in others. In these forests, people follow a classical form of managing the forest in which forage for feeding their animals and wood for fuel were collected (Ghazanfari 2004). Unfortunately, due to social problems and lack of proper and comprehensive management, these forests have been heavily disturbed and have lost their productivity potential which endangers the future of the forests (Fattahi 1995). Accord-ing to the increasAccord-ing destruction of oak forests in Zagros forest in Iran, it is necessary to investigate the influence of human disturbance with various intensities on species diversity and soil proper-ties. Oak stands in Zagros forests are loaded with a complex of disturbance regimes including fuel wood cutting, local people use and livestock graz-ing. The local people use and fuel wood cutting and livestock grazing may have distinct effects on the herbaceous plant diversity. This study, how-ever, does not distinguish the disturbance types but only their intensity levels. The spatial extent and frequency of disturbances in the region show that these disturbances impact on all areas simul-taneously but with different intensity. Therefore, the current study aims to compare the woody and herbaceous species diversity and soil properties in less disturbed (LD), moderately disturbed (MD) and severely disturbed (SD) areas of oak forests in Zagros forests.
MATERIAL AND METHODS
Study area. The research area is located in the
Kurdistan province (Iran), latitude 35°45' to 36°15'N and longitude 45°30'E to 46°15'E. Nine patches of oak forests (Q. brantii) were selected which were situated on north-facing sites with similar slope and altitude conditions. The altitude is 1,550 m and the percentage of slope is between 15 and 23°. The mean annual temperature is 13.8°C and the mean annual rainfall is 658 mm. The soil type is belongs to the Entisol order developed on calcareous sub-strate (Pourbabaei, Navgran 2011).
Sampling methods. We observed a complex of
distur-bances in the studied region showed that many areas would be impacted by these disturbances at the same time but with different intensity which resulted in different canopy openness. We catego-rized the disturbance intensity by specifying the canopy openness classes and defining the live-stock grazing and traditional wood cutting levels. At first, from the oak forests of the region, three different sites were selected. The first one was the LD area with more than 50% canopy cover (maxi-mum canopy cover was 70%), little impact from livestock and other forms of traditional utiliza-tion. The second one was the MD area with 10 to 50% canopy coverage and some impact of livestock grazing and traditional wood cutting. The last one was the SD area with less than 10% canopy of trees, permanent livestock grazing and extensive pole and fuel wood cutting (Mishra et al. 2004). Three forest stands with similar physiographic conditions of each site were selected and in each stand, three 400 m2 plots were assessed at 0, 100
and 200 m on transect, for recording the floristic information (nine plots per a site). The names of the herbaceous species were recorded and their abundance was counted on 5 subplots with dimen-sions 1.5 × 1.5 m (Fu et al. 2004; Eshaghi Rad et al. 2009). Tree’s DBH and crown cover (large and small crown diameter) were measured for calcu-lating the basal area and canopy cover within the plots. In total, there were 45 plots for each site. Also, a soil sample was assessed from 0–30 cm of mineral soil in each plot (nine soil samples for each site). The humus layer was not considered in this study because this layer was very thin and it could not be distinguished. Before the laboratory analysis, the soil samples were air-dried and sieved with a 2 mm. Sand, silt and clay percentages were determined to the hydrometric method. Soil pH (in H2O) was determined by a pH meter. Total N was analysed using the Kjeldahl method. Available P by colorimetry according to Bray-II method and organic carbon by the Walkley and Black method were determined. Organic matter was obtained by multiplying C values by 1.72. Exchangeable potas-sium was extracted with ammonium acetate 1 N and was analysed by using flame photometer de-vice. Also, the C/N ratio (as an indicator of miner-alization of organic matter) was calculated.
Biodiversity indices. For measuring plant
diver-sity for each sample, species richness (SR) was cal-culated as the number of species inventoried in the plot. We applied the Shannon diversity index (H') and evenness index (E), they were calculated as fol-lows (Eqs 1 and 2):
1
' iln i
s i
H
p p (1)where:
s – number of species,
pi – relative cover of ith species.
max ' ' H E
H
= (2)
where:
H'max = ln(SR).
In addition, rarefaction method was used to esti-mate the richness of herbaceous species in different sites. Rarefaction curve shows standardized com-parison of species richness for three individual-based rarefaction curves (Magurran 2004). The original data was used for calculating the diversity indices.
Statistical analysis. Tukey Test was applied for
comparing the means of species diversity indices and soil properties amongst different sites using SPSS software (Version 18, 2010).
In order to recognize plant species groups within predefined categories, cluster analysis was used to classify the samples based on abundance data using a Sørensen distance measurement and flexible beta linkage – PC-ORD for Windows (Version 4, 1999).
Detrended correspondence analysis (DCA) was applied to assess the rate and direction of changes on the plant composition in different stands. In-dicator species analysis accompanied by Monte Carlo test was used to determine the characteristic species of each site. For an ecological interpreta-tion of the ordinainterpreta-tion result, scores of plots of the first two ordination axes were correlated with cor-responding measurements of environmental vari-ables using Spearman rank correlation – PC-ORD for Windows (Version 4, 1999). Before data analy-sis, species with less than 5% frequency were de-leted from the species matrix and the matrix of soil physical and chemical variables was standardized to a mean of 0 and variance of 1 prior to ordination.
The computer program PC-ORD for Windows (Version 5.0, 2006) was used to calculate all diversi-ty indices and the multivariate analysis (McCune, Grace 2002).
RESULTS
The results showed that there were significant differences in the basal area and canopy cover amongst LD, MD and SD areas (Table 1).
including: (i) tree species: Q. brantii, Q. infectoria, Q. libani, Crataegus azarolus Linnaeus, Crataegus aronia (Linnaeus) Bosc ex de Candolle, Pistacia atlantica Desfontaines, Amygdalus communis Lin-naeus, (ii) shrub species: Lonicera nummulariifo-lia Jaubert & Spach, Rosa canina Linnaeus are the most abundant species. Floristic information and species of trees, shrubs and herbaceous plants are shown in Table 2. Some recorded species were ex-clusive in 3 sites. For instance some exex-clusive spe-cies were observed in LD area including: Allium macrochaetum Boissier & Haussknecht, Alyssum
szowitsianum Fischer & C.A. Meyer, Astragalus (Adiaspastus) michauxianus Boissier, Muscari lon-gipes Boissier, Rumex acetosella Linnaeus, Scorzo-nera laciniata Linnaeus.
Some exclusive species in MD area included: Traginia latyfolia Linnaeus, Chardinia orienta-lis (Linnaeus) Kuntze, Lactuca serriola Linnaeus, Scorzonera phaeopappa (Boissier) Boissier, Cardu-us arabicCardu-us von Jacquin ex Murray subsp. arabicus, Lathyrus inconspicuus Linnaeus.
Some exclusive species in SD area are included: Cousinia inflata Boissier & Haussknecht ex Bois-sier, Sonchus arvensis Linnaeus, Vicia narbonen-sis Linnaeus, Scabiosa macrochaete Boissier & Haussknecht, Medicago radiata Linnaeus, Lolium perenne Linnaeus.
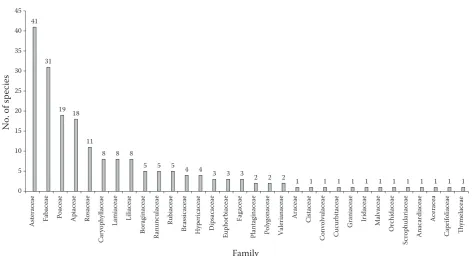
[image:4.595.63.291.88.142.2]Moreover, 179 herbaceous species were identified in the studied areas which belonged to 103 genera and 27 families (Table 2). 41 species (21.02%) be-longed to Asteraceae or Compositae, 31 species (15.9%) belonged to Fabaceae, 19 species (9.75%) Table 1. Mean and standard error of basal area and canopy
cover in less, moderately and severely disturbed areas
Disturbed area
less moderately severely Basal area (m2) 2.52 (0.006)a 0.9 (0.02)b 0.1 (0.003)c
Canopy cover (m2) 62.9 (14.2)a 35.5 (8.9)b 4.3 (1.6)c
Different letters indicate the significance differences
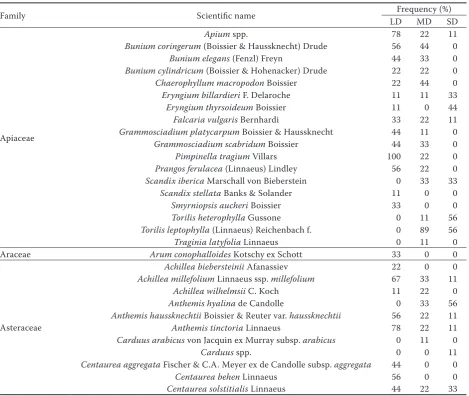
Table 2. Family, the scientific name of the species and percentage of species frequency in different sites
Family Scientific name LDFrequency (%)MD SD
Apiaceae
Apium spp. 78 22 11
Bunium coringerum (Boissier & Haussknecht) Drude 56 44 0
Bunium elegans (Fenzl) Freyn 44 33 0
Bunium cylindricum (Boissier & Hohenacker) Drude 22 22 0
Chaerophyllum macropodon Boissier 22 44 0
Eryngium billardieri F. Delaroche 11 11 33
Eryngium thyrsoideum Boissier 11 0 44
Falcaria vulgaris Bernhardi 33 22 11
Grammosciadium platycarpum Boissier & Haussknecht 44 11 0
Grammosciadium scabridum Boissier 44 33 0
Pimpinella tragium Villars 100 22 0
Prangos ferulacea (Linnaeus) Lindley 56 22 0
Scandix iberica Marschall von Bieberstein 0 33 33
Scandix stellata Banks & Solander 11 0 0
Smyrniopsis aucheri Boissier 33 0 0
Torilis heterophylla Gussone 0 11 56
Torilis leptophylla (Linnaeus) Reichenbach f. 0 89 56
Traginia latyfolia Linnaeus 0 11 0
Araceae Arum conophalloides Kotschy ex Schott 33 0 0
Asteraceae
Achillea biebersteinii Afanassiev 22 0 0
Achillea millefolium Linnaeus ssp. millefolium 67 33 11
Achillea wilhelmsii C. Koch 11 22 0
Anthemis hyalina de Candolle 0 33 56
Anthemis haussknechtii Boissier & Reuter var. haussknechtii 56 22 11
Anthemis tinctoria Linnaeus 78 22 11
Carduus arabicus von Jacquin ex Murray subsp. arabicus 0 11 0
Carduus spp. 0 0 11
Centaurea aggregata Fischer & C.A. Meyer ex de Candolle subsp. aggregata 44 0 0
Centaurea behen Linnaeus 56 0 0
[image:4.595.64.534.362.758.2]Table 2. to be continued
Family Scientific name LDFrequency (%)MD SD
Asteraceae
Centaurea virgata Lamarck subsp. squarrosa (von Willdenow) Gugler 44 22 33
Cephalorrhynchus tuberusum Gray 33 0 0
Chardinia orientalis (Linnaeus) Kuntze 0 78 0
Cirsium haussknechtii Boissier 0 0 11
Cousinia inflata Boissier & Haussknecht ex Boissier 0 0 22
Crepis pulchra Linnaeus subsp. pulchra 0 11 0
Crupina crupinastrum (Moris) Visiani 0 44 44
Echinops inermis Boissier & Haussknecht 11 0 0
Echinops orientalis von Trautvetter 0 11 56
Echinops haussknechii Boissier 0 22 67
Gundelia tournefortii Linnaeus 0 56 44
Hieracium procerum Fries 11 11 0
Hieracium spp. 11 11 0
Lactuca serriola Linnaeus 0 22 0
Lactuca aculeata Boissier & Kotschy 56 67 0
Picnomon acarna (Linnaeus) de Cassini 11 44 33
Rhagadiolus angulusus de Jussieu 0 11 0
Rhagadiolus stellatus (Linnaeus) Gaertner 0 22 0
Scariola orientalis (Boissier) Soják subsp. orientalis 0 22 33
Scariola spp. 56 11 22
Scorzonera laciniata Linnaeus 11 11 0
Scorzonera luristanica Rechinger f. 22 0 11
Scorzonera mucida Rechinger f. 44 0 0
Scorzonera phaeopappa (Boissier) Boissier 0 44 0
Scorzonera calyculata Boissier 44 44 11
Sonchus arvensis Linnaeus 0 0 11
Steptorrhamphus tuberosus (von Jacquin) Grossheim 33 0 0 Tragopogon bornmuelleri M. Ownbey & Rechinger f. 78 11 0 Tragopogon buphthalmoides (de Candolle) Boissier var. buphthalmoides 67 0 0
Boraginaceae
Anchusa italica Retzius var. italica 33 56 0
Cerinthe minor Linnaeus 11 0 11
Echium italicum Linnaeus var. italicum 11 0 11
Onosma microcarpum de Candolle 0 0 11
Symphytum kurdicum Boissier & Haussknecht 0 0 11
Brassicaceae
Alyssum Linifolium Stephani ex von Willdenow 67 0 0
Alyssum szowitsianum Fischer & C.A. Meyer 11 44 11
Arabis nova Villars 22 0 0
Thlaspi perfoliatum Linnaeus 11 0 0
Caryophyllaceae
Cerastium dichotomum Linnaeus 11 0 0
Cerastium glomeratum Thuillier 11 0 0
Dianthus orientalis Adams 22 11 0
Minuartia meyeri (Boissier) Bornmüller 0 0 11
Silene chlorifolia Smith 33 0 0
Silene conoidea Linnaeus 44 0 0
Silene latifolia Poiret 22 0 0
Silene ampullata Boissier 22 0 0
Cistaceae Helianthemum ledifolium (Linnaeus) Miller var. ledifolium 0 44 67
Convolvulaceae Convolvulus arvensis Linnaeus 0 0 11
Cucurbitaceae Bryonia multiflora Boissier & von Heldreich 11 0 0
Table 2. to be continued
Family Scientific name LDFrequency (%)MD SD
Euphorbiaceae Euphorbia szovitsii Fischer & C.A. Meyer 22 22 0
Fabaceae (Fabiodae)
Astragalus (Adiaspastus) michauxianus Boissier 22 22 0 Astragalus (Anthylloidei) tortuosus de Candolle 22 11 11 Astragalus (Hymenostegis) persicus (de Candolle) Fischer & C.A. Meyer 0 44 67
Astragalus (Incani) curvirostris Boissier 78 0 0
Astragalus (Platonychium) verus Olivier 11 0 0
Astragalus nervestipulus Boissier 22 33 11
Cicer oxyodon Boissier & Hohenacker 22 0 0
Lathyrus inconspicuus Linnaeus var. inconspicuus 0 44 0
Lathyrus boissieri Širjaev 0 11 0
Lens orientalis (Boissier) Handel-Mazzetti 0 22 0
Lotus gebelia Ventenat var. gebelia 22 22 0
Medicago radiata Linnaeus 0 22 0
Medicago rigidula (Linnaeus) Allioni var. rigidula 0 0 22
Medicago sativa Linnaeus 0 22 0
Oxytropis kotschyana Boissier & Hohenacker 11 0 0
Pisum sativum Linnaeus subsp. sativum 0 11 0
Trifolium arvense Linnaeus var. arvense 0 11 11
Trifolium campestre von Schreber 0 44 22
Trifolium grandiflorum von Schreber 11 0 0
Trifolium pilulare Boissier 0 56 56
Trifolium pratense Linnaeus var. pratense 44 22 0
Trifolium purpureum Loisel 11 56 44
Trifolium repens Linnaeus 22 44 0
Trifolium spumusum Linnaeus 0 33 0
Trigonella monantha C.A. Meyer subsp. monantha 0 11 0
Vicia assyriaca Boissier 11 0 0
Vicia ervilia (Linnaeus) von Willdenow 0 11 0
Vicia michauxii Sprengel var. michauxii 0 11 0
Vicia sericocarpa Fenzl 11 0 0
Vicia narbonensis Linnaeus 0 0 11
Vicia variabilis Freyn & Sintenis 89 11 0
Geraniaceae Geranium tuberosum Linnaeus subsp. micranthum Schönbeck-Temesy 67 44 0
Hypericaceae
Hypericum asperulum Jaubert & Spach 0 0 11
Hypericum perforatum Linnaeus 22 33 0
Hypericum scabrum Linnaeus 22 33 0
Hypericum hirtellum Boissier 0 22 0
Iridaceae Gynandris sisyrinchium (Linnaeus) Parlatore 11 0 0
Lamiaceae
Lallemantia peltata (Linnaeus) Fischer & C.A. Meyer 11 0 0
Lamium album Linnaeus subsp. album 67 11 0
Lamium galeobdolon subsp. montanum (Persoon) Hayek 22 0 0
Phlomis persica Boissier 0 11 00
Phlomis olivieri Bentham 11 0 11
Salvia bracteata Banks & Solander 33 11 0
Salvia syriacasa Linnaues 11 0 0
Ziziphora capitata Linnaeus subsp. capitata 22 78 11
Liliaceae
Allium atroviolaceum Boissier 0 11 11
Allium materculae Bordzilowski 22 0 0
Allium sarawschanicum Regel 22 0 0
Allium macrochaetum Boissier & Haussknecht 11 11 0
Allium stamineum Boissier 11 11 0
Bellevalia longipes Post 11 11 0
Muscari longipes Boissier 11 0 0
Muscari caucasicum (Grisebach) Baker 44 22 0
Table 2. to be continued
Family Scientific name LDFrequency (%)MD SD
Orchidaceae Epipactis helleborine (Linnaeus) von Crantz 22 0 0
Plantaginaceae Plantago lanceolata LinnaeusPlantago major Linnaeus 1122 00 00
Poaceae
Lolium perenne Linnaeus 0 0 22
Aegilops columnaris Zhukovsky 0 0 11
Aegilops spp. 0 22 67
Aegilops triuncialis Linnaeus 0 11 11
Aegilops umbellulata Zhukovsky 22 11 0
Agropyron panormitanum Parlatore 44 11 11
Agropyron elongatiforme Drobov 0 22 0
Arrhenatherum kotschyi Boissier 11 0 11
Avena sativa Linnaeus 0 56 11
Bromus danthoniae von Trinius var. danthoniae 100 67 0
Bromus sterilis Linnaeus 0 56 67
Bromus tectorum Linnaeus var. tectorum 100 11 0
Dactylis glomerata Linnaeus subsp. glomerata 11 44 0 Eremopoa persica (von Trinius) Roshevitz var. persica 0 33 89 Heteranthelium piliferum (Banks & Solander) Hochstetter 67 67 44
Hordeum bulbosum Linnaeus 0 0 11
Milium vernale Marschall von Bieberstein 33 0 0
Poa bulbosa Linnaeus var. vivipara Koeler 89 78 56
Taeniatherum crinitum (von Schreber) Nevski 0 78 89
Polygonaceae Rumex acetosella LinnaeusRumex tuberusus Linnaeus 4456 110 00
Ranunculaceae
Ceratocephalus testiculatus (von Crantz) Roth 0 11 0 Ficaria kochii (von Ledebour) Iranshahr & Rechinger f. 11 0 0
Ranunculus arvensis Linnaeus 67 44 0
Ranunculus aucheri Boissier 67 33 11
Rosaceae
Geum urbanum Linnaeus 33 0 0
Sanguisorba minor Scopoli 0 0 11
Crataegus azarolus Linnaeus 78 11 11
Crataegus aronia (Linnaeus) Bosc ex de Candolle 33 0 22
Amygdalus communis Linnaeus 11 0 0
Pyrus syriaca Boissier 33 0 0
Pyrus glabra Boissier 33 0 0
Rosa canina Linnaeus 0 0 0
Rosa foetida Herrmann 0 0 0
Cerasus microcarpa C.A. Meyer 0 0 0
Cotoneaster nummularioides Pojarkova 22 0 0
Anacardiaceae Pistacia atlantica Desfontaines 0 11 0
Caprifoliaceae Lonicera nummulariifolia Jaubert & Spach 0 0 0
Fagaceae Quercus infectoria OlivierQuercus brantii Lindley 100100 10089 10011
Quercus libani Olivier 10 89 0
Rubiaceae
Galium aparine Linnaeus 100 44 0
Galium verum Linnaeus 67 56 0
Galium tricornutum Dandy 100 33 0
Callipeltis cucullaris (Linnaeus) de Candolle 0 0 22
Veronica orientalis Miller 22 0 0
Valerianaceae Valerianella vesicaria (Linnaeus) MoenchValerianella tuberculata Boissier 220 110 220
Aceraceae Acer cinerascens Boissier 0 0 0
Thymelaceae Daphne mucronata Royle 0 0 0
belonged to Poaceae, and 18 species (9.23%) Api-aceae had the highest amount of plant species (Fig. 1). Furthermore one species was just recorded in the families of Araceae, Cistaceae, Convolvula-ceae, CucurbitaConvolvula-ceae, GeraniaConvolvula-ceae, IridaConvolvula-ceae, Mal-vaceae, Orchidaceae, Scrophulariaceae, Anacardia-ceae, AceraAnacardia-ceae, CaprifoliaAnacardia-ceae, and Thymelaceae.
Investigating biodiversity indices of plant species in the three study areas showed that the highest value was obtained for the LD area and the lowest value was obtained for the severely disturbed area (Table 3). There are significant differences among the levels of disturbance. Rarefaction curve showed that LD forest has the highest number of species and the SD has the lowest number of species (Fig. 2). The curve of MD area is similar to the curve of the LD forest.
The results of the analyses of the soil physical and chemical properties are comprehensively presented in Table 4. The results of Tukey test (Table 4) showed that there is no significant difference in acidity, C/N, exchangeable potassium, and silt among the studied
areas (LD, MD, and SD). The organic carbon, total nitrogen, and clay mean differences are significant between the LD area and other areas. The absorbable phosphorus is significantly lowest in the SD area.
[image:8.595.62.536.50.306.2]The result of the cluster analysis showed that the sample plots are divided into three groups (Fig. 3). The samples taken at the LD area are placed in the Fig. 1. The number of plant species in each family in the study areas
41
31
19 18
11
8 8 8
5 5 5 4 4
3 3 3 2 2 2
1 1 1 1 1 1 1 1 1 1 1 1 1 0 5 10 15 20 25 30 35 40 45 A st er ac ea e Fa ba ce ae Po ac ea e A pi ace ae Ro sa ce ae C ar yo ph yll ac ea e La mia ce ae Li lia cea e Bo ra gi nac ea e Ra nun cul ac ea e Ru bi ac ea e Br ass ic ac ea e H yp er ic ace ae D ip sa ca ce ae Eu ph or bi ac ea e Fa ga ce ae Pl an ta gi na ce ae Po ly go na ce ae V al er ia na ce ae A rac ea e C ist ac ea e Convolvul ac ea e Cu cu rb ita ce ae G ra ni ac ea e Ir id ac ea e Ma lv ac ea e O rc hi da cea e Sc ro ph ul ar ia ce ae A na ca rd ia cea e Ac er ace a C ap rif ol ia ce ae Th ym el ac ea e Family
No. of sp
ec
ie
s
Table 3. Mean and standard error of diversity indices in less, moderately and severely disturbed areas
Diversity index less Disturbed areamoderately severely
Species richness 41.5 (2.13)a 32.1 (2.13)b 18.3 (2.10)c
Shannon Wiener evenness 0.88 (0.19)a 0.86 (0.18)a 0.86 (0.19)a
Shannon Wiener species diversity 3.27 (0.99)a 2.99 (0.99)b 2.4386 (0.99)c
Simpson’s species diversity 0.94 (0.12)a 0.92 (0.12)a 0.88 (0.12)b
Different letters indicate the significance differences
0 20 40 60 80 100 120 140 No .of sp ec ie s
No. of individuals
LD MD SD
2,000 4,000 6,000
[image:8.595.305.533.457.574.2]0
Fig. 2. The rarefaction curve relating to herbaceous plant in three sites
[image:8.595.62.533.664.742.2]first group, sample plots taken at the MD area are placed in the second group and sample plots from the SD area are located in the third group.
Fig. 4 is indicative of the ordination results car-ried out by DCA for the sample plots taken at the LD, MD and SD stands. The plots of the LD stand are located in the negative part of the first axis and the plots taken at the SD stand are located in the positive part of the first axis. The plots of MD area are placed around the centre coordinate axes and between the two previous sites. Therefore, the first axis can be interpreted as disturbance gradient as the intensity of disturbance is increased from the negative part of the axis towards the positive part. The correlation between soil variables and the axes of this analysis showed that clay, silt percent, and
absorbable potassium parameters are positively correlated with the first axis and while the sand percent, total nitrogen, organic carbon percent, and absorbable phosphorus are negatively corre-lated with the first axis. Other factors such as bulk density, pH, and C/N ratio have no significant cor-relation with the DCA axes.
Indicator species analysis accompanied by Monte Carlo test introduced different species with high significant indicator values as follows:
[image:9.595.63.532.74.226.2](i) Indicator species of LD area: Anthemis tinctoria Linnaeus, Apium spp., Astragalus (Incani) curvi-rostris Boissier, Bromus sterilis, Centaurea aggre-gata Fischer & C.A. Meyer ex de Candollesubsp. aggregata, Centaurea behen Linnaeus, Dactylis glomerata Linnaeus subsp. glomerata, Galium Table 4. Mean and standard error of soil physical and chemical properties in less, moderately and severely disturbed areas
Soil properties Disturbed area
less moderately severely
pH 7.3 (0.050)a 7.4 (0.082)a 7.5 (0.055)a
Organic C (%) 6.17 (1.27)a 3.32 (0.29)b 2.18 (0.25)b
Total N (%) 0.617 (0.125)a 0.330 (0.029)b 0.217 (0.024)b
C/N 9.95 (0.034)a 10.07 (0.043)a 10.06 (0.034)a
Absorbable P (mg·kg–1) 34.13(3.106)a 4.24 (26.14)a 2.24 (14.11)b
Exchangeable K (mg·kg–1) 273.78 (15.737)a 327.89 (71.11)a 350.11 (53.11)a
Clay (%) 16.4 (1.56)a 26.4 (3.50)b 29.9 (1.60)b
Silt (%) 31.6 (1.12)a 32.9 (2.46)a 42.2 (5.01)a
Sand (%) 52.0 (1.290)a 40.7 (5.722)ab 27.9 (5.64)b
Different letters indicate the significance differences
[image:9.595.66.528.261.497.2]aparine Linnaeus, Galium tricornutum Dandy, Lamium album Linnaeus subsp. album, Milium vernale Marschall von Bieberstein, Pimpinella tragium Villars, Ranunculus demissus de Can-dolle, Rumex tuberusus Linnaeus, Scorzonera mucida Rechinger f., Symphytum kurdicum Boissier & Haussknecht, Silene conoidea Lin-naeus, Tragopogon bornmuelleri M. Ownbey & Rechinger f., Tragopogon buphthalmoides (de Candolle) Boissier var. buphthalmoides, Trago-pogon vaginatus Ownbey & Rechinger f., Vicia variabilis Freyn & Sintenis;
(ii) Indicator species of MD area: Chaerophyllum macropodon Boissier, L. inconspicuus var. in-conspicuus, S. phaeopappa, Torilis leptophylla (Linnaeus) Reichenbach f., Ziziphora capitata Linnaeus subsp. capitata;
(iii) Indicator species of SD area: Aegilops triuncialis Linnaeus, Echinops orientalis von Trautvetter, Echinops haussknechii Boissier, Helianthemum ledifolium (Linnaeus) Miller var. ledifolium, Heteranthelium piliferum (Banks & Solander) Hochstetter, Taeniatherum crinitum (von Schre-ber) Nevski, Torilis heterophylla Gussone.
DISCUSSION
In this study, 195 plant taxa were recorded in the investigated oak forests in which 47 and 25 species were just recorded in LD and MD areas respective-ly. Also, 15 species were solely present in the SD ones. The presence of some of the species in the SD site was due to their resistance to grazing and trampling of human and cattle (Eshaghi Rad et al.
[image:10.595.68.446.55.291.2]2009). In this study some genus like Scariola F.W. Schmidt, Cirsium Miller, and Cousinia de Cassini of Asteraceae family were frequent only in SD area due to the destructive and animals over grazing situation (Habibi, Satarian 2013). According to cluster and DCA analysis results, the sample plots of LD, MD and SD can be classified into the three groups in which a disturbance gradient is the most important factor affecting the distribution of plant species in the region. These findings are related to large open gaps within highly disturbed patches that create a dry microclimate reducing the herba-ceous species richness (Esther et al. 2014). Large open gaps within the highly disturbed forests cre-ate a dry climcre-ate which interferes with the small amount of herbaceous establishment. This reduces herbaceous species richness and diversity in the long run. Also, because of the position of these open spaces in the highly disturbed stands, wind increases water loss from the soil surface and de-creases air humidity, which could be unfavourable for some plant species (Harper et al. 2005). Based on all calculated indices, the species richness and diversity in the LD area was higher than MD and SD areas (Table 3). Human activities, like grazing, seeding and fertilizing, can cause a serious change in biodiversity, aggravating the appearance of inva-sive species (Zimdahl 2004). In this study, a pro-gressive reduction in species richness and diversity from the LD to the SD area showed that how natu-ral communities are influenced by anthropogenic disturbances, that it agrees with findings of Bhuy-an et al. (2003) in a tropical wet evergreen forest in Arunachal Pradesh, northeast India and Mishra et al. (2004) in northeast India and Esther et
al. (2014) in Kakamega forest, western Kenya. In similar results, Majumdar and Datta (2015) il-lustrated that the effects of anthropogenic distur-bances in Northeast India resulted in declining the levels of all diversity indices. Moreover Onaindia et al. (2004) investigated the biodiversity in vari-ous destructive conditions of mixed oak forests in the north of Spain and found out that the species richness of the herbs were higher in masses with less destruction.
The results of this investigation show the signifi-cant differences in some soil physical and chemi-cal properties in three sites. Clay percentage was higher in MD and SD areas than LD and sand per-centage was vice versa. The bare soil in MD and SD areas (with low canopy cover and high soil compac-tion) were exposed to direct impact of raindrops which resulted in soil erosion. Refahi (1996) stat-ed that smaller soil particles were more sensitive to erosion. Therefore, more percentage of sand in the LD area could be related to more canopy cover and lower erosion.
Organic carbon and total nitrogen concentra-tion were higher in the LD plots than in the MD and SD ones. Reduction of these soil factors in the disturbed areas could have resulted from tra-ditional utilization and grazing livestock and the decreasing the number of trees per hectare, can-opy cover and leaf litter. Disturbance may result in degradation of soil properties (enhancement in soil compaction and decrease in soil macroporos-ity, infiltration) and may cause a decrease in site productivity (Solgi 2014). There is the risk of nutrient loss if soils are not noticed in our forest management strategies, especially where multiple disturbances may interact. Harvesting and remov-al of biomass can result in the reduction of soil nu-trients (Maynard et al. 2013).
The difference in the ability of plants, especially trees, in changing soil environment, mainly occurs due to increases in organic matter and its effect on nutrient cycling (Salehi et al. 2005). On the other hand, the canopy of trees and shrubs prevent the formation of soil crusts, which would increase infiltration capacity and soil moisture (Janeau et al. 1999; Pariente 2002). So, in SD area with less than 10% canopy of trees the bare soil is exposed to direct radiation and wind, which promotes higher evaporation. Also, it is subjected to the direct im-pact of raindrops and therefore experiences high-er soil compaction. These bare soil features lead to drier conditions and poor organic matter and nutrient content (Rostagno, del Valle 1988). In this context, Moreno et al. (2007) stated that
harvesting trees and pollarding them leads to the reduction of organic matter and soil quality. Bick-ham (2013) found significant depletions in soil moisture following salvage-logging and total soil carbon and nitrogen levels will be lower in logged areas than control areas. The remarkable changes of soil characteristics that represent soil fertility can have great influences on ecosystem stability, success of future regeneration and structure of plant communities (Mokarram Keshtiban et al. 2013).
CONCLUSIONS
In general, the results of the current study illus-trated that LD forests were more diverse than MD and SD areas of oak forests in Zagros forests. By increasing the intensity of destruction, the num-ber of species would be decreased and the com-munity structure and species composition would be changed. Also, anthropogenic disturbance de-creased the amount of organic matter (carbon and nitrogen) according to the degree of man-made disturbances. Therefore, a comprehensive program should be considered for forest conservation in this region and to transform the highly disturbed forests to moderately disturbed ones in the short time plan.
References
Augusto L., Ranger J., Binkley D., Rothe A. (2002): Impact of several common tree species of European temperate forests on soil fertility. Annals of Forest Science, 59: 233–253. Bell F., Lamb E., Sharma M., Hunt S., Madhur A., Dacosta J.
(2016): Relative influence of climate, soils, and disturbance on plant species richness in northern temperate and boreal forests. Forest Ecology and Management, 381: 93–105. Bhuyan P., Khan M.L., Tripathi R.S. (2003): Tree diversity
and population structure in undisturbed and human-im-pacted stands of tropical wet evergreen forest in Arunachal Pradesh, Eastern Himalayas, India. Biodiversity and Con-servation, 12: 1753–1773.
Bickham K.K. (2013): Long-term Effects of Multiple Dis-turbances on Soil Properties and Regeneration in a Colo-rado Subalpine Forest. Boulder, University of ColoColo-rado at Boulder: 35.
Blanco L., Pereira V. (2015): Anthropogenic disturbances and the natural vegetation regeneration: A case study of forest fragment located in a cuesta relief area, state of São Paulo, Brazil. Open Journal of Forestry, 5: 621–635.
erosion in Italian forests: First comprehensive monitoring and modelling approach. Catena, 149: 770–781.
Ehrlich P.R., Wilson E. (1991): Biodiversity studies: Science and policy. Science, 253: 758–762.
Eshaghi Rad J., Heidari M., Mahdavi A., Zeinivandzadeh M. (2009): Impact of recreational activities on vegetation and soil in forest park (case study: Choghasabz forest park – Ilam). Iranian Journal of Forest, 3: 71–80.
Esther V., Martha K., Harrison T., Lenard O., Charles K., Stella W., Humphrey N. (2014): The impacts of human activities on tree species richness and diversity in Kakamega Forest, Western Kenya. International Journal of Biodiversity and Conservation, 6: 428–435.
Fattahi M. (1995): The Study of Zagros’ Oak Forests and the Most Important Factors of Its Destruction. Tehran, Re-search Institute of Forests and Rangelands: 63. (in Persian) Fu B.J., Liu S.L., Ma K.M., Zhu Y.G. (2004): Relationships
between soil characteristics, topography and plant diversity in a heterogeneous deciduous broad-leaved forest near Beijing, China. Plant and Soil, 261: 47–54.
Ghazanfari H. (2004): Study of growth and diameter distri-bution in order to preparing the forest regulation method in Baneh region (case study: Havare khol). [Ph.D. Thesis.] Tehran, University of Tehran: 82.
Gömöryová E., Střelcová K., Škvarenina J., Bebej J., Gömöry D. (2008): The impact of windthrow and fire disturbances on selected soil properties in the Tatra National Park. Soil and Water Research, 3 (Special Issue 1): S74–S80. Habibi M., Satarian A. (2013): Study of flora, life forms and
geographical distribution of plants in ecosystems of Pay-band National Park, Mazandaran province. Journal of Plant Ecosystem Conservation, 1: 47–72.
Harper K.A., MacDonald S., Barton P., Chen J., Brosoffske K. (2005): Edge influence of forest structure and composi-tion in fragmented landscapes. Conservacomposi-tion Biology, 19: 768–782.
Janeau J.L., Mauchamp A., Tarin G. (1999): The soil surface characteristics of vegetation stripes in Northern Mexico and their influences on system hydrodynamics: An experi-mental approach. Catena, 37: 165–173.
Latty E.F., Canham C.D., Marks P.L. (2004): The effects of land-use history on soil properties and nutrient dynamics in northern hardwood forests of the Adirondack Moun-tains. Ecosystems, 7: 193–207.
Linares J.C., Carreira J.A., Ochoa V. (2011): Human im-pacts drive forest structure and diversity. Insights from Mediterranean mountain forest dominated by Abies pinsapo (Boiss). European Journal of Forest Research, 130: 533–542.
Magurran A.E. (2004): The commonness, and rarity, of spe-cies. In: Measuring Biological Diversity. Oxford, Blackwell Science, Ltd.: 18–71.
Majumdar K., Datta B.K. (2015): Effects of anthropogenic disturbances on vegetation diversity and structure: A
case study in the remnant forests surrounding the village ecosystems of Tripura, Northeast India. Chinese Journal of Population Resources and Environment, 13: 332–340. Maynard D.G., Paré D., Thiffault E., Lafleur B., Hogg K.E.,
Kishchuk B. (2013): How do natural disturbance and hu-man activities affect soils and tree nutrition and growth in the Canadian boreal forest? Environmental Reviews, 22: 161–178.
McCune B., Grace J. (2002): Analysis of Ecological Communi-ties. Gleneden Beach, MjM Software Design: 300. Mishra B.P., Tripathi O.P., Tripathi R.S., Pandey H.N. (2004):
Effects of anthropogenic disturbance on plant diversity and community structure of a sacred grove in Megha-laya, northeast India. Biodiversity and Conservation, 13: 421–436.
Mligo C. (2011): Antropogenic disturbance on the vegetation in Makurnge woodland, Bagamoyo District, Tanzania. Tanzania Journal of Science, 37: 94–108.
Mokarram Keshtiban S., Mousavi Mirkala S.R., Eshaghi Rad J. (2013): Impact of traditional operation on woody plant species in different height classes of Sardasht, Iran. [MSc Thesis.] Urmia, Urmia University: 122.
Moreno G., Obrador J.J., García A. (2007): Impact of ev-ergreen oaks on soil fertility and crop production in intercropped dehesas. Agriculture, Ecosystems and Envi-ronment, 119: 270–280.
Onaindia M., Domiguez I., Albizu I., Garbisu C., Amezage I. (2004): Vegetation diversity and vertical structure as indicators of forest disturbance. Forest Ecology and Man-agement, 195: 341–354.
Pariente S. (2002): Spatial patterns of soil moisture as affected by shrubs, in different climatic conditions. Environmental Monitoring and Assessment, 73: 237–251.
Pourbabaei H., Navgran S. (2011): Study on floristic and plant species diversity in the Lebanon oak (Quercus libani) site, Chenareh, Marivan, Kordestan province. Western Iran Biocenose Journal, 3: 15–22.
Refahi H. (1996): Soil Erosion and Its control. Tehran, Uni-versity of Tehran Press: 551.
Robert M.R., Gilliam F.S. (1995): Patterns and mechanisms of plant diversity in forested ecosystems: Implications for forest management. Ecological Applications, 5: 969–977. Rostagno C.M., del Valle H.F. (1988): Mounds associated
with shrubs in aridic soils of northeastern Patagonia: Characteristics and probable genesis. Catena, 15: 347–359. Ruprecht E., Szabó A., Enyedi M.Z., Dengler J. (2009): Stepp-like grasslands in Transylvania (Romania): Characterisation and influence of management on species diversity and composition. Tuexenia, 29: 353–368.
Scott C.R., Corman S.R., Cheney G. (1998): Development of a structurational model of identification in the organization. Communication Theory, 8: 298–336.
Shaheen H., Qureshi R.A., Shinwari Z.K. (2001): Structural diversity, vegetation dynamics and anthropogenic impact on lesser Himalayan subtropical forests of Bagh district, Kashmir. Pakistan Journal of Botany, 43: 1861–1866. Shrestha K., Maren E., Arneberg E., Sah P., Vetaas R. (2012):
Effect of anthropogenic disturbance on plant species diver-sity in oak forests in Nepal, Central Himalaya. International
Journal of Biodiversity Science, Ecosystem Services & Management, 9: 21–29.
Solgi A., Najafi A. (2014): The impacts of ground-based log-ging equipment of forest soil. Journal of Forest Science, 60: 28–34.
Zimdahl R.L. (2004): Weed-crop Competition: A Review. Oxford, Blackwell Publishing: 220.