MGF Based Performance Analysis of Digital
Wireless System in Urban Shadowing Environment
Abdulbaset Hamed,
Member
,
IAENG
, Mohammad Alsharef,
Member
,
IAENG
, and Raveendra K. Rao
Abstract—In this paper, a composite Rayleigh-Gamma distri-bution is proposed for the urban wireless channel environment which represents small-scale fading with no Line of sight (LoS) and shadowing. Moment Generation Function (MGF) and truncated MGF for the proposed model are derived. Using these MGFs, the performance of digital communication systems is investigated in terms of channel capacity and bit error rate probability. Results show that the performance is adversely affected by the urban channel environment. Thus, an adaptive M-QAM technique is proposed to enhance the system performance. With the aid of truncated MGF, the performance of adaptiveM-QAM system is evaluated in terms of outage probability, system capacity (bit/s/Hz) and average bit error probability. The proposed adaptive technique shows high potential for achieving significant system capacity while maintaining acceptable bit error probability even under severe channel effects.
Index Terms—Urban channel, channel capacity, adaptive modulation, outage probability, bit error rate.
I. INTRODUCTION
W
IRELESS channel in an urban environment intro-duces serious impairments such as small and large scale fading which cause serious degradation in the signal to noise ratio (SNR) leading to poor system performance. Small-scale fading is manly caused by multi-path fading due to reflection and diffraction [1]. The large-scale fading consists of two portions: path loss and shadowing. Path loss measures the average radio wave energy decay as a function of distance, frequency, and other location specific parameters. Shadowing is caused by the variability associated with large scale environmental obstacles. In [2], an urban wireless channel model based on path loss measurements for Cambridge, Massachusetts city is proposed. In [3], physical statistical characteristics of urban canyons are incorporated to estimate parameters of satellite urban channel model. Validation of large-scale fading channel for urban wireless channel has been carried out in [4]. Since urban wireless channel environment simultaneously subjects small scale and large scale fading, it is required to describe these effects using a composite model. Composite Rayleigh-Gamma (RG) distribution is considered in this paper in which the signal envelope is conditionally Rayleigh distributed and the signal power is modelled by Gamma distribution [5],[6]. Some works for evaluating the performance of communication system in shadowing multipath channel are available. Outage probability and channel capacity were investigated by using Nakagami-Inverse Gaussian channel model in [7]. Trigui et. al. have presented an analytical framework for performance evaluation of mobile radio systems operating in compositeA. Hamed, M. Alsharef and Dr. R. Rao are with the Innovation Centre for Information Engineering (ICIE), Department of Electrical and Computer Engineering, the University of Western Ontario, London ON, Canada N6A 5B9 (e-mails:{ahamed6, malshare, rrao}@uwo.ca)
fading/shadowing channels in the presence of co-channel interference in [8]. The MGF approach is proposed for the computation of the channel capacity only and outage proba-bility by using numerical techniques [9]. A novel MGF based approach is developed for evaluation of channel capacity for various rate adaptations and transmit power in [10]. Several techniques have been proposed to enhance the performance of digital communication systems operating over fading channels. One of these techniques is adaptive modulation which can be effectively used to achieve significant capacity improvement over wireless channels subjected to fading and shadowing [11] [12].
In this work, performance of shadowing multipath with no LoS wireless channel is analyzed by using MGF based approach. Employing and analyzing adaptive modulation technique over shadowing urban wireless channel has not been addressed. In particular, a statistical distribution model approach including MGF is used to examine the performance of adaptiveM-QAM modulation over RG channel.
The work is organized as follows: In Section II, shadowing multipath urban wireless channel model is presented; more-over, statistical characteristics of RG distribution are derived including MGF and truncated MGF. Section III addresses the channel capacity and bit error rate performance analysis for RG wireless channel using MGF based approach. In Section IV, an adaptive M-QAM technique is proposed for RG channel, using truncated MGF, to improve the performance. Finally, the work is concluded in Section V.
II. URBANSHADOWINGCHANNELENVIRONMENT
MODEL
Modeling urban wireless channel environment is essential when designing a digital communication system, particularly in congested areas such as city’s downtown. Urban wireless channel introduces small-scale and large-scale fading which degrade performance of the system. Let the equivalent base-band received signal be:
r=X s + n (1)
statistically model the shadowing multi-path urban wireless channel, composite Rayleigh-Gamma (RG) distribution is proposed that accounts for small and large fading effects. The composite model can be obtained by averaging the gamma PDF of SNR over the conditional Rayleigh PDF of average SNR. Hence, Rayleigh-Gamma distribution is given by [6]:
pγ(γ) =
2cγ
c+1 2
Γ(c) γ
c−1 2 Kc−1
r 4cγ
γ
, γ≥0 (2)
WhereKc−1(.)is the modified second order Bessel function,
γ = α2Es/No is the SNR, γ = ΩcEs/No is the average
SNR, Es = E[s2] is the signal energy, Ω = E[X2]/c and
No represents AWGN power spectral density. RG
distribu-tion is controlled by large scale fading parameter c. As c
increases the shadowing becomes less severe and the channel approaches Rayleigh channel. The cumulative distribution function (CDF) of shadowing urban wireless channel is obtained using P(γ1) =
Rγ1
0 pγ(γ)dγ and is given by:
P(γ1) = 1−
2 Γ(c)
rcγ
1
γ c
Kc
r4cγ
1
γ
, γ1≥0 (3)
The moment generation function (MGF) of the channel model in (2) can be derived by using the definition [1]:
Mγ(s),e−sγ =
∞ Z
0
exp(−sγ)pγ(γ)dγ (4)
MGF is obtained By substituting the PDF of the chan-nel distribution (2) into (4) and expressing the exponen-tial term in (4) using Meijer G function as exp(−sγ) = G10,,01 sγ
0
, and Kc−1
q4γ
γ
= 1
2G 2,0 0,2
γ
γ
c−1
2 , 1−c
2
using [14, eq. (8.4.3/1),(8.4.23/1)]. The closed form MGF of
γ is derived with the aid of [15, eq.(07.34.21.0011.01)] and can be expressed as:
Mγ(s) =
1 Γ(c)G
1,2 2,1
sγ c
1−c, 0 0
!
(5)
Several numerical techniques have been used to evaluate the truncated MGF [8] [9]; however, truncated MGF of shadowing urban fading channel distribution can be obtained in closed form. Truncated MGF is given by [10]:
c
Mγ(s, γk), γk Z
0
exp(−sγ)p(γ)dγ (6)
The truncated MGF can be derived by expanding the ex-ponential term using Taylor series and then performing integration. Thus,
c
Mγ(s, γk) = γk Z
0
γc−21
∞ X
m=0
(−sγ)m
m! Kc−1
r4cγ
γ
dγ (7)
By expressing Kc−1(.) using Meijier G-function and with
the aid [15, eq.(03.04.21.0021.01)] , the truncated MGF in
closed form becomes:
c
Mγ(s, γk) =
cγk γ
c+12
Γ(c)
∞ X
m=0
(−sγk)m
m! πcsc
2π
1−c
2
×
Γ(c+m)
cγk
γ c−21
1F2
c+m, c;c+m+ 1;cγk
γ
−
Γ(m+ 1)
cγk
γ −c−21
1F2
m+ 1,−c;m+ 2;cγk
γ
(8)
where 1F2(., .;.) is the generalized hypergeometric
func-tion [13]. Because the value of 1F2 decreases rapidly as
m increases, it is sufficient to consider finite number of terms in the summation. The nth order moment of γ is defined as mn ,Ehγni and can be obtained using mn =
R∞ 0 γ
np γ(γ)dγ.
By using (2), thenthorder moment becomes:
mn =
γ−c+12
Γ(c)
Z ∞
0
γc−21+n G2,0
0,2
γ cγ
c−1 2 ,
1−c
2 !
dγ (9)
The integral (6) can be solved using [14, eq(2.24.1/1)]; thus
mn can be written as:
mn=
γ c
n
Γ(c+n/2)Γ(1 +n/2)
Γ(c) (10)
The fading and shadowing effects can also be described by the amount of fading (AF), whereAF = E(γ(2E)−[γ(])E2[γ])2 [1]. Thus, AF can be obtained from thenth order moment ofγ
as AF = 1 + 2c. From this formula, it can be shown that as c→ ∞ there is no shadowing effect and RG approaches Rayleigh distribution.
III. MGF BASEDAPPROACHPERFORMANCEANALYSIS
The performance over shadowing urban fading channel can be evaluated in terms of channel capacity and bit error rate probability using MGF based approach for M-QAM modulation technique .
A. Channel Capacity
Channel capacity is investigated accordingly as the chan-nel side information (CSI) that is available at either the transmitter or at the receiver. Two cases of CSI availability are considered in this paper. First, when the CSI is available at the receiver under a constant optimal power rate adaptation to channel fading. Second, when the transmitter adapts its power to keep the received SNR constant. For the first case, the channel capacity in bits/s/Hz cab be obtained using [10]:
Cora=
1 log 2
∞ Z
0
Ei(−s)Mγ(1)(s) ds (11)
where Ei(.) denotes the exponential integral function. The
quantity Mγ(1)(s) is the first derivative of the MGF and
can be derived using[15, eq.(07.34.20.0001.01)]. For the shadowing urban channel, the first derivative of MGF is obtained as:
Mγ(1)(s) = s Γ(c+ 1)G
1,3 3,2
sγ c
−1,−c,−1 −1,0
!
By expressing Ei(−s) = −G
2,0 1,2
s| 1 0,0
[14, eq.(8.4.11/1)]in (11), a closed form expression for channel capacity can be obtained as [15, eq.(07.34.21.0011.01)]:
Cora =
1 log 2Γ(c)G
1,4 4,2
γ c
1,1,1−c,0 1,0
!
(13)
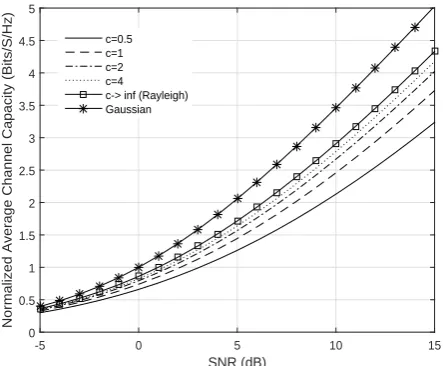
The optimal power rate adaptation channel capacity,Corain
bit/s/Hz for shadowing urban channel is plotted as a function of SNR for several values of cin Fig. 1. As expected,Cora
is always less than the capacity provided by Rayleigh and AWGN channels, and it improves asc increases.
SNR (dB)
-5 0 5 10 15
Normalized Average Channel Capacity (Bits/S/Hz)
0 0.5 1 1.5 2 2.5 3 3.5 4 4.5 5
[image:3.595.318.538.63.246.2]c=0.5 c=1 c=2 c=4 c-> inf (Rayleigh) Gaussian
Fig. 1: Channel capacity with side information at the receiver as a function of SNR for different values ofc
For the second case, the fading channel is inverted; hence the capacity becomes channel capacity with channel inver-sion(Ccif r). In this case,Ccif r can be obtained using [10]
and is given by:
Ccif r= log2
1 + ∞ 1
R
0
Mγ(s) ds
(14)
The quantity Ccif r is derived by substituting MGF
from (5) in (14) and evaluating the integral using [15, eq.(07.34.21.0009.01)]. The channel capacity is thus given by:
Ccif r=log2
1 + Γ(c)γ cΓ(c−1)
(15)
The channel capacityCcif r, for shadowing urban channel is
plotted as a function of SNR for different values of channel parametercin Fig. 2. It is noted that the capacity is impacted by channel impairments for small values ofc.
B. Bit Error Rate Performance
Bit error rate probability of digital communication system in a shadowing urban environment is investigated by using MGF approach. The analysis presented is valid for any arbitrary modulation technique; however, the investigation is presented forM-QAM modulation technique as an example. The BER of M-QAM for AWGN channel can be tightly
SNR, (dB)
-5 0 5 10 15
Channel Capacity With Channel Inversion (bits/s/Hz) 0 0.5 1 1.5 2 2.5 3 3.5 4 4.5 5
[image:3.595.60.282.214.397.2]c=1.1 c=1.5 c=2 c=4 AWGN
Fig. 2: Channel capacity With channel Inversion as a function of SNR for different values of c
bounded using the approximation given in [11] and thus the average BER using MGF approach can be shown to be given by:
pe(γ, M)≤0.2 exp
− 1.5γ
M −1
, γ ≥0, M ≥4 (16)
The average bit error probability (pe) for a given modulation
over a fading channel can be determined by averaging the error probability for a givenγ over the Probability Density Function (PDF) ofγ as:
pe=
Z ∞
0
pe(γ, M)pγ(γ)dγ (17)
The performance ofM-QAM system operating in shadowing urban fading channel can be obtained by substituting (16) in (17) which yields:
pe= 0.2 ∞ Z
0
exp
− 1.5
M −1γ
pγ(γ)dγ (18)
Using the MGF approach and comparing (18) with (4),pe
can be easily derived and expressed as:
pe= 0.2Mγ(s)|s= 1.5
M−1
= 0.2 Γ (c)G
1,2 2,1
1.5 γ c(M −1)
(1−c),0 0
!
(19)
As an illustration example,pe of 16-QAM system for shad-owing urban channel is plotted as a function of SNR and channel parameter in Fig.3. The performances of AWGN and Rayleigh channel are also plotted for comparison. It is observed that ascincreases the performance is improved and for a large values of c, the pe approaches the performance of Rayleigh channel.
IV. PERFORMANCEIMPROVEMENTUSINGADAPTIVE
M-QAM TECHNIQUE
SNR, (dB)
0 5 10 15 20 25 30 35 40
Average BER of 16-QAM10-3
10-2
10-1 c=1c=1.5
[image:4.595.349.492.50.277.2]c=2 c=5 Rayleigh AWGN
Fig. 3: Average BER of 16-QAM system as a function of SNR for different shadowing factorc
impairments. Thus, maintaining an acceptable system perfor-mance is an essential objective for any digital communication system. Thus, in this paper, an adaptiveM-QAM modulation technique for shadowing fading channel is proposed to improve the channel capacity while maintaining certain level of bit error rate performance.
A. Adaptive M-QAM System Model
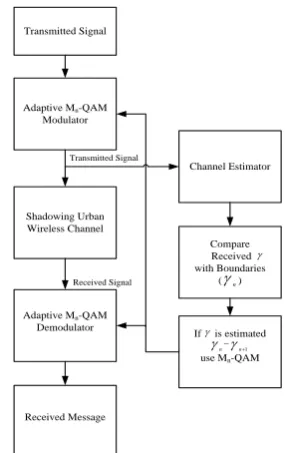
The basic concept of adaptive modulation technique is based on the fact that the modulator and demodulator are configured simultaneously with the same constellation size,
M, and according to SNR γ estimation that is required to achieve targeted BER as shown in Fig. 4. Therefore, mapping
γ to the modulation level is the fundamental point to switch constellation size,M; thus, the range ofγis divided intoN
regions in order to decide whichM-QAM is used when the estimated γ falls in thenthregion. Each region is specified with boundaries, γn,γn+1, which are determined to obtain
the target BER (10−3) and are indicated in Table I. It is
assumed that whenγis estimated belowγ1, the transmission
is suspended.
TABLE I: γn BOUNDARIES
Moden M γn–γn+1[dB]
1 4 10.2-13.9
2 8 13.9-17.2
3 16 17.2-20.4
4 32 20.4-23.5
5 64 23.5 -∞
B. Performance Analysis of Adaptive M-QAM technique
In this section, the performance of adaptive M-QAM modulation over shadowing multi-path urban channel that is modeled by (2), is evaluated in terms of outage probability
Po, average system capacity C, and average bit error rate
probability, p.
Transmitted Signal
Shadowing Urban Wireless Channel Adaptive Mn-QAM
Modulator
Received Message Adaptive Mn-QAM
Demodulator
Channel Estimator
If is estimated
use Mn-QAM
Compare Received with Boundaries
( )
Received Signal Transmitted Signal
1 n n
n
[image:4.595.56.292.62.249.2]
Fig. 4: Block diagram of M-QAM adaptive modulation technique
1) Outage probability: Since the transmission is sus-pended when the received γ falls below γ1, the M-QAM
adaptive modulation suffers an outage probability, which can be obtained using Po =
Rγ1
0 pγ(γ) dγ. Thus, Po can be
obtained directly from (3) whereγ1= 10.2 dB is calculated
using (16) forpe= 10−3.Pois plotted in Fig. 5 as a function
of SNR for several values of channel parameter. It is noted that the outage probabilityPoimproves ascincreases, which
implies that the shadowing effects become less severe.
SNR, (dB)
0 5 10 15 20 25 30
Outage Probability
10-2 10-1 100
c=1 c=1.5 c=2 c=4
Fig. 5: Outage probability as a function of SNR for different values ofc
2) Average System Capacity (bits/s/Hz): Average system capacityC is the sum of data rates (log2M) corresponding toN regions each weighted by the probability that γ falls in thenth region,P
r(n) and is given by [11] :
C=
N
X
n=1
[image:4.595.312.539.465.650.2] [image:4.595.107.228.609.672.2]where Pr(n) =
Rγn+1
γn pγ(γ)dγ and can be directly
calcu-lated from (3) as:
Pr(n) =
2 Γ(c)
rcγ
n+1
γ c
Kc
r4cγ
n+1
γ
−
rcγ
n
γ c
Kc
r4cγ
n
γ
(21)
SNR, (dB)
0 5 10 15 20 25 30 35 40
Spectrum Efficiency (bits/s/Hz)
0 1 2 3 4 5 6
c=1, N=5 c=1.5, N=5 c=2, N=5 c=4, N=5 c=1, N=3 c=1.5, N=3 c=2, N=3 c=4, N=3
N=5
[image:5.595.59.288.81.354.2]N=3
Fig. 6: Average capacity of adaptive modulation technique versus SNR for different values ofc
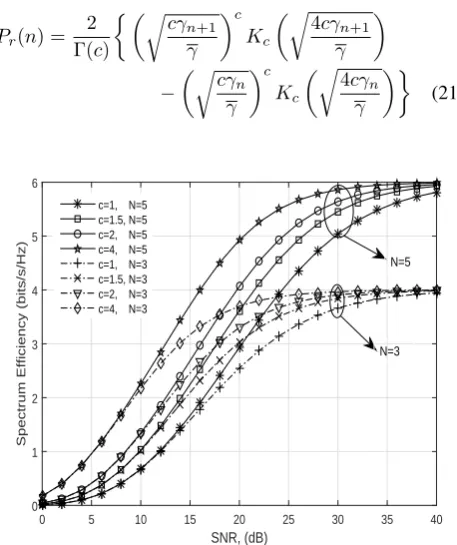
Fig. 6 shows the average capacity(bits/s/Hz)of adaptive
M-QAM for three (N = 3) and five (N = 5) regions as a function of SNR for various channel parameters c. It is observed that the overall system capacity is improved as the adaptive system utilizes high constellation size. Also, the adaptive modulation shows a good adaptation with channel conditions.
C. Average Bit Error Rate
The proposed adaptive modulation technique is designed based on disjoint SNR regions for targeted BER. Thus, average BER (p) is calculated by averaging the BER for all SNR regions. This can be computed exactly as the ratio of the average number of bits in error over the total average number of transmitted bits and is given by [11]:
p= 1 C
N
X
n=1
(log2M)pn (22)
Wherepnis average AWGN bit error rate fornthregion and
can be obtained using:
pn = γn+1
Z
γn
pe(γ, M) pγ(γ)dγ (23)
By substituting (16) into (23),pn can be written as:
pn= 0.2
γn+1
Z
0
exp
− 1.5γ
M −1
pγ(γ)dγ
−0.2
γn Z
0
exp
− 1.5γ
M−1
pγ(γ)dγ (24)
By comparing (24) with (6) which is the definition of truncated MGF,pn can be obtained directly as:
pn= 0.2Mcγ(s, γn+1)|s= 1.5
M−1 −0.2Mcγ(s, γn)|s=M1.−51 (25) Average bit error rate of the proposed adaptiveM-QAM for
nregions is derived by using truncated MGF. Fig. 7 shows
pn for (N = 3) and (N = 5) as a function of SNR and for
different values ofc. It is clear that the adaptive modulation technique maintains the target BER(10−3)for all values ofc.
Also, for high values of SNR, the performance is dominated by the highly utilizedM-QAM modulation level.
SNR, (dB)
0 5 10 15 20 25 30 35 40
Bit Error Rate
10-6 10-5 10-4 10-3
c=1, N=5 c=1.5, N=5 c=2, N=5 c=4, N=5 c=1, N=3 c=1.5, N=3 c=2, N=3 c=4, N=3 N=5
N=3
Fig. 7: Average bit error rate of adaptive modulation technique as function ofγ for different values of c
V. CONCLUSION
The performance ofM-QAM digital modulation has been evaluated over multi-path superimposed on shadowing urban channel environment in terms of two important system pa-rameters: average BER and channel capacity. For the channel capacity analysis, two different CSI availability cases were assumed, one is when the CSI is available at the receiver under a constant power rate adaptation and another is when the transmitter adapts its power to keep the received SNR constant. It is observed that the capacity decreases due to the shadowing effect and is slightly better in the second case. To cope with the deterioration in the BER performance and channel capacity due to shadowing effect, an adaptive mod-ulation technique based on target BER has been suggested and explained. The performance of the proposed technique has been analyzed in terms of outage probability, average system capacity and average bit error rate probability. It is found that as the number of disjoint of SNR regions increases, the capacity significantly improves but at the cost of BER performance degradation. The proposed system not only improves system capacity but also provides the trade-off between capacity and BER performance; hence, trade-offers flexibility in the design of digital communication system.
ACKNOWLEDGMENT
[image:5.595.316.538.217.401.2]REFERENCES
[1] M. K. Simon and M.-S. Alouini, Digital Communication over Fading Channels, 2nd ed. New York: Wiley, 2005.
[2] Herring, K.T.; Holloway, J.W.; Staelin, D.H.; Bliss, D.W., “Path-Loss Characteristics of Urban Wireless Channels,” Antennas and Propagation, IEEE Transactions on , vol.58, no.1, pp.171,177, Jan. 2010
[3] Seyedi, Y.; Shirazi, M.; Moharrer, A.; Safavi, S.M.; Amindavar, H., “Use of Shadowing Moments to Statistically Model Mobile Satellite Channels in Urban Environments,” Wireless Communications, IEEE Transactions on , vol.12, no.8, pp.3760,3769, August 2013
[4] Kuruganti, T.; Xiao Ma; Djouadi, S., “Experimental validation of stochastic wireless Urban channel model: Estimation and prediction,” MILITARY COMMUNICATIONS CONFERENCE, 2012 - MILCOM 2012 , vol., no., pp.1,5, Oct. 29 2012-Nov. 1 2012
[5] P.M. Shankar: Fading and Shadowing in Wireless Systems, Springer Science and Business Media, Philadelphia, PA, USA, 2012. [6] A. Abdi and M. Kaveh, “K distribution: An appropriate substitute for
Rayleighlognormal distribution in fading-shadowing wireless channels, Electron. Lett., vol. 34, April 30, 1998, pp. 851852.
[7] Laourine, A.; Alouini, M.-S.; Affes, S.; Stephenne, A., “On the per-formance analysis of composite multipath/shadowing channels using the G-distribution,” Communications, IEEE Transactions on , vol.57, no.4, pp.1162,1170, April 2009
[8] Trigui, I.; Laourine, A.; Affes, S.; Stephenne, A., “Performance analysis of mobile radio systems over composite fading/shadowing channels with co-located interference,” Wireless Communications, IEEE Transactions on , vol.8, no.7, pp.3448,3453, July 2009 [9] Palat, R.C.; Annamalai, A.; Reed, J., ”An Efficient Method for
Evaluat-ing Information Outage Probability and Ergodic Capacity of OSTBC System,” Communications Letters, IEEE , vol.12, no.3, pp.191,193, March 2008
[10] Di Renzo, M.; Graziosi, F.; Santucci, F., “Channel Capacity Over Generalized Fading Channels: A Novel MGF-Based Approach for Performance Analysis and Design of Wireless Communication Sys-tems,” Vehicular Technology, IEEE Transactions on , vol.59, no.1, pp.127,149, Jan. 2010
[11] M. Alouini and A. Goldsmith, “Adaptive Modulation over Nakagami Fading Channels,”Wireless Personal Communications,vol.13, pp.119-143, 2000.
[12] K.J. Hole, H.Holm, G.E. Oien, “Adaptive multidimensional coded modulation over flat fading channels,”Selected Areas in Communi-cations, IEEE Journal,vol.18, pp.1153-1158, July 2000.
[13] I.S. Gradshteyn and I.M. Ryzhik, Table of Integrals, Series, and Products,7th ed. San Diego, CA, Elsevier Inc, 2007.
[14] A. P. Prudnikov, Yu. A. Brychkov, and O. I. Marichev, Integrals and series. Vol. 3, Gordon and Breach Science Publishers, New York, 1990. More special functions; Translated from the Russian by G. G. Gould. MR 1054647 (91c:33001)