Fruit Disease Classification based on Texture Features
Ranjit K. N.
Department of Computer Science & Engineering
HKBK Engineering College, Bangaluru, Karnataka, India
Naveen C.
Department of Computer Science & Engineering
HKBK Engineering College, Bangaluru, Karnataka, India
Chethan H. K.
Department of Computer Science & Engineering
Maharaja Institute of Technology, Mysuru, Karnataka, India
ABSTRACT
Nowadays digitization and automation of machine in agriculture field plays prominent role. In this paper, we have proposed method to classify fruit as diseased and non-diseased. Firstly, we used K means clustering method for segmentation of diseased regions. Later, we used to extract texture features on segmented diseased regions. We have collected fruit diseased images from internet to create dataset and totally we have collect 2500 images from 10 fruit classes. We have conducted extensive experimentation using Probabilistic Neural Network and results shows that proposed method gives better performance compared to SVM and KNN.
Keywords
Fruit disease, K-Means, Texture, LBP, Neural Network
1.
INTRODUCTION
Agriculture is the mother of all cultures. It has played a key role in the development of human civilization. Agricultural production system is an outcome of a complex interaction of soil, seed and agro chemicals (including fertilizers). Therefore, there is need to take good judgment for management of all the inputs is essential for the sustainability of a complex system. The focus on increasing the productivity, without considering the ecological impacts has resulted into environmental degradation. Diseases and insect pests are the major problems in agriculture. These require careful diagnosis and timely handling to protect the crops from heavy losses. Fruit diseases can cause significant losses in yield and quality appeared in harvesting. For example, soybean rust (a fungal disease in soybeans) has caused a significant economic loss and just by removing 20% of the infection, the farmers may benefit with an approximately 11 million-dollar profit (Roberts et al., 2006). Some fruit diseases also infect other areas of the tree causing diseases of twigs, leaves and branches. An early detection of fruit diseases can aid in decreasing such losses and can stop further spread of diseases. In plant, diseases can be found in various parts such as fruit, stem and leaves. In development of India there is major contribution of agricultural field. There are so many fruits like apple, oranges, mango and grapes etc. that are exported from India and give more profit to the farmers. Diseases in fruit cause devastating problem in economic losses and production in agricultural industry worldwide. Generally the naked eye method is used to identify the diseases. In this method experts are involved who have the ability to detect the changes in leaf color. This method involves lots of efforts, takes long time and also not practical for the large fields. Many times different experts identify the same disease as the different disease. This method is expensive as it requires continuous monitoring of experts. Apple fruit diseases can cause major losses in yield and quality appeared in harvesting. To know what control factors to take next year to avoid losses, it is crucial to recognize
what is being observed. Some common diseases of apple fruits are apple scab, apple rot, and apple blotch [5], Apple scabs are gray or brown corky spots. Apple rot infections produce slightly sunken, circular brown or black spots that may be covered by a red halo. Apple blotch is a fungal disease and appears on the surface of the fruit as dark, irregular or lobed edges.
2.
RELATED WORK
12 simultaneously they have also used multi-spectral
fluorescence images using UV-blue excitation on the same specimen. In [8], the authors have used fluorescence imaging and compared it to the visual development of diseases of tobacco mosaic virus infection in resistant tobacco. Large scale plantation of oil palm trees requires on-time detection of diseases as the ganoderma basal stem rot disease was present in more than in Peninsular Malaysia 50% of the oil palm plantations. To deal with this problem, airborne hyperspectral imagery offers a better solution [10] in order to detect and map the oil palm trees that were affected by the disease on time. Citrus canker is among the most devastating diseases that affect marketability of citrus crops. In [11], a hyper-spectral imaging approach is developed for detecting canker lesions on citrus fruit and hyper-spectral imaging system is developed for acquiring reflectance images from citrus samples in the spectral region from 450 to 930 nm. In [13], the authors have investigated the power of NIR spectroscopy as an alternative to rate clones of sugarcane leaf spectra from direct measurement and examined its potential using a calibration model to successfully predict resistance ratings based on a chemometrics approach such as partial least squares. Marcassa et al. [14] have applied laser-induced fluorescence spectroscopy to investigate biological processes in orange trees. They have investigated water stress and Citrus Canker, which is a disease produced by the Xanthomonas axonopodis pvcitri. Lins et al. [16] have developed an optical technique to detect and diagnose citrus canker in citrus plants with a portable field spectrometer unit. In [18], the authors have investigated the use of hyper-spectral methods caused by apple scab for early detection of plant stress to move towards more reduced and efficient application of fertilizers, pesticides or other crop management treatments for the apple orchards.
3.
PROPOSED METHOD
In this section, first part shows how the method segment the diseased area using K-Means clustering and second part describes the different textures features extraction on segmented diseased area. Then feed the feature vector to Probabilistic Neural network and also compared with the traditional classifiers.
3.1
Image Segmentation
K-Means clustering technique is used for the image segmentation. K-Means clustering algorithm was developed by J. MacQueen (1967). K-means is generally used to determine the natural groupings of pixels present in an image. It is attractive in practice, because it is straightforward and it is generally very fast [1]. It partitions the input dataset into k clusters in which one cluster contains the majority of the diseased part of the image (in this approach we partitions the image into three clusters). Each cluster is represented by an adaptively changing center, starting from some initial values named seed-points. K-means clustering computes the distances between the inputs (also called input data points) and centers, and assigns inputs to the nearest center. The introduced framework of defect segmentation operates in six steps as follows,
Step 1. Read the input image of defected fruit.
Step 2. Transform Image from RGB to L*a*b* Color Space. We have used L*a*b* color space because it consists of a luminosity layer in 'L*'channel and two chromaticity layer in 'a*' and 'b*‟ channels. Using L*a*b* color space is computationally efficient because all of the color information is present in the 'a*' and 'b*' layers only.
Step 3. Classify Colors using K-Means Clustering in 'a*b*' Space. To measure the difference between two colors, Euclidean distance metric is used.
Step 4. Label Each Pixel in the Image from the Results of K-Means. For every pixel in our input, K-means computes an index corresponding to a cluster. Every pixel of the image will be labeled with its cluster index.
Step 5. Generate Images that Segment the Input Image by Color. We have to separate the pixels in image by color using pixel labels, which will result different images based on the number of clusters.
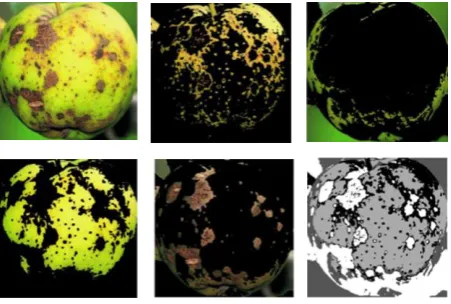
Step 6. Select the segment containing disease. In this experiment input image are partitioned into three segments. Fig. 1 demonstrates the output of K-Means clustering for an apple fruit infected with apple rot disease.
3.2
Feature Extraction
In the proposed approach, we have used some state of the art color and texture features to validate the accuracy and efficiency. The features used for the apple fruit disease classification problem are Global Color Histogram, Color Coherence Vector, Local Binary Pattern, and GLCM features.
1) Global Colour Histogram (GCH) The Global Color Histogram (GCH) is the simples approach to encode the information present in an image [16]. The goal is to calculate the HSV global histograms for all the images [17].
2) Color Coherence Vector (CCV) An approach to compare images based on color coherence vectors are presented in [18]. Color histograms are used to compare images in many applications. Their advantages are efficiency, and sensitivity to small changes in camera viewpoint. Color coherence vector (CCV) stores the number of coherent versus incoherent pixels with each color. By separating coherent pixels from incoherent pixels, CCV's provide finer distinctions than color histograms. CCV's can be computed at over 5 images per second on a standard workstation.
3) Local Binary Pattern (LBP) Given a pixel in the input image, LBP [19] is computed by comparing it with its neighbors:
Where, vc is the value of the central pixel, vn is the value of its neighbors, R is the radius of the neighborhood and N is the total number of neighbors. Suppose the coordinate of vc is (0,0), then the coordinates of vn are (Rcos(2π n / N), Rsin(2π n
[image:2.595.317.543.250.402.2]image grids may be estimated by interpolation. Let the size of image is I*J. After the LBP code of each pixel is computed, a histogram is created to represent the texture image:
Where, K is the maximal LBP code value. In this experiment the value of „N‟ and „R‟ are set to „8‟ and „1‟ respectively to compute the LBP feature.
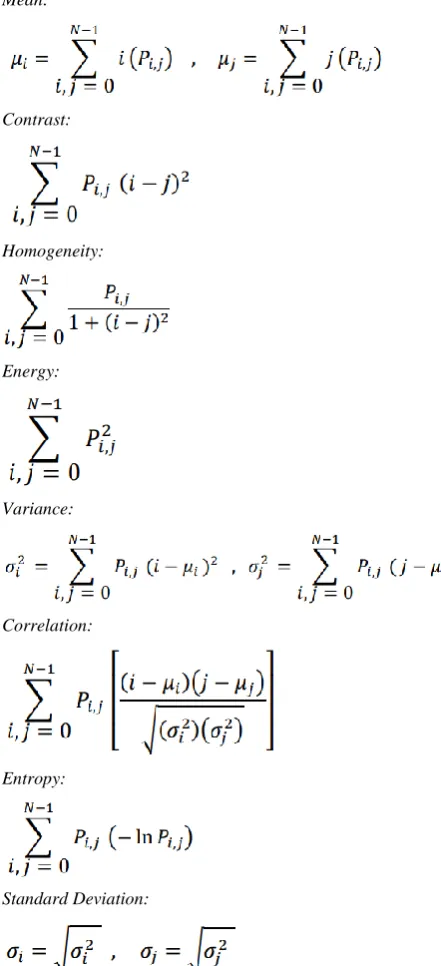
4) GLCM Features We use some global measures: mean (μ), contrast (Cn), homogeneity (Hg), energy (En), variance (σ2), correlation (Cr), and entropy (Hn) [5]. We use following 8 GLCM features to train the neural network.
Mean:
Contrast:
Homogeneity:
Energy:
Variance:
Correlation:
Entropy:
Standard Deviation:
We calculate values of these features for all the images in dataset. We create Excel Sheet of all these values and use this
Excel Sheet is as input to train the Probabilistic Neural Network.
4.
RESULTS AND DISCUSSION
[image:3.595.353.506.193.504.2]In this section we describe the classification results on our dataset. In our dataset we considered 10 types of diseased fruit classes namely Apple, Mango, Plum, Pear, Papaya, Banana, Orange, Pomegranate, Citrus limetta, Sapota. From each class we have collected 250 samples and totally 2500 images are used for experimentation. For classification we have used Artificial Neural Network.
Figure 2: Our database sample fruit images.
[image:3.595.53.274.247.731.2]In Table 1. shows that how the proposed method gives better results and we have presented result for both after segmentation(AS) and before segmentation(BS), the results of AS is better compared to BS for average classification for different training samples.
Table 1. Proposed method performance evaluation on classification for Before Segmentation (BS) and After
Segmentation (AS).
Proposed Method (PNN) SVM
classifier
KNN classifier
Training
Samples BS AS BS AS BS AS
80 0.79 0.92 0.72 0.82 0.58 0.68
50 0.72 0.85 0.54 0.68 0.52 0.64
14
5.
CONCLUSION
In this paper, we have proposed method to classify fruit as diseased and non-diseased. Firstly, we used K means clustering method for segmentation of diseased regions. Later, we used to extract texture features on segmented diseased regions. We have conducted extensive experimentation and results shows that proposed method gives better performance with Probabilistic Neural Network compared to traditional classifiers.
6.
REFERENCES
[1] Shiv Ram Dubey, Pushkar Dixit, Nishant Singh, Jay Prakash Gupta, 2013, “ Infected Fruit Part Detection using K-Means Clustering Segmentation Technique”, International Journal of Artificial Intelligence and Interactive Multimedia, Vol.2, , Page(s): 65-72 .
[2] A. Rocha, C. Hauagge, J. Wainer, and D. Siome, 2010 “Automatic fruit and vegetable classification from images,” Computers and Electronics in Agriculture, Elsevier; vol. 70,. Page(s): 96-104.
[3] R. Gonzalez, R. Woods, Digital Image Processing, 3rd ed., Prentice-Hall, 2007.
[4] Bongani Malinga, Daniela Raicu, Jacob Furst, “ Local vs. Global Histogram-Based Color Image Clustering”
[5] T. Ojala, M. Pietikäinen, and T. T. Mäenpää, “Multiresolution gray-scale and rotation invariant texture classification with Local Binary Pattern,” IEEE Trans. on Pattern Analysis and Machine Intelligence, vol. 24, no. 7, pp. 971-987, 2002.
[6] Q. Li, M. Wang and W. Gu, “Computer Vision Based System for Apple Surface Defect Detection,” Computers and Electronics in Agriculture, vol. 36, pp. 215-223, Nov. 2002.
[7] P. M. Mehl, K. Chao, M. Kim and Y. R. Chen, “Detection of Defects on Selected Apple Cultivars using Hyperspectral and Multispectral Image Analysis,” Applied Engineering in Agriculture, vol. 18, pp. 219-226, 2002.
[8] M. S. Kim, A. M. Lefcourt, Y. R. Chen and Y. Tao, “Automated Detection of Fecal Contamination of Apples Based on Multispectral Fluorescence Image Fusion,” Journal of food engineering, vol. 71, pp. 85-91, 2005.
[9] O. Kleynen, V. Leemans and M. F. Destain, “Development of a Multi- Spectral Vision System for the Detection of Defects on Apples,” Journal of Food Engineering, vol. 69, pp. 41-49, 2005.
[10]T. Ojala, M. Pietikäinen and T. T. Mäenpää, “Multiresolution Gray-Scale and Rotation Invariant Texture Classification with Local Binary Pattern,” IEEE Transactions on Pattern Analysis and Machine Intelligence (TPAMI), vol. 24, no. 7, pp. 971-987, 2002.
[11]C. Bravo, D. Moshou, R. Oberti, J. West, A. McCartney, L. Bodria and H. Ramon, “Foliar Disease Detection in the Field using Optical Sensor Fusion,” Agricultural Engineering International: the CIGR Journal of Scientific Research and Development, vol. 6, pp. 1-14, December 2004.
[12]D. Moshou, C. Bravo, R. Oberti, J. West, L. Bodria, A. McCartney and H. Ramon, “Plant Disease Detection Based on Data Fusion of Hyper-Spectral and
Multi-Spectral Fluorescence Imaging using Kohonen Maps,” Real-Time Imaging, vol. 11, no. 2, pp. 75-83, 2005.
[13] L. Chaerle, S. Lenk, D. Hagenbeek, C. Buschmann and D. V. D. Straeten, “Multicolor Fluorescence Imaging for Early Detection of the Hypersensitive Reaction to Tobacco Mosaic Virus,” Journal of Plant Physiology, vol. 164, no. 3, 253-262, 2007.
[14] D. Moshou, C. Bravo, S. Wahlen, J. West, A. McCartney and J. De Baerdemaeker, H. Ramon, “Simultaneous Identification of Plant Stresses and Diseases in Arable Crops using Proximal Optical Sensing and Self- Organising Maps,” Precision Agriculture, vol. 7, no. 3, pp. 149-164, 2006.
[15] H. Z. M. Shafri and N. Hamdan, “Hyperspectral Imagery for Mapping Disease Infection in Oil Palm Plantation using Vegetation Indices and Red Edge Techniques,” American Journal of Applied Sciences, vol. 6, no. 6, pp. 1031-1035, 2009.
[16] J. Qin, F. Burks, M. A. Ritenour and W. G. Bonn, “Detection of Citrus Canker using Hyper-Spectral Reflectance Imaging with Spectral Information Divergence,” Journal of Food Engineering, vol. 93, no. 2, pp. 183-191, 2009.
[17] F. Spinelli, M. Noferini and G. Costa, “Near Infrared Spectroscopy (NIRs): Perspective of Fire Blight Detection in Asymptomatic Plant Material,” Proc. 10th International Workshop on Fire Blight, Acta Horticulturae 704, 2006, pp. 87-90.
[18] D. E. Purcell, M.G. O‟Shea, R. A. Johnson and S. Kokot, “Near-Infrared Spectroscopy for the Prediction of Disease Rating for Fiji Leaf Gall in Sugarcane Clones,” Applied Spectroscopy, vol. 63, no.4, pp. 450-457, 2009.
[19] L. G. Marcassa, M. C. G. Gasparoto, J. Belasque Junior, E. C. Lins, F. Dias Nunes and V. S. Bagnato, “Fluorescence Spectroscopy Applied to Orange Trees,” Laser Physics, vol. 16, no. 5, pp. 884-888, 2006.
[20] L. Belasque, M. C. G. Gasparoto and L. G. Marcassa, “Detection of Mechanical and Disease Stresses in Citrus Plants by Fluorescence Spectroscopy,” Applied Optics, vol. 7, no. 11, pp. 1922-1926, 2008.
[21] E. C. Lins, J. Belasque Junior and L. G. Marcassa, “Detection of Citrus Canker in Citrus Plants using Laser Induced Fluorescence Spectroscopy,” Precision Agriculture, vol. 10, pp. 319-330, 2009. International Research Journal of Engineering and Technology (IRJET) e-ISSN: 2395 -0056 Volume: 03 Issue: 03 | Mar-2016 www.irjet.net p-ISSN: 2395-0072 © 2016, IRJET | Impact Factor value: 4.45 | ISO 9001:2008 Certified Journal | Page 729
[22] C. M. Yang, C. H. Cheng and R. K. Chen, “Changes in Spectral Characteristics of Rice Canopy Infested with Brown Planthopper and Leaffolder,” Crop Science, vol. 47, pp. 329-335, 2007.
[23] S. Delalieux, J. van Aardt, W. Keulemans, E. Schrevens and P. Coppin, “Detection of Biotic Stress (Venturia Inaequalis) in Apple Trees using Hyper-Spectral Data: Non-Parametric Statistical Approaches and Physiological Implications,” European Journal of Agronomy, vol. 27, no. 1, pp. 130-143, 2007.
Lai, “Spectrum Characteristics of Cotton Canopy Infected with Verticillium Wilt and Inversion of Severity Level,” Computer and Computing Technologies in Agriculture, vol. 2, pp. 1169-1180, 2008.
[25]Y. H. Choi, E. C. Tapias, H. K. Kim, A. W. M. Lefeber, C. Erkelens, J. T. J. Verhoeven, J. Brzin, J. Zel and R. Verpoorte, “Metabolic Discrimination of Catharanthus Roseus Leaves Infected by Phytoplasma using 1H-NMR Spectroscopy and Multivariate Data Analysis,” Plant
Physiology, vol. 135, pp. 2398-2410, 2004.
[26] F. Hahn, “Actual Pathogen Detection: Sensors and Algorithms—A Review,” Algorithms, vol. 2, no. 1, pp. 301- 338, 2009.