GPTP Tax Calculation
Shruti A. Virani
C.S. Patel Institute of
Technology, CHARUSAT
Anand
Inayat Jat
Software lead
Thomson Reuters
Ahmedabad
Nikita Bhatt
Assistant professor
C.S. Patel Institute of Technology,
CHARUSAT
Anand
ABSTRACT
Data driven approach is basically used to minimize the time taken for executing the operation of the system. In this we decide standard format of the data which makes decision of the valuable asset and processes and it may use multiple times to incorporate result from those data. The proposed system is not that much focus on data intelligent and data driven. GPTP means ―global professional tax positioning‖.
In this, collect data from the form which are generalized, and put as an input and get desire output from this data. Here we are using JSON format which allows us to travel all of our data in whole request with the same format. In current system we are using different data formats for front end operations and for back end operations. So whenever request comes for proceeding the system needs to convert those data into one particular format then process those in front end then request for the operation takes place which need extra conversion of data. There are not enough tools to make UX maintenance and improvement affordable for small/medium companies, mainly to learn from the feedback of their users and try different ideas. Current system gives a less accuracy and reusability. Also it takes more time to give expected output.
Keywords
Tax, calculation, legal Tax, tax calculation, India Tax, GPTP Tax
1.
INTRODUCTION
The data tells the much of the user’s story, but we need tools and techniques to look for patterns, and turn those patterns into knowledge that can guide our algorithms in making an smarter kind of recommendations [7]. Objectives are Make data independent, Create Standardize format of Data so it can reuse multiple time and Make data more intelligent so data take decision for further processes In current system we are using different data formats for front end operations and for back end operations. So whenever request comes for proceeding the system needs to convert those data into one particular format then process those in front end then request for the operation takes place which need extra conversion of data. So it increase the Burdon of server due to so many web services. Now, Same way as in current system first of all the analyst gather the requirements to be built by the developer (Developer can be either UI/UX developer or code developer). The requirements also can be in the form of design or calculation one. Requirements given by the client is attached or expressed with the help of Web Tool. Now, after getting all the requirements analyst analyses all the aspects of the system and look for feasibility. Analyst describe all the requirements in the form of design, data and also the calculation of the system which shows basic output in the Web Tool[15]. Web tool generates the data in the form of JSON as statements to be performed in the system also in proposed system we are getting simple calculations if there any and Form mappings which is now converted into the specific one format which help us in fetching and processing
data. The acquired data then passed to the calculator and JS Code to be processed. On the bases of request we got and the processed data from calculator we pass those to Tax Service and also complex calculations which are done by developer are passed to the Tax Services for producing the final result. With the use of services developed by the developer request passed to the persistent layer with the use of Tax Services and further respected response gets generated to the client machine with the use of front end application code[14].
2.
PRELIMINARIES AND ADAPTATION
FROM COMPLETE DATA DYNAMIC
DATA-DRIVEN MODEL
2.1 Dynamic Data-Driven Model Reduction
This work shows an information-driven online versatile model lessening approach for frameworks that experience dynamic changes. Traditional model decrease builds a lessened model of a huge scale framework in a disconnected stage and after that keeps the diminished model unaltered amid the assessments in an online stage; nonetheless, if the framework changes on the web, the decreased model may neglect to anticipate the conduct of the changed framework[3]. Remaking the diminished model sans preparation is frequently excessively costly in time-basic and constant situations. We present a dynamic information-driven adjustment approach that adjusts the diminished model from fragmented sensor information acquired from the framework amid the online calculations. The updates to the diminished models are gotten specifically from the fragmented information, without the plan of action to the full model[3]. Our adaptively approach approximates the missing esteem in the fragmented sensor information with gappy legitimate orthogonal decay. This surmised information is then used to determine low-rank updates to the decreased premise and the diminished administrators. In our numerical illustrations, inadequate information with 30– 40 % known esteems are adequate to recuperate the decreased model that would be acquired by means of reconstructing without any preparation.
2.2 Data-Driven Usability Refactoring:Tools
And Challenges
26 some refactoring’s might be disposed of while others presented,
contingent upon their assessed achievement. The paper likewise talks about a portion of the difficulties that we anticipate ahead.
2.3 Long-Term System Load Forecasting
Based On Data-Driven Linear Clustering
Method
An information-driven direct bunching (DLC) technique is proposed to explain the long haul framework stack determining issue caused by stack change in an expansive measure of information. An expansive substation stack dataset with yearly interim is used and right off the bat pre-handled by the proposed straight grouping strategy to plan for demonstrating[7]. At that point, ideal autoregressive coordinated moving normal (ARIMA) models are built for the entire arrangement of each acquired bunch to gauge their separate future load[7].
[image:2.595.316.535.275.538.2]At long last, the framework stack gauging result is gotten by summing up all the ARIMA figures. From blunder examination and application comes about, it is both hypothetically and for all intents and purposes demonstrated that the proposed DLC strategy can lessen irregular estimating mistakes while ensuring displaying exactness, with the goal that a more steady and exact framework stack gauging result can be gotten.
Fig 1 DLC flow
3.
APPROACH
3.1 Data Driven
In the information and investigation business, we regularly hear that associations ought to be information driven. All things considered, we need our procedures to be based on realities and we need to utilize certainties to settle on better choices[3]. Given the unbelievable progressions in innovation in the course of recent years, one may think associations are more imaginative than any other time in recent memory[1].This information suggests that very few organizations leverage data and technology in ways that impact business. In the effort to become more data-driven, a lot of organizations have become lost[9]. Let’s consider a few success criteria. First, organizations need data[11]. Ten years ago, this was a real problem. But, technology and IT have improved data access through faster processing and a broader range of tools. Data
warehouses have been created to provide ―one version of the truth.‖[3] Hadoop and NoSQL technologies allow for analysis of web data, images, text and other ―multi-structured‖ data[6]
.
3.2 DLC
DLC means information direct grouping technique. It technique for triphone development was portrayed which included cloning all monophonic and after that re-evaluating them utilizing information for which mono phone names have been supplanted by triphone names [7]. This will prompt a substantial arrangement of models and moderately small preparing information for each model. Applying the contention that setting won't enormously influence the middle conditions of triphone models, one approach to lessen the aggregate number of parameters without fundamentally adjusting the models' capacity to speak to the diverse relevant impacts may be to tie the greater part of the inside states overall models got from the same monotone[8]. This thing should be possible by composing an altered content of the shape[7].
Fig.2 DLC preview in thread
An information-driven direct grouping (DLC) technique is proposed to tackle the long haul framework stack anticipating problem caused by stack change in some created urban communities[12]. A huge substation stack dataset with yearly interim is used and right off the bat preprocessed by the proposed direct bunching strategy to get ready for demonstrating[4].
4.
AFFECTED FACTOR IN ARTIFICIAL
INTELIGENCY
4.1 Prediction And Design
We cannot query our own brains for answers about nonhuman optimization processes, whether bug-eyed monsters, natural selection, or Artificial Intelligences. Anthropomorphism leads people to believe that they can make predictions, given no more information than that something are ―intelligence‖.
[image:2.595.84.283.326.554.2]The human species came into existence through natural selection, which operates through the no chance retention of chance mutations. One path leading to global catastrophe to someone is pressing the button with a mistaken idea of what the button is that Artificial Intelligence derives about concluded a similar accretion of working algorithms, with the researchers having no bottomless appreciative of how the joint system works.
[image:3.595.52.288.246.370.2]Digital images are a numeric representation of scenes captured by some digital devices. Digital images are in form of a 2D matrix and each cell represents intensity value of the corresponding pixel as shown in Fig. 1-1. One has to adjust this intensity values in order to get clear features of images. Certain numerical model needs to apply on the image in order to adjust the intensity values. The main challenge is to create significant mathematical model for practical requirements.
Fig. 1.1 crystal structure is in red color and design model is in blue color. (1) Calpha overlay; (2), detail of sidechain
packing in the core.[10]
4.2 Underestimating The Power Of
Intelligence
Singular differences of human intelligence have a usual label, a controversial understanding of the solid investigational result that different intellect tests are highly correlated with each other and with real-world outcomes such as lifespan income (Jensen 1998). The vulnerability of puzzling general intelligence with g-factor is that it leads to enormously underestimating the potential impact of Artificial Intelligence.[11] (This applies to underestimating would-be good impacts, as well as potential bad impacts.) with ―intelligence,‖ like chess or abstract calculation. But not superhumanly persuasive; or far better than humans at calculating and manipulating human social conditions; or mercilessly clever in formulating long-standing strategies.
The catastrophic scenario which stems from underestimating the power of intelligence is that someone builds a button, and doesn’t care enough what the button does, because they don’t think the button is powerful enough to hurt them. And one should not fail to mention—for it also impacts upon existential risk—that Artificial Intelligence could be the powerful solution to other existential risks, and by mistake we will ignore best hope of survival. The point about underestimating the potential impact of Artificial Intelligence is symmetrical around potential good impacts and potential bad impact.[11]
5.
LIMITATION OF CURRENT SYSTEM
Now, we used to have different data at different level in application which makes the request processing more tedious and time consuming. We have experimented the data but it is more complex and difficult to handle[14]. The data is traversing more slowly than previous request and also with the same content and same result.
There are for same data request send multiple times so burden of server are increased and it take lots of time. We tried to adding more data at the same time which also comes up with quick result and also with the different type of data are also working fine.
In current system we are using different data formats for front end operations and for back end operations. So whenever request comes for proceeding the system needs to convert those data into one particular format then process those in front end then request for the operation takes place which need extra conversion of data.
Current system have Less accuracy to predict input cluster and Less forecasting stability, Examine more advanced examples on insider risk and utilize genuine dataset to enhance the measurements, The strategy gauges the vulnerability of the anticipated estimations as the normal of two commitments: distinctive blends can fit particular applications better. Additionally, a straight increment of the expectation mistake, including a memory term, is here accepted, yet a more refined (nonlinear, versatile) calculation can be acquainted later on
maintenance and improvement affordable for small/medium companies, mainly to learn from the feedback of their users and try different ideas.
6.
IMPLEMENTATION
Data driven approach is basically used to minimize the time taken for executing the operation of the system. In this we decides standard format of the data which makes decision of the valuable asset and processes and it may use multiple times to incorporate result from those data. In this we are combining the by forget data into generalized form and then whatever the data we produces we use those as an input and get the required output for the same. Here we are using JSON format which allows us to travel all of our data in whole request with the same format. There are this all essentially participate in proposed system. with gauge better the raise of the forecast blunder in time. There are not enough tools to make UX Analyst.
First of all the requirement gathering is taken place for these people. Once the requirements are clear for the product analyst’s start working describing those requirements. These are the people who describes the system requirements and also writes the statements which used for future calculations and processes. Data entry in web tool is also done by them so that developer can use those for further calculation checks and performance scenarios. Analysts also works with designing the product which is further developed by developers.
6.1 Web Tool
This is used to describe requirements for the developers which is done by analysts. All different scenarios which has been given to analysts are described in this tool and that are further pass as statements in the process which is used to show the expected output. The designing which is proposed by the customer also can describe using web tool. Analysts solely add some dummy data to get the requirements more clear. It is additionally used to run the examination in the meantime. Web instruments enable you to impart your investigation to others in your association's gateway. Information is put away and handling happens on a server that is united with your entry, which makes
28 information determined in a customer application, process it,
and return yield as highlights, maps, reports, or records.
6.2 Developer
A developer is a person that constructs and make programming and applications. He or she composes, troubleshoots and executes the source code of a product application. Developer takes the requirements from the analyst and also checks the scenarios in web tool to confirm the requirements. There are UI Developers who develops the design of the system and there are core developers which works with the logic and calculation part of the system.
6.3 Statement
Statement is the financial statement of a business which provides a formal record of financial activity. As a business owner your financial statement offers valuable information about company’s financial position. There are four key financial statement in TAX: A monetary record, pay explanation, income articulation and proclamation of proprietor value.
6.4 Tax Service
This is mainly used to pass the data from database to front end and also from the front end to database. Basically it manages requests comes from the user and pass those to database and then returns the data asked as a response. Mainly business logics are written in the services and also basic validations can also performed using this.
6.5 Persistent Layer
This is basically a database layer which is used to store the data in database management system. There are various databases or persistent layer is used to store the data in the system. Whenever requests comes from the services for getting data from the persistent layer then it gives data as response and if it is a post request then service requests the data to add or update the record and then success or failure response is sent to the client.
In current system we are using different data formats for front end operations and for back end operations. So whenever request comes for proceeding the system needs to convert those data into one particular format then process those in front end then request for the operation takes place which need extra conversion of data.
Again after completing the same services generate the output or it responses in a format that might not be understandable by the front end so we need to convert those again which is tedious and also it is complex one. So the solution to this scenario is to have one common format of data to be passed every time for every request and for every response which makes systems life easy and less complex so at the end we got the output with optimizing time taken by the request and also with less complexity.
Fig.3 relative system
This system is made up of entities which are analyst, statements, developers, Web tool, Services and persistent layer which is same as existing system but here we have two different webtools which generates the data in different format which is further converted in to one specific format and passed to the calculator and JS Code
Now, Same way as in current system first of all the analyst gather the requirements to be built by the developer(Developer can be either UI/UX developer or code developer). The requirements also can be in the form of design or calculation one. Requirements given by the client is attached or expressed with the help of Web Tool. Now, after getting all the requirements analyst analyses all the aspects of the system and look for feasibility.
Analyst describe all the requirements in the form of design, data and also the calculation of the system which shows basic output in the Web Tool. Web tool generates the data in the form of JSON as statements to be performed in the system also in proposed system we are getting simple calculations if there any and Form mappings which is now converted into the specific one format which help us in fetching and processing data.
The acquired data then passed to the calculator and JS Code to be processed. On the bases of request we got and the processed data from calculator we pass those to Tax Service and also complex calculations which are done by developer are passed to the Tax Services for producing the final result.
7.
DATA PROCESSING AND RESULTS
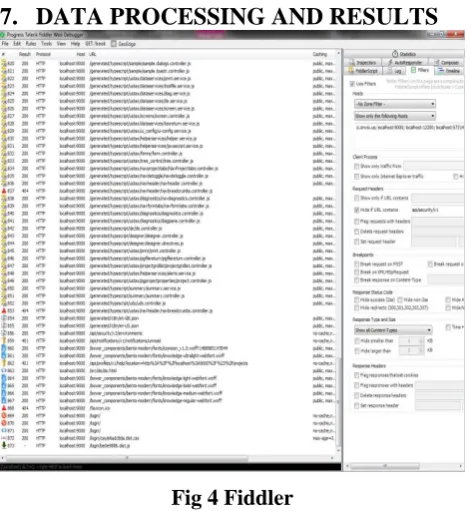
Fig 4 Fiddler
This all are the request from/to server. It is work using WebAPI[13]. It can manage all the services which send/response the data. From fiddler we can decide the result port , URL, which host are used for particular URL, protocol and etc. Also we can check the data(in json format) from the webAPI.
Grunt serve provide debug facilities for developer. So they can find a solution of any concerns and all. Grunt serve have capabilities to run the whole project which compile together. It provides a communication between more than two host using WebAPI. There are service for server are run into grunt server also it provide debug facilities for improve the work. In above screenshot, it checks the all files if any have errors, it directly shows into this screen so debugger can easily find the solution of it.
Fig 5 Grunt serve
Grunt serve provide debug facilities for developer. So they can find a solution of any concerns and all. Grunt serve have capabilities to run the whole project which compile together[10]. It provides a communication between more than two host using WebAPI.
There are service for server are run into grunt server also it provide debug facilities for improve the work. In above screenshot, it check the all files if any have errors, it directly
shows into this screen so debugger can easily find the solution of it.
8.
CONCLUSION
Proposed system become more intelligent and automatically also, it decrease the Burdon of server and increase capability of data. Also make a standard json(data) format so same data can use for front end and back end. This system is more reliable, less complex and easy to use. This proposed system is very essential for decrease Burdon of web services and server also we can check from webAPI thorough the fiddler. It decide the widespread for front end and back end. So for that it require more information of technologies for improve goal. So same calculation for front end and back end not require different technologies for implement for both. Here using JSON format which allows us to travel all of our data in whole request with the same format. So whenever request comes for proceeding the system needs to convert those data into one particular format then process those in front end then request for the operation takes place which need extra conversion of data.
9.
REFERENCES
[1] Shields, Patricia; Rangarjan, Nandhini A Playbook for Research Methods: Integrating Conceptual Frameworks and Project Management. Stillwater, Oklahoma: New Forums Press. ISBN 1-58107-247-3. (2013).
[2] Shields, Patricia. Step by Step: Building a Research Project. Stillwater, Oklahoma: New Forums Press. June 2000
[3] Baglione, L. Writing a Research Paper in Political Science. Thousand Oaks, California: CQ Press. April 2012.
[4] Mackworth & Goebel, Luger & Stubblefield The intelligent agent paradigm:Russell & Norvig , pp. 27, 32–58, 968–972 Poole, 1998, pp. 7–21, pp. 235–240, December 2014
[7] Schank, Roger C. "Where's the AI". AI magazine. Vol. 12 no. 4. p. 38. (1991).
[8] Russell & Norvig, University of Cagliari, 2009.
[9] Oklahoma ―AlphaGo - Google DeepMind". Archived from the original on 10 March 2016.
[10] Philos Trans R Soc Lond B Biol Sci. 361(1467): 459–463. Published online 2006 Feb. doi: 10.1098/rstb.2005.1803, 2006, Mar 29 2001
[11] Yudkowsky, Eliezer, Nick Bostrom and Milan M. Ćirković ―Artificial Intelligence as a Positive and Negative Factor in Global Risk.‖ In Global Catastrophic Risks , 308–345. New York: Oxford University Press, 2008.
[12] Roberto Brunelli and Tomaso Poggio IEEE TRANSACTIONS ON PATTERN ANALYSIS AND MACHINE INTELLIGENCE, VOL. 15, NO. 10, OCTOBER 1993
[13] Ludovico Boratto : researcher in the Digital Humanities research department at Eurecat,Eloisa Vargiu : Ph.D. degree in Electronic and Computer Engineering by the University of Cagliari (Italy).
[14] https://thehub.thomsonreuters.com/docs/DOC-1718075
[image:5.595.55.290.491.640.2]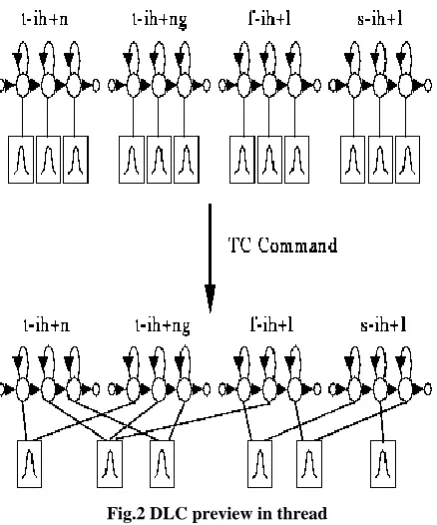
![Fig. 1.1 crystal structure is in red color and design model is in blue color. (1) Calpha overlay; (2), detail of sidechain packing in the core.[10]](https://thumb-us.123doks.com/thumbv2/123dok_us/9297674.427687/3.595.52.288.246.370/crystal-structure-color-design-calpha-overlay-sidechain-packing.webp)