ISSN Online: 1949-5005 ISSN Print: 1949-4998
DOI: 10.4236/health.2018.106063 Jun. 28, 2018 838 Health
Evaluation of Obesity Prevalence and Physical
Activity and Health Responsibility in Elazig City
Population
*
Cengiz Arslan
1#, Deniz Cakaroglu
21Faculty of Sports Sciences, University of Firat, Elazig, Turkey 2Physical Education and Sport School, University of Siirt, Siirt, Turkey
Abstract
Objective: This paper examines obesity prevalence, physical activity and health responsibility in Elazig. Material and Method: The study was con-ducted on 2905 men (20 - 69) and 2131 women (20 - 69), with an average of (40.93 ± 9.14) chosen randomly. Health-Promoting Lifestyle Profile was ob-tained via Healthy Lifestyle Behaviors Scale by Walker & Pender (1987). In this paper, three sub-evaluation dimensions of HPLP-II, health responsibility,
exercise and nutritional behavior were used. Body compositions were
ob-tained with bioelectrical impedance and Waist Circumference (WC) Central obesity by measuring waist circumference. Statistical analyses were assessed in SPSS 22.0. With Chi square, ANOVA, linear and logistic regression analyses, significance levels were p < 0.05 and 0.001. Result: Obesity prevalence was 38.8%, 37.9% and 38.4% and rate of WC abdominal prevalence was 38.2%, 29.3% and 33.0% in men, women and general population respectively. Obesity prevalence was more in men (p < 0.001). Combined prevalence rate of over-weight and obese individuals was 70.1%. Obesity prevalence increases after 35 and reaches high (55% - 80%), and correlation rates were found significant (p < 0.001). Conclusion: Obesity prevalence and abdominal obesity were critical health issues among adults. Individuals couldn’t develop conscious atti-tudes towards physical activity, nutrition and health responsibility and overcome obesity. Social strategies should be developed to reduce obesity risk factors.
Keywords
Obesity, Prevalence, Body Composition, Lifestyle, Waist Circumference
*This study has been presented in 15-18 November 2017 at 15th International Sport Sciences Con-gress held in Antalya/Turkey.
How to cite this paper: Arslan, C. and Cakaroglu, D. (2018) Evaluation of Obesity Prevalence and Physical Activity and Health Responsibility in Elazig City Popu-lation. Health, 10, 838-852.
https://doi.org/10.4236/health.2018.106063
Received: May 29, 2018 Accepted: June 25, 2018 Published: June 28, 2018
Copyright © 2018 by authors and Scientific Research Publishing Inc. This work is licensed under the Creative Commons Attribution International License (CC BY 4.0).
DOI: 10.4236/health.2018.106063 839 Health
1. Introduction
Obesity is a complex, multifactorial, and largely preventable disease, affecting, along with overweight, over a third of the world’s population today [1] [2] [3]. It is considered as one of the riskiest 10 diseases by the World Health Organization (WHO) [4]. It is reported in various studies that prevalence of overweight and obesity does not increase only in Turkey but also in US, England and Europeans countries as well as Australia, Brazil, Chine in different rates [5]. If secular trends continue, by 2030 an estimated 38% of the world’s adult population will be overweight and another 20% will be obese [2] [6]. In the America (USA), the most dire projections based on earlier secular trends point to over 85% of adults being overweight or obese by 2030 [7]. In addition, obesity prevalence in devel-oping countries continues to trend upwards toward US levels [2].
Though the occurrence of the obesity is affected by many factors, the main reason lies behind the fact that the energy generated by the balance disorder in energy intake and expenditure turns into a storage of fat in the body, thus im-pairing the body composition [8] [9] [10]. Reflecting the overall health and wel-fare of individuals at all ages, anthropometric measurement is a universal non-invasive method that assesses the proportions and type of the performance, health and body components [10]. Body composition assessments comprise the most significant use of value of health in anthropometric measurements. Re-cently there have been advances in conceptual models related to body composi-tion. There is a balanced relationship between body composition components [11].
Though Body Mass Index (BMI) is a common practical method used to assess the obesity prevalence [4], the fat mass and the fat distribution in the body can-not be given clearly. BMI cancan-not assess the fat distribution according to the body regions. Thus, just as various methods such as BIA, DEXA, BT, MR that meas-ure local fat distribution in the body, so too anthropometric measmeas-urements such as skinfold thickness measurement, waist circumference (WC), waist hip ratio
(WHR) are applied [12]. Over the last years, BIA method, developed based on
the fact that its fat-free adipose tissue mass and adipose tissue have a distinctive permittivity, has been widely used as it gives fast results through a portable de-vice without any need for a user [13]. Waist and hip ration (WHR) is the very first anthropometric method developed from epidemiological studies as an indi-cator of the body fat distribution [14]. Increase in abdominal adipose tissue in-creases the risk caused by obesity and thus rise in WC and WHR negatively af-fects the health. For example, while the risk level for diabetes has increased by 3.7 times in obese women, this rise is 10.3 in abdominal obese women [15].
DOI: 10.4236/health.2018.106063 840 Health health responsibility and sustainable behaviors for its protection together with regular exercises serve as the basis for the issue. The level of welfare of a society may be assessed based on the predomination of healthy individuals in the rele-vant society. When developing healthy behaviors, it is crucial for the individual to maximize his/her responsibility and put efforts for health promotion [19].
In modern societies individuals generally are observed to face changes in body composition and obesity problems caused by overnutrition or sedentary life. This study seeks to estimate the obesity prevalence of the Elazığ population, a city in Turkey, and to investigate risk factors and its related variables as well as the physical activity, health responsibility and food habits.
2. Material and Method
2.1. Participants
The population of the study is comprised of Elazig province population in Tur-key. The sample is comprised of male and female residents of center, neighbor-ing counties and villages of Elazig. The sample includes totally 5036 voluntary subjects between the ages of 20 and 69, 2905 (57.7%) of whom are male and 2131 (42.3%) female, selected randomly from those working at public bodies.
2.2. Study Procedures
Data of the study have been obtained via questionnaire and physical fitness measurements. All subjects were informed about the aim and method of the test in accordance with Helsinki declaration along with their consent of voluntary participation. For the implementation of the study, necessary permissions were obtained from official local ethical committees and bodies. Besides, this study was supported by Scientific Research Projects Unit of Firat University, Elazig.
2.3. Health-Promoting Lifestyle Profile II (HPLP-II)
For Healthy Lifestyle Behaviors, the “Healthy Lifestyle Behaviors Scale”, devel-oped by Walker, Sechrist and Pender in 1987 [20], was used. The validity and
re-liability study of the scale in Turkey was carried out by Esinin 1997 [21]. All
items of the scale are positive, and a 4-point Likert scale was prepared. For each item, 1 (never), 2 (sometimes), 3 (frequently) and 4 (regularly) points were given respectively. Questions within the scale measure the behaviors that improve health related to the healthy lifestyle of the individual. The rise in the points available within the scale shows that the specified health behaviors are con-ducted by the individual at a high level. The alpha reliability coefficient of the scale varies between 0.70 - 0.90. The lowest point is 48, and the highest is 192. The scale has 6 subgroups of assessment. In this study, three sub dimensions of assessments, health responsibility, exercise habit and nutrition habit, were used.
2.4. Body Composition Measurements
DOI: 10.4236/health.2018.106063 841 Health level was measured, were subjected to body composition measurement. The body weight and composition assessments of the subjects were carried out by
bioelectrical impedance analysis (BIA) (Jawon Segmental Body Composition
Analyzer, model AVIS 333 Plus) [22]. The measurements of the subjects were
made between 8 and 12 in the mornings without fluid and food intake before dinner and after relieving themselves. Their ornaments and metals were re-moved. Individuals were asked to stand on the aluminum groundsills of the de-vice in a vertical position with light wear and bare feet, and to grip the hand electrodes. Data were recorded via computer connected to the body composition analyzer. Based on the declarations of the subjects, those using diuretic and high blood pressure medication and having renal failure were excluded. As for wom-en, measurements were postponed depending on the menstrual cycle.
2.5. Body Mass Index (BMI)
Body mass index of the subjects based on weight/height2 formulae was calculated through Body Composition Analyzer (model AVIS 333 Plus) [22]. Results were assessed depending on the classification of the World Health Organization (WHO), in which <18.5 is underweight, the range between 18.5 - 24.9 is normal, 25.0 - 29.9 is pre-obese, 30.0 - 34.9 is Obese Type-I, 35.0 - 39.9 is Obese Type-II and over 40 is Obese Type-III [10]. Besides, self-perception levels of body shapes by subjects were assessed with four options including 1 = Underweight, 2 =
Normal, 3 = Overweight and 4 = Obese in line with the question “How do you
evaluate your body shape when compared to others having the same so-cio-economic levels as you do?”.
2.6. Statistical Analysis
Data obtained from subjects were analyzed through SPSS 22.0 statistical package software along with calculations of frequencies, means and percentage (%) ratios in tables. To understand whether the data demonstrated the normal distribution or not, they were tested with Shapiro-Wilk and it was observe that data showed a
normal distribution. The Independent samples t-test, Chi-Square test, one-way
analysis of Variance (ANOVA) was used respectively for paired comparison, determination of the relationship between categorical and demographic va-riables and determination of the difference between groups. As a result of ANOVA, Tukey HSD test was carried out to determine from which group the difference came from. Furthermore, to investigate the role of age, sex and some variables in regression of obesity, the binary logistic regression analysis was used. The correlational relationships between parameters were assessed through Regression Analysis. Results were assessed at a confidence range of 95% while significance was assessed at the level of p < 0.001, p < 0.05.
3. Results
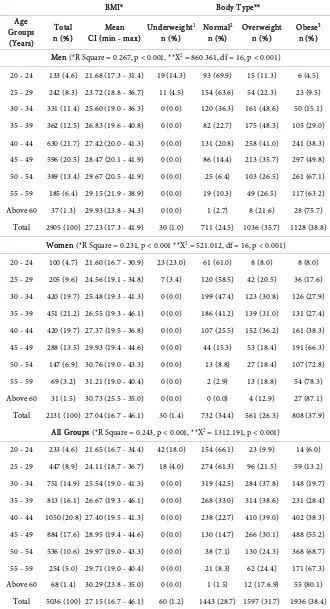
In Table 1, obesity prevalence and BMI means distribution are given based on
DOI: 10.4236/health.2018.106063 842 Health
Table 1. Body mass index and obesity prevalence distribution based on age groups.
BMI* Body Type**
Age Groups (Years)
Total
n (%) CI (min - max) Mean Underweight
1
n (%) Normal
2
n (%) Overweight n (%) Obese
3
n (%)
Men (*R Square = 0.267, p < 0.001, **X2 = 860.361, df = 16, p < 0.001)
20 - 24 133 (4.6) 21.68 (17.3 - 31.4) 19 (14.3) 93 (69.9) 15 (11.3) 6 (4.5) 25 - 29 242 (8.3) 23.72 (18.8 - 36.7) 11 (4.5) 154 (63.6) 54 (22.3) 23 (9.5) 30 - 34 331 (11.4) 25.60 (19.0 - 36.3) 0 (0.0) 120 (36.3) 161 (48.6) 50 (15.1) 35 - 39 362 (12.5) 26.83 (19.6 - 40.8) 0 (0.0) 82 (22.7) 175 (48.3) 105 (29.0) 40 - 44 630 (21.7) 27.42 (20.0 - 41.3) 0 (0.0) 131 (20.8) 258 (41.0) 241 (38.3) 45 - 49 596 (20.5) 28.47 (20.1 - 41.9) 0 (0.0) 86 (14.4) 213 (35.7) 297 (49.8) 50 - 54 389 (13.4) 29.67 (20.5 - 41.9) 0 (0.0) 25 (6.4) 103 (26.5) 261 (67.1) 55 - 59 185 (6.4) 29.15 (21.9 - 38.9) 0 (0.0) 19 (10.3) 49 (26.5) 117 (63.2) Above 60 37 (1.3) 29.93 (23.8 - 34.3) 0 (0.0) 1 (2.7) 8 (21.6) 28 (75.7)
Total 2905 (100) 27.23 (17.3 - 41.9) 30 (1.0) 711 (24.5) 1036 (35.7) 1128 (38.8) Women (*R Square = 0.231, p < 0.001 **X2 = 521.012, df = 16, p < 0.001)
20 - 24 100 (4.7) 21.60 (16.7 - 30.9) 23 (23.0) 61 (61.0) 8 (8.0) 8 (8.0) 25 - 29 205 (9.6) 24.56 (19.1 - 34.8) 7 (3.4) 120 (58.5) 42 (20.5) 36 (17.6) 30 - 34 420 (19.7) 25.48 (19.3 - 41.3) 0 (0.0) 199 (47.4) 123 (30.8) 126 (27.9) 35 - 39 451 (21.2) 26.55 (19.3 - 46.1) 0 (0.0) 186 (41.2) 139 (31.0) 131 (27.4) 40 - 44 420 (19.7) 27.37 (19.5 - 36.8) 0 (0.0) 107 (25.5) 152 (36.2) 161 (38.3) 45 - 49 288 (13.5) 29.93 (19.4 - 44.6) 0 (0.0) 44 (15.3) 53 (18.4) 191 (66.3) 50 - 54 147 (6.9) 30.76 (19.0 - 43.3) 0 (0.0) 13 (8.8) 27 (18.4) 107 (72.8) 55 - 59 69 (3.2) 31.21 (19.0 - 40.4) 0 (0.0) 2 (2.9) 13 (18.8) 54 (78.3) Above 60 31 (1.5) 30.73 (25.5 - 35.0) 0 (0.0) 0 (0.0) 4 (12.9) 27 (87.1) Total 2131 (100) 27.04 (16.7 - 46.1) 30 (1.4) 732 (34.4) 561 (26.3) 808 (37.9)
All Groups (*R Square = 0.243, p < 0.001, **X2 = 1312.191, p < 0.001)
20 - 24 233 (4.6) 21.65 (16.7 - 34.4) 42 (18.0) 154 (66.1) 23 (9.9) 14 (6.0) 25 - 29 447 (8.9) 24.11 (18.7 - 36.7) 18 (4.0) 274 (61.3) 96 (21.5) 59 (13.2) 30 - 34 751 (14.9) 25.54 (19.0 - 41.3) 0 (0.0) 319 (42.5) 284 (37.8) 148 (19.7) 35 - 39 813 (16.1) 26.67 (19.3 - 46.1) 0 (0.0) 268 (33.0) 314 (38.6) 231 (28.4) 40 - 44 1050 (20.8) 27.40 (19.5 - 41.3) 0 (0.0) 238 (22.7) 410 (39.0) 402 (38.3) 45 - 49 884 (17.6) 28.95 (19.4 - 44.6) 0 (0.0) 130 (14.7) 266 (30.1) 488 (55.2) 50 - 54 536 (10.6) 29.97 (19.0 - 43.3) 0 (0.0) 38 (7.1) 130 (24.3) 368 (68.7) 55 - 59 254 (5.0) 29.71 (19.0 - 40.4) 0 (0.0) 21 (8.3) 62 (24.4) 171 (67.3) Above 60 68 (1.4) 30.29 (23.8 - 35.0) 0 (0.0) 1 (1.5) 12 (17.6.9) 55 (80.1)
Total 5036 (100) 27.15 (16.7 - 46.1) 60 (1.2) 1443 (28.7) 1597 (31.7) 1936 (38.4)
(Assessments were made by combining 1-2Underweight and Normal and 3Obese I-II-III groups in statistical
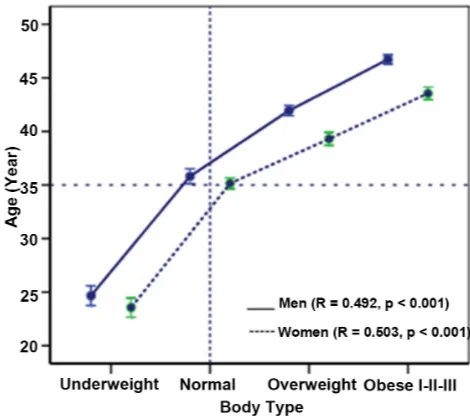
DOI: 10.4236/health.2018.106063 843 Health 38.4% and that obese had overweight body shape based on BMI mean value (27.15). Significant differences were observed between BMI and obesity preva-lence among age groups in both men and women, and that there was a huge rise in parallel with the rise in the age (R = 0.243, p < 0.001). It was also observed that this rise had an impact by 24.3%. It was also shown in Figure 1 that the body shape began changing in men and women as of the age 35 along with an upwards trend towards overweight and obese shape and that there was a linear relationship between age and body shape.
Some results related to the linear regression and X2 analysis of the obesity prevalence of men and women based on some demographic variables are given in Table 2. It was found that subjects living in the city center (38.4%) had higher obesity prevalence ratio (p < 0.001) than those living in the outside of the city (31.6%). However, it was also found that there was no linear relationship be-tween BMI values and the place of living (R = 0.001, p > 0.05). It was observed that workers, retirees and housewives in occupation variable, primary school graduates in education variable and married people in marital status variable had higher obesity prevalence and that there was a weak linear significant rela-tionship between BMI values. It was also found that the level of education and occupation, and the marital status had 4% and 1.2% impact on the increase in BMI values respectively (Table 2).
Table 3 shows the chronic disease status of adult men and women and the re-lational distribution between body shape and abdominal obesity and WC. Ac-cording to the featured results, among the men and women those who have notably diabetes and hypertension have higher WC values compared to those having no disease or other chronic diseases (Table 3, p < 0.001).
[image:6.595.254.489.494.702.2]Waist-to-hipratio (WHR) (men > 1.0, women > 0.80) Waist circumference (WC) central obesity (men 102 cm, women 88 cm) between men and women
DOI: 10.4236/health.2018.106063 844 Health
Table 2. Distribution of adult male and female obesity prevalence based on some va-riables.
BMI* Body Type**
Total Mean Underweight1 Normal2 Overweight Obese3
Parameters n (%) CI (min - max) n (%) n (%) n (%) n (%) Place of living (*R Square = 0.001, p > 0.05, **X2 = 23.115, df = 3, p < 0.001,)
City central 3446 (68.4) 27.07 (16.7 - 46.1) 55 (1.6) (29.5) 1050 (30.5) 1324 (38.4) 1017 Out of City
central 1590 (31.6) 27.32 (17.3 - 43.2) 5 (0.3) 426 (26.8) 547 (34.4) 612 (31.6) Occupation (*R Square = 0.43, p < 0.05, **X2 = 326.617, df = 10, p < 0.001)
Teacher 632 (12.5) 26.49 (17.5 - 37.6) 9 (1.4) 221 (35.0) 193 (30.5) 209 (33.1) Officer 1822 (36.2) 26.28 (17.3 - 43.3) 33 (1.8) 667 (36.6) 568 (31.2) 554 (30.4) Worker 1530 (30.4) 27.71 (16.7 - 46.1) 12 (0.8) 351 (22.9) 504 (32.9) 663 (43.3) Manager 430 (8.5) 26.56 (17.8 - 39.2) 6 (1.4) 114 (26.5) 993 (44.9) 117 (27.2) Retired 188 (3.7) 29.14 (21.8 - 36.7) 0 (0.0) 18 (9.6) 50 (26.6) 120 (63.8) Housewife 434 (8.6) 29.47 (19.5 - 46.1) 0 (0.0) 72 (16.6) 89 (20.5) 273 (62.9)
Level of education(*R Square = 0.040, p < 0.05, **X2 = 169.330, df = 6, p < 0.001)
Primary 788 (15.6) 28.82 (17.3 - 46.1) 2 (0.3) 141 (17.9) 218 (27.7) 427 (54.2) Secondary 381 (7.6) 27.88 (19.0 - 41.9) 0 (0.0) 93 (24.4) 115 (30.2) 173 (45.4) High school 1710 (34.0) 27.23 (17.3 - 42.0) 19 (1.1) 463 (27.1) 551 (30.2) 677 (39.6) University 2157 (42.8) 26.34 (16.7 - 43.3) 39 (1.8) 746 (34.6) 713 (33.1) 659 (30.6)
Marital status(*R Square = 0.012, p < 0.05, **X2 = 108.441, df = 3, p < 0.001)
Married 4191 (83.2) 27.36 (17.3 - 46.1) 31 (0.7) 1110 (26.5) 1384 (33.0) 1666 (39.8) Unmarried &
Widowed 845 (16.8) 26.10 (16.7 - 43.3) 29 (3.4) 333 (39.4) 213 (25.2) 270 (32.0)
(Assessments were made by combining 1-2Underweight and Normal and 3Obese I-II-III groups in statistical
analyzes).
and relationship levels between health risk limits and age groups are given in Table 4. According to the ratios of WHR (men > 1.0; 17.1%, women > 0.80; 82.1%) and WC (men 102 cm; 29.3, women 88 cm; 38.2%), women were found to have higher ratios than men in terms of prevalence and that in general popu-lation WHR risk ratio was 44.6% and WC risk ratio was 33.0% (Table 4, p < 0.001).
DOI: 10.4236/health.2018.106063 845 Health
Table 3. Distribution based on the Waist circumference abdominal obesity prevalence and chronic disease status variable of the men and women.
WC* Body Type**
Total Mean Underweight1 Normal2 Overweight Obese3
Chronic
disease status n (%) CI (min - max) n (%) n (%) n (%) n (%) Men (*ANOVA; F = 10.888, df = 4, p < 0.001, **X2 = 13.909, df = 8, p < 0.05)
No disease 1912 (65.8) 95.89 (60 - 145) 20 (1.0) 497 (26.0) 670 (35.0) 725 (37.9) Diabetes 152 (5.2) 99.25 (79 - 140) 0 (0.0) 34 (22.4) 54 (35.5) 64 (42.1) Hypertension 221 (7.6) 99.63 (72 - 123) 0 (0.0) 44 (19.9) 79 (35.7) 98 (44.3) Cardiovascular
Diseases 166 (5.7) 96.35 (66 - 123) 9 (5.4) 31 (18.7) 72 (43.4) 54 (32.5) Other Diseases 454 (15.8) 96.62 (72 - 140) 1 (0.2) 105 (23.1) 161 (35.5) 187 (41.2)
Women (*ANOVA; F = 55.393, df = 4, p < 0.001, **X2 = 138.693, df = 8, p < 0.001)
No disease 1394 (65.4) 82.95 (50 - 115) 30 (2.2) 534 (38.3) 393 (28.2) 437 (31.3) Diabetes 68 (3.2) 94.24 (69 - 122) 0 (0.0) 12 (17.6) 8 (11.8) 48 (70.6) Hypertension 210 (9.9) 92.77 (68 - 140) 0 (0.0) 32 (15.2) 38 (18.1) 140 (66.7) Cardiovascular
Diseases 74 (3.5) 87.92 (71 - 110) 0 (0.0) 23 (31.1 14 (18.9) 37 (50.0) Other Diseases 385 (18.1) 85.72 (65 - 114) 0 (0.0) 131 (34.0) 108 (28.1) 146 (37.9)
Total Group (*ANOVA; F = 43.041, df = 4, p < 0.001, **X2 = 93,557, df = 8, p < 0.001)
No disease 3306 (65.6) 90.43 (50 - 145) 50 (1.5) (31.2) 1031 1063 (32.2) 1162 (35.1)
Diabetes 220 (4.4) 97.70 (69 - 140) 0 (0.0) 46 (20.9) 62 (28.2) 112 (50.9) Hypertension 431 (8.6) 96.29 (68 - 140) 0 (0.0) 76 (17.6) 117 (27.1) 238 (55.2) Cardiovascular
Diseases 240 (4.8) 93.75 (66 - 123) 9 (3.8) 54 (22.5) 86 (35.8) 91 (37.9) Other Diseases 839 (16.7) 91.62 (65 - 140) 1 (0.1) 236 (28.1) 269 (32.1) 333 (39.7)
(Assessments were made by combining 1-2Underweight and Normal and 3Obese I-II-III groups in statistical
analyzes).
Within the binary logistic regression analysis model, two variables – depen-dent variables as “There is the problem of obesity” (those overweight and having body shape of obese I-II-III) and “There is not the problem of obesity” (those having underweight-normal body shape) were taken as basis. Independent va-riables were assessed as sex, age, level of education, marital status, the place of living (city center-countryside), occupation, physical activity, health responsibil-ity and nutrition habits. Model estimates obtained from analysis results are given
in Table 6. Based on the sex variable, men were found to have higher level of
obesity significantly (Odds = 1.232, 95% Exp(β) = 1.072 - 1.416 p = 0.003). Ac-cordingly, it is estimated that men have 1.232 times more obesity than women. Based on age variable, it was calculated that as the level of age increased, the level of obesity rose and that the impact of age on the rise in obesity levels was 1.740 times more. Considering the impact of level of education on obesity (Odds =
0.880, 95% Exp(β) = 0.823 - 0.940 p = 0.001), primary school graduates faced
DOI: 10.4236/health.2018.106063 846 Health
Table 4. Distribution of WHR and WC health risk ratios of men and women based on age groups.
WHR; Waist to hip ratio. WC; Waist circumference central obesity.
Age groups
Optimal WHR ≤0.80 and ≤1.0
N (%)
Men WHR ≥ 1.0
n (%)
Women WHR ≥ 0.80
n (%)
Total WHR Risk
n (%)
Optimal WC ≤88 and ≤102
n (%)
Men WC ≥ 102 cm
n (%)
Women WC ≥ 88 cm
n (%)
Total WC Risk
n (%)
20 - 24 203 (87.1) 2 (1.5) 28 (28.0) 30 (12.8) 222 (95.3) 1 (0.8) 10 (10.0) 11 (4.7) 25 - 29 337 (75.4) 2 (0.8) 108 (52.7) 110 (24.6) 388 (86.8) 19 (7.9) 40 (19.5) 59 (13.2) 30 - 34 435 (57.9) 3 (0.9) 313 (74.5) 316 (38.9) 601 (80.0) 46 (13.9) 104 (24.8) 150 (20.0) 35 - 39 420 (51.7) 14 (3.9) 379 (84.0) 393 (37.4) 606 (56.3) 73 (20.2)) 134 (29.7) 207 (25.5) 40 - 44 578 (55.0) 76 (12.1) 396 (94.3) 472 (53.4) 721 (68.7) 165 (26.2) 164 (39.0)) 329 (31.3) 45 - 49 452 (51.1) 153 (25.7) 279 (96.9) 432 (48.9) 450 (50.9) 252 (42.3) 182 (63.2) 434 (49.1) 50 - 54 230 (42.9) 160 (41.1) 146 (99.3) 306 (57.1) 241 (45.0) 201 (51.7) 94 (63.9) 295 (55.0) 55 - 59 110 (43.3) 75 (40.5) 69 (100.0) 144 (56.7) 120 (47.2) 77 (41.6) 57 (82.6) 134 (52.8) Above 60 26 (38.2) 11 (29.7) 31 (100.0) 42 (61.8) 23 (33.8) 17 (45.9) 28 (90.3) 45 (66.2)
Total 2791 (55.4) 496 (17.1) 1749 (82.1) 2245 (44.6) 3337 (67.0) 851 (29.3) 813 (38.2) 1664 (33.0) X2 = 483.034, df = 8, p < 0.001 X2 = 52.062, df = 8, p < 0.001
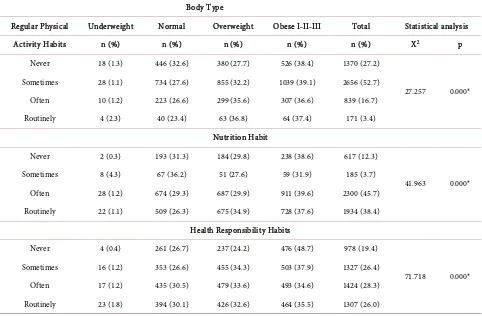
Table 5. Distribution of physical activity, nutrition and health responsibility habits of subjects as healthy lifestyle behaviors.
Body Type
Regular Physical Underweight Normal Overweight Obese I-II-III Total Statistical analysis
Activity Habits n (%) n (%) n (%) n (%) n (%) X2 p
Never 18 (1.3) 446 (32.6) 380 (27.7) 526 (38.4) 1370 (27.2)
27.257 0.000* Sometimes 28 (1.1) 734 (27.6) 855 (32.2) 1039 (39.1) 2656 (52.7)
Often 10 (1.2) 223 (26.6) 299 (35.6) 307 (36.6) 839 (16.7) Routinely 4 (2.3) 40 (23.4) 63 (36.8) 64 (37.4) 171 (3.4)
Nutrition Habit
Never 2 (0.3) 193 (31.3) 184 (29.8) 238 (38.6) 617 (12.3)
41.963 0.000* Sometimes 8 (4.3) 67 (36.2) 51 (27.6) 59 (31.9) 185 (3.7)
Often 28 (1.2) 674 (29.3) 687 (29.9) 911 (39.6) 2300 (45.7) Routinely 22 (1.1) 509 (26.3) 675 (34.9) 728 (37.6) 1934 (38.4)
Health Responsibility Habits
Never 4 (0.4) 261 (26.7) 237 (24.2) 476 (48.7) 978 (19.4)
71.718 0.000* Sometimes 16 (1.2) 353 (26.6) 455 (34.3) 503 (37.9) 1327 (26.4)
Often 17 (1.2) 435 (30.5) 479 (33.6) 493 (34.6) 1424 (28.3) Routinely 23 (1.8) 394 (30.1) 426 (32.6) 464 (35.5) 1307 (26.0)
[image:9.595.57.539.397.713.2]DOI: 10.4236/health.2018.106063 847 Health
Table 6. Binary logistic regression analysis results of obesity prevalence based on some variables.
Variables β S.E Wald p Odd (Exp (β) 95.0% C.I. for Exp(β)
Sex 0.209 0.071 8.686 0.003 1.232 1.072 - 1.416
Age 0.554 0.022 618.585 0.001 1.740 1.666 - 1.818
Level of education −0.128 0.034 14.233 0.001 0.880 0.823 - 0.940
Marital status −0.378 0.092 17.030 0.001 0.685 0.573 - 0.820
Residential places 0.081 0.076 1.133 0.287 1.085 0.934 - 1.259
Occupation 0.092 0.028 10.594 0.001 1.097 1.037 - 1.160
Regular Physical Activity Habits 0.203 0.051 15.896 0.001 1.225 1.109 - 1.354 Health Responsibility Habits −0.154 0.049 9.908 0.002 0.857 0.779 - 0.943
Nutrition Habit 0.093 0.033 8.143 0.004 1.098 1.030 - 1.170
Constant −0.703 0.200 12.417 0.001 0.495
4. Discussion
Obesity and overweight are among the critical public health problems as they affect a third of the world population. Obesity prevalence has different patterns not only internationally but also nationally. These differences vary mainly de-pending on socio-economic situation or level of urbanization [10] [23]. The rise in obesity over the past 35 years has been affected by various potential factors such as rises in the calorie intake, changes in dietary composition, decrease in physical activities and changes in intestine microbiome [23] [24] [25] [26]. It is reported that obesity rates in the world have tripled since 1975 and that 39% of adults at the age of and over 18 were overweight and 13% of them were obese in
2016 [27]. Considering the obesity rates in Organization for
Economic-Co-operation and Development (OECD) countries, it is shown that in 2015 US had highest obesity rates with 38.2% followed by Mexico with 32.4% among the adults. Turkey is ranked the 13th with 22.3% [28]. While obesity prevalence was 15.2 in 2008, it rose to by 19.9% in 2014 and by 8.3% in 2017, reaching a rate of 22.3%. Turkey is ranked the 27th based on the adult obesity levels around the
world with 29.5% of the adult population being obese [27]. In this
DOI: 10.4236/health.2018.106063 848 Health [31]. Elazığ, which is located in East Anatolia Region where the obesity preva-lence was found 20% - 22%, from which the study population was chosen, was found to have a much higher level of obesity with 38.4%. According to a report in 2016, causes of death in Turkey stem from circulatory system-based diseases with 39.8%, cancer with 19.7% and respiratory system-based diseases with 11.9%. It was determined that among these circulator system-based deaths arise from ischemic with 40.5%, cerebro-vascular disease with 23.6% and hypertensive disease with 8.8% [32]. This applies to Elazığ, which comprises the study popu-lation in the study. According to data obtained in 2017, it was shown that the main causes of death were cardiac diseases at the top followed by cancer diseases [33]. WHO reports that obesity induces a range of diseases such as hypertension, hyperlipidemia, cardiac-circulatory failure and diabetes mellitus and thus affects organs and systems of the body [27]. Obesity and inactive lifestyle are potential factors in diseases ranked at the top of death causes.
According to the reports of WHO, while the rate of obese children and ado-lescents at the age of 5 - 19 was just under 1% in 1975, in 2016 6% of girls and 8% of boys were obese [27]. Globally the main reason of the obesity and over-weight is the calorie intake and degeneration of the energy between these calo-ries. This study has shown that those living in the city center 38.4% are more obese than those living outside the city center 31.6% (Table 2). This situation matches up with WHO findings. It can be concluded that rise in high-energy fatty food consumption and physical inactivity caused by changing inactive life-style and rise in urbanization are among the primary factors that trigger the ob-esity [27]. However, it is reported that in some countries obob-esity rates increase or decrease more slowly [34]. According to the OECD 2015 reports, the level of obesity is the lowest in Japan with 3.7%, India with 5.0%, in Italy with 9.8% and Switzerland with 10.3% respectively [28].
DOI: 10.4236/health.2018.106063 849 Health found as 44.6% in WC and 33.0% in WHR within the general population of this study. It was also observed that rising in parallel with the increasing age, the ab-dominal obesity level posed a critical health risk (Table 4) and especially those with hypertension and diabetes had obesity level of 50% - 55% (Table 3) and that findings overlapped the literature [37] [38] [39].
Recently obesity and overweight prevalence has increased in many industrial countries, making it depressing for many populations. It is reported that more particularly in developing countries along with the developing level of welfare and domestic income, reasons such as changes in nutrition habits of individuals and insufficient physical activities increase the level of obesity [4] [40] [41] [42]. This study backs up this report as it shows that subjects have healthy lifestyle behaviors with low rates of 3.4% for regular physical activity, 26.0% for health responsibility and 38.4% for regular nutrition habits (Table 5). It is believed that this fact creates a risk for public health for the province. Every individual has the responsibility to protect their health and turn this into a healthy lifestyle habit. Therefore, positive health behaviors are regarded as conscious efforts to keep the community health. It was determined in this study that workers (43.3%), retirees (63.8%) and housewives (62.9%) in occupation variable, primary school gra-duates (54.2%) in level of education variable, the married ones (39.8%) in marit-al status variable had higher level of obesity (Table 2). According to the findings of binary logistic regression analysis (Table 6), primary school graduates had 0.88 times more obesity level than university graduates; married ones had 0.68 times more obesity level than singles or widows; workers, retirees and house-wives had 1.097 times more obesity level than those with other occupations; those without physical activity habits had 1.225 times more level of obesity; those with irregular nutrition habits had 1.098 times more level of obesity; and those with irregular health responsibility habits had higher level of obesity. Reg-ular physical activity not only helps maintain the energy balance but also plays a key role in decreasing health risks arisen from the obesity and the mortality rate caused by these risks [40]. Though regular physical activity is seen as the key fact of a healthy lifestyle, an increasingly prevalent inactive lifestyle in the society complicates the treatment process of the obesity. This situation bears hard on economies of countries with huge expenditures on health.
5. Conclusion
As a conclusion, alterations in obesity prevalence in Turkey and around the world continue to be a huge problem as the danger is imminent. As seen from findings of this study, main crucial factors causing obesity prevalence are seden-tary lifestyle, insufficient physical activity, nutrition and health responsibility habits, posing a risk for health. It is concluded that more particularly developing countries should take preventive measures.
Acknowledgements
DOI: 10.4236/health.2018.106063 850 Health support. Furthermore authors are thankful to the relevant unit, staff of Provin-cial Health Directorate and researchers for their devotion.
References
[1] AMA Adopts New Policies on Second Day of Voting at Annual Meeting, 18 June 2013. [Web Page]
http://www.marketwired.com/press-release/ama-adopts-new-policies-on-second-da y-of-voting-at-annual-meeting-1803251.htm
[2] Hruby, A. and Hu, F.B. (2015) The Epidemiology of Obesity: A Big Picture. Phar-macoEconomics, 33, 673-689.https://doi.org/10.1007/s40273-014-0243-x
[3] Gretchen, A.S., Gitanjali, M.S., Yuan, L, et al. (2012) National, Regional, and Global Trends in Adult Overweight and Obesity Prevalences. Population Health Metrics, 10, 1-16.
[4] WHO (1997) Obesity Preventing and Managingthe Global Epidemic. Report of the WHO Consultation on Obesity. WHO, Geneva.
[5] Flegal, K.M., Carroll, M.D., Kuczmarski, R.J., et al. (1998) Overweight and Obesity in the United States: Prevalence and Trends, 1960-1994. International Journal of Obesity,22, 39-47.https://doi.org/10.1038/sj.ijo.0800541
[6] Kelly, T., Yang, W., Chen, C.S., et al. (2008) Global Burden of Obesity in 2005 and Projections to 2030. International Journal of Obesity,32, 1431-1437.
https://doi.org/10.1038/ijo.2008.102
[7] Wang, Y., Beydoun, M.A., Liang, L., et al. (2008) Will All Americans Become Overweight or Obese? Estimating the Progression and Cost of the US Obesity Epi-demic. Obesity Silver Spring Md., 16, 2323-2330.
https://doi.org/10.1038/oby.2008.351
[8] Arslan, C., Savucu, Y. and Ceviz, D. (2011) Evaluation of the Body Composition, Blood Lipids and Health Life-Style in Employment and Unemployment Women.
HealthMED, 5, 699-710.
[9] Doucet, E. and Tremblay, A. (1997) Food Intake, Energy Balance and Body Weight Control. European Journal of Clinical Nutrition, 51, 846-855.
https://doi.org/10.1038/sj.ejcn.1600497
[10] WHO (1995) Physical Status: The Use and Interpretation of Anthropometry. Re-port of a WHO Expert Committee. WHO Technical ReRe-port Series 854. World Health Organization, Geneva.
[11] Wang, Z.M., Pierson Jr, R.N. and Heymsfield, S.B. (1992) The Five-Level Model: A New Approach to Organizing Body Composition Research. The American Journal of Clinical Nutrition, 56, 19-28.https://doi.org/10.1093/ajcn/56.1.19
[12] Siavash, M., Sadeghi, M., Salarifar, F., et al. (2008) Comparison of Body Mass Index and Waist/Height Ratio in Predicting Definite Coronary Artery Disease. Annals of Nutrition and Metabolism, 53,162-166. https://doi.org/10.1159/000172977 [13] Lukaski, H.C. (2003) Regional Bioelectrical Impedance Analysis: Applications in
Health and Medicine. Acta Diabetologica, 40, 196-199.
https://doi.org/10.1007/s00592-003-0064-4
[14] Han, T.S. and Lean, M.E.J. (2001) Anthropometric Indices of Obesity and Regional Distribution of Fat Depots. In: Bjorntorp, P., Ed., International Textbook of Obesi-ty. Chapter 4, John Wiley & Sons, London, Chichester, 49-65.
https://doi.org/10.1002/0470846739.ch4
DOI: 10.4236/health.2018.106063 851 Health
and Relationship to Non-Insulin Dependent Diabetes Mellitus. Diabetes/Metabolism Reviews, 5, 83-109.https://doi.org/10.1002/dmr.5610050202
[16] Edelman, C., Mandle, C.L. and Elizabeth, C.K. (2018) Health Promotion throughout the Life Span. 127.
https://books.google.com.tr/books?id=ndwDAQAAQBAJ&printsec=frontcover&hl =tr&source=gbs_ge_summary_r&cad=0#v=onepage&q&f=false
[17] Pender, N.J. (1987) Health Promotion in Nursing Practice. Second Edition, Jones & Bartlett Learning, Burlington.
[18] Redland, A.R. and Stuifbergen, A.K. (1993) Strategies for Maintenance of Health-Promoting Behavior. Nursing Clinics of North America, 28, 427-441. [19] Komduur, R.H., Korthals, M. and Molder, H. (2009) The Good Life: Living for
Health and a Life without Risks? On a Prominent Script of Nutrigenomics. British Journal of Nutrition, 101, 307-316.https://doi.org/10.1017/S0007114508076253
[20] Walker, S.N., Sechrist, K.R. and Pender, N.J. (1987) The Health-Promoting Lifestyle Profile: Development and Psychometric Characteristics. Nursing Research, 36, 76-81. https://doi.org/10.1097/00006199-198703000-00002
[21] Esin, N. (1999) Adapting the Scale of Healthy Lifestyle Behaviors to Turkish. Nurs-ing Bulletin, 12, 87-95.
[22] Jawon Medical Co. Ltd. Korean. Avis 333 Plus. Segmental Body Composition Ana-lyzer. http://jawon.co.kr/eng/02hospital/nproduct8.php
[23] Ng, M., Fleming, T., Robinson, M., et al. (2014) Global, Regional, and National Prevalence of Overweight and Obesity in Children and Adults during 1980-2013: A Systematic Analysis for the Global Burden of Disease Study 2013. TheLancet, 384, 766-781.https://doi.org/10.1016/S0140-6736(14)60460-8
[24] Prentice, A. and Jebb, S. (2004) Energy Intake/Physical Activity Interactions in the Homeostasis of Body Weight Regulation. Nutrition Reviews, 62, 98-104.
https://doi.org/10.1301/nr.2004.jul.S98-S104
[25] Bleich, S., Cutler, D., Murray, C., et al. (2008) Why Is the Developed World Obese?
Annual Review of Public Health, 29, 273-295.
https://doi.org/10.1146/annurev.publhealth.29.020907.090954
[26] Astrup, A. and Brand-Miller, J. (2012) Diet Composition and Obesity. TheLancet. 379, 1100-1101.https://doi.org/10.1016/S0140-6736(12)60456-5
[27] WHO (2017) Obesity and Overweight Factsheet from the WHO.
http://www.who.int/mediacentre/factsheets/fs311/en/ [28] OECD Health Statistics 2017. Obesity Update.
http://www.oecd.org/health/health-systems/Obesity-Update-2017.pdf
[29] Erem, C., Arslan, C., Hacihasanoglu, A., et al. (2004) Prevalence of Obesity and As-sociated Risk Factors in a Turkish Population (Trabzon City, Turkey). Obesity Re-search, 12, 1117-1127.https://doi.org/10.1038/oby.2004.140
[30] Turnagöl, H. (2017) Healthy Nutrition and Obesity.
http://www.ankakon2017.com/sunumlar/husrev_turnagol.pdf
[31] Satman, I., Omer, B., Tutuncu, Y., et al. (2013) Twelve-Year Trends in the Preva-lence and Risk Factors of Diabetes and Prediabetes in Turkish Adults. European Journal of Epidemiology, 28, 169-180.
https://link.springer.com/content/pdf/10.1007%2Fs10654-013-9771-5.pdf [32] Turkish Statistical Institute (TUIK). Death Reason Statistics 2016.
DOI: 10.4236/health.2018.106063 852 Health
[33] Provincial Directorate of Health (SIM) (2018) Reasons for Death in 2017. Elazig. [34] Report: Obesity Rates by Country 2017.
https://renewbariatrics.com/obesity-rank-by-countries/
[35] Baumgartner, R.N. (2000) Body Composition in Healthy Aging. Annals of the New York Academy of Sciences, 904, 437-448.
https://doi.org/10.1111/j.1749-6632.2000.tb06498.x
[36] Ryan, A.S., Serra, M.C. and Goldberg, A.P. (2018) Metabolic Benefits of Prior Weight Loss with and without Exercise on Subsequent 6-Month Weight Regain.
Obesity (Silver Spring), 26, 37-44.https://doi.org/10.1002/oby.22032
[37] Lind, L., Carlsson, A.C., Siegbahn, A., et al. (2017) Impact of Physical Activity on Cardiovascular Status in Obesity. European Journal of Clinical Investigation, 47, 167-175. https://doi.org/10.1111/eci.12722
[38] Han, Q., Shao, P., Leng, J., et al. (2018) Interactions between General and Central Obesity in Predicting Gestational Diabetes Mellitus in Chinese Pregnant Women: A Prospective Population-Based Study in Tianjin, China. Journal of Diabetes, 10, 59-67.https://doi.org/10.1111/1753-0407.12558
[39] Besler, H.T., Bilici, S., Buzgan, T., et al. (2010) Turkey Obesity Fight and Control Program (2010-2014). Ministry of Health General Directorate of Primary Health Care Publication No. 773, Ankara.
[40] Mcinnis, K.J., Franklin, B.A. and Rippe, J.M. (2003) Counseling for Physical Activi-ty in Overweight and Obese Patients. American Family Physician, 67, 1249-1256. [41] Asp, M., Simonsson, B., Larm, P., et al. (2017) Physical Mobility, Physical Activity,
and Obesity among Elderly: Findings from a Large Population-Based Swedish Sur-vey. Public Health, 147, 84-91.https://doi.org/10.1016/j.puhe.2017.01.032