ISSN Print: 2327-4077
DOI: 10.4236/jmmce.2018.63026 May 17, 2018 373 J. Minerals and Materials Characterization and Engineering
The High Surface Ratio Micro-MoS
2
Grain
Composed of MoS
2
Nanosheet Prepared with
One-Step Hydrothermal Synthesis
Guangtong Zhou
1, Xiangbin Zeng
2*, Wenzhao Wang
2, Yishuo Hu
2, Sue Xu
1, Shaoxiong Wu
2,
Yang Zeng
2, Wen Jing
1, Tingting Ren
2, Zhenyu Guo
2, Pengfei Xu
2, Haoran Li
2, Yushu Tang
21China-EU Institute for Clean and Renewable Energy, Huazhong University of Science and Technology, Wuhan, China 2School of Optical and Electronic Information, Huazhong University of Science and Technology, Wuhan, China
Abstract
Micro molybdenum disulfide was prepared with one-step hydrothermal me-thod; the influence of reactant concentration and temperature on the surface ratio of micro-MoS2 grain was investigated. Raman spectroscopy (Raman), X-ray diffraction (XRD), and Scanning electron microscopy (SEM) were used to characterize the structure, composition and morphology of MoS2. The re-sults show that micro-MoS2 grains were synthesized with one-step hydro-thermal synthesis, and the morphology of micro-MoS2 grains is like flower and sphere. The SEM figures indicate that the surface ratio of micro-MoS2 grains is different and also show that the surface ratio of micro-MoS2 grains can be improved by regulating reactant concentration and temperature. This research showed a method to improve the surface ratio of micro-MoS2 grains.
Keywords
Micro-MoS2 Grain, Hydrothermal, One-Step Reaction, Nanosheet
1. Introduction
The transition metal dichalcogenide (TMDC) attracted great attention due to their excellent chemical, electrical and optical properties over the past decade [1] [2] [3]. Graphene was the first 2D material to be found [4] [5]. Graphene has very high carrier mobility, strength, surface area and thermal conduction capa-bility [6] [7] [8] [9] [10], so graphene has great potential applicant in many fields. But graphene’s band gap is zero, limiting its electronic applications. Mo-lybdenum disulfide (MoS2) is the most studied TMDC, which has a special mi-How to cite this paper: Zhou, G.T., Zeng,
X.B., Wang, W.Z., Hu, Y.S., Xu, S., Wu, S.X., Zeng, Y., Jing, W., Ren, T.T., Guo, Z.Y., Xu, P.F., Li, H.R. and Tang, Y.S. (2018) The High Surface Ratio Micro-MoS2 Grain Composed of MoS2 Nanosheet Pre-pared with One-Step Hydrothermal Syn-thesis. Journal of Minerals and Materials Characterization and Engineering, 6, 373-381.
https://doi.org/10.4236/jmmce.2018.63026
Received: March 29, 2018 Accepted: May 14, 2018 Published: May 17, 2018
Copyright © 2018 by authors and Scientific Research Publishing Inc. This work is licensed under the Creative Commons Attribution International License (CC BY 4.0).
http://creativecommons.org/licenses/by/4.0/
DOI: 10.4236/jmmce.2018.63026 374 J. Minerals and Materials Characterization and Engineering crostructure like sandwich (S-Mo-S), Mo-layer between two sulfur layers by co-valent forces, and is relatively abundant as a mineral and well-known for tribo-logical, petroleum desulfurization and catalytic applications [11].
Because of its high surface ratio, micro-size MoS2 plays a crucial role in bat-tery cathodes domain [12]. The devices of energy-storage play an important role in reducing the emission of greenhouse gas, wasting of resources and the envi-ronmental pollution [13] [14] [15] [16] [17]. MoS2 could be used in these devices of energy-storage. L. X. Chen etc. improved the capacity retention rate of the composite electrode up to 50.5% at the current density of 3000 mAg−1 when dis-charging through coating MoS2 on the surface of hydrogen storage alloys [18].
The gas molecules can infiltrate and diffuse freely between the vertically stacked S-Mo-S layers. After the adsorption and diffusion of gas molecules tween the S-Mo-S layers, the resistance of MoS2 will change prominently; be-cause of that tremendous research has been made in gas sensing application, such as the detectors for H2O, NH3, NO and many other chemical vapors [19]-[29], but there is little research on systematic study about improving the surface ratio of MoS2.
Here, we report the synthesis of the micro-MoS2 composed of MoS2 nanosheet with high surface ratio.
Through regulating the concentration of the reactant and the temperature, the morphology and the size of the MoS2 grain will be different. This work shows that the surface ratio of micro-MoS2 grains can be improved by regulating reac-tant concentration and temperature.
2. Experimental
2.1. Preparation of Samples
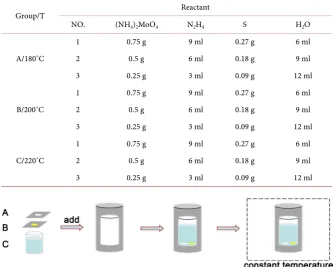
The (NH4)2MoO4, N2H4 and S (All purchased from the Sinopharm Chemical Reagent Co., Ltd.) are the reagents used in the experiment, and they are all ana-lytical purity. The reaction vessels (autoclaves) are 25 ml polytetrafluoroethylene liner, which must be wrapped in the stainless hydrothermal reactor. Nine autoc-laves were divided into 3 groups (A, B, C). The reaction temperature of and the reactant concentration of group A, B, C are different, the details are shown in Table 1.
2.2. Experimental Methods
DOI: 10.4236/jmmce.2018.63026 375 J. Minerals and Materials Characterization and Engineering
Table 1. Reactant quantity and temperature of group A, B, C.
Group/T Reactant
NO. (NH4)2MoO4 N2H4 S H2O
A/180˚C
1 0.75 g 9 ml 0.27 g 6 ml
2 0.5 g 6 ml 0.18 g 9 ml
3 0.25 g 3 ml 0.09 g 12 ml
B/200˚C
1 0.75 g 9 ml 0.27 g 6 ml
2 0.5 g 6 ml 0.18 g 9 ml
3 0.25 g 3 ml 0.09 g 12 ml
C/220˚C
1 0.75 g 9 ml 0.27 g 6 ml
2 0.5 g 6 ml 0.18 g 9 ml
3 0.25 g 3 ml 0.09 g 12 ml
Figure 1. Schematic diagram of processes of the hydrothermal synthesis (A: (NH4)2MoO4,
B: S, C: N2H4 and deionized water).
2.3. Characterization of the Composition, Structure and
Morphology of As-Prepared MoS
2/MoO
3and MoS
2Samples
Laser confocal Raman spectroscopy (Horiba JobinYvon LabRAM HR800 532 nm 200 - 1100), Crystal structure was analyzed by X-ray diffraction (PANalytical PW3040/60, voltage 40 kV, current 40 mA, Cu Kα radiation (λ = 1.5406), 2θ = 10˚ - 80˚). Morphologies and compositions of the samples were characterized using scanning electron microscopy (SEM, HITACHI S-4800, 5.0 kV).
3. Result and Discussion
[image:3.595.206.540.91.358.2]DOI: 10.4236/jmmce.2018.63026 376 J. Minerals and Materials Characterization and Engineering
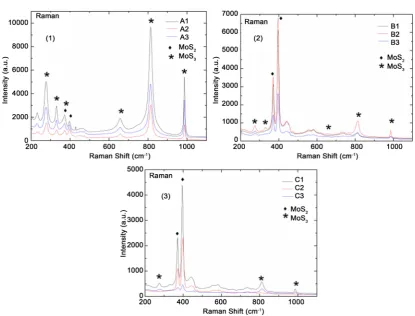
Figure 2. Raman spectra of group A(1), B(2) and C(3).
mode) appear which approved the existence of MoS2 [31].
Figure 3 shows the XRD patterns of groups A, B, C, the picture (1), (2) and (3) are the XRD patterns of group A, B, C. There are there obvious diffraction peaks at 2˚ of 14.1, 32.9˚, 35.9˚, that corresponding to (0 0 2), (1 0 0) and (1 0 2) planes of MoS2 in every group, which suggests that MoS2 is synthesized (JCPDS 75-1539). There are three diffraction peaks at 2˚ of 12.0˚, 12.8˚and 17.6˚, that corresponding to (0 0 1), (0 1 0) and (0 1 1) planes of MoO3 in group A, which suggests that the MoS2 synthesized in group A contain MoO3 (JCPDS 73-1544)
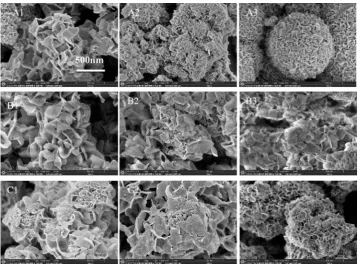
Figure 4 shows the SEM images of groups A, B, C. We can see that every group consists of MoS2 nanosheet, the MoS2 nanosheet is about 14 nm thickness, but the size of the nanosheet is different, temperature and concentration impact the morphology of MoS2, the higher the concentration of reactant the bigger the nanosheet will be produced, the higher the temperature the bigger the nanosheet will be produced. A3 generated microsphere structure and its diameter is 1.215 µm, when the concentration increase from A3 to A2 and A1 the microsphere structure disappeared, so low concentration of reactant is good for generating microsphere structure. From the comparison of A3, B3 and C3 we can see that microsphere structure did not appear at high temperature (200˚C, 220˚C), so high temperature (>200˚C) will restrain the generating of microsphere structure.
DOI: 10.4236/jmmce.2018.63026 377 J. Minerals and Materials Characterization and Engineering
Figure 3. XRD patterns of group A, B and C, typical patterns of MoS2 and MoO3 (JCPDS 75-1539, JCPDS 73-1544).
[image:5.595.143.504.444.709.2]DOI: 10.4236/jmmce.2018.63026 378 J. Minerals and Materials Characterization and Engineering will determine the size and amount of nanosheet in a unit of the grain (surface ratio), so the surface of MoS2 nanosheets will be different in surface ratio. From Figure 4 it can be easily found that when the concentration increase from A3 to A2 and A1 the distance between the nearby MoS2 nanosheets increasing, when the temperature increase from 180˚C to 200˚C and 220˚C the distance between the nearby MoS2 nanosheet increasing.
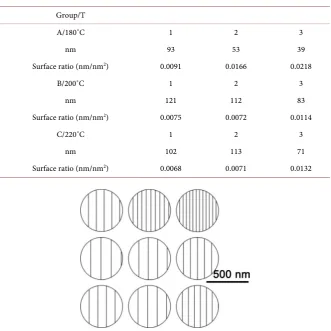
From Figure 4 to get 20 points, in order to get the average distance of the nearby MoS2 nanosheet as shown in the Table 2. To simplify the calculation, it is assumed that all the morphology of each group are sphere and only one surface across the body-center of the sphere as shown in Figure 5, the simplified calcu-lation results show in the Table 2. From the result, it can be seen that when the concentration increase from A3 to A2 and A1 the surface ratio of the nearby MoS2 nanosheet decrease, when the temperature increase from 180˚C to 200˚C and 220˚C the surface ratio of the nearby MoS2 nanosheet increasing andA3 has the highest surface ratio 0.0218 nm/nm2.
[image:6.595.208.540.377.708.2]On the micro level, the kinetic energy of the molecule is proportional to the temperature. It is obvious that the temperature gradient exist in the reaction vessels, so the kinetic energy of the H2O molecule are different in the direction of
Table 2. The approximate value of the distance between nearby MoS2 nanosheet of group
A, B, C.
Group/T
A/180˚C 1 2 3
nm 93 53 39
Surface ratio (nm/nm2) 0.0091 0.0166 0.0218
B/200˚C 1 2 3
nm 121 112 83
Surface ratio (nm/nm2) 0.0075 0.0072 0.0114
C/220˚C 1 2 3
nm 102 113 71
Surface ratio (nm/nm2) 0.0068 0.0071 0.0132
DOI: 10.4236/jmmce.2018.63026 379 J. Minerals and Materials Characterization and Engineering the temperature gradient, so when temperature increasing, the kinetic energy of the H2O molecule increase and there will be more H2O molecule knock the MoS2 nanosheet, when its impact is bigger than the Van de Waals force, the Van de Waals force cannot to draw the nearby MoS2 nanosheet to get closer, so the dis-tance of the nearby MoS2 nanosheet will be far. At the beginning of the reaction, MoS2 tend to form nanosheet to different direction, when the concentration of reactant is small, the rapid of forming the MoS2 nanosheet is relatively slow, the Van de Waals force have enough time to draw the nearby MoS2 nanosheet to get close, so the distance of the nearby MoS2 nanosheet is small, on the contrary when the concentration of reactant is high, the rapid of forming the MoS2 na-nosheet is relatively fast, before the Van de Waals force drawing the nearby MoS2 nanosheet to get more close the MoS2 nanosheet have formed a steady structure that can balance it, so the distance of the nearby MoS2 nanosheet is far, but as the reaction going on the concentration of reactant will become small, so near the last formed nearby MoS2 nanosheet their distance will be small, that ex-plained why in the high concentration situation the distance of the nearby MoS2 nanosheet is inconformity so high concentration of reactant and temperature will increase the distance between the nearby MoS2 nanosheet and decrease the surface ratio of MoS2. In other words, low concentration of reactant and tem-perature will decrease the distance between the nearby MoS2 nanosheet and in-crease the surface ratio of MoS2, which could improve MoS2 to absorb and sto-rage gases.
4. Conclusion
The micro-MoS2 grains were synthesized with one-step hydrothermal synthesis. The micro-MoS2 grains are made of MoS2 nanosheet. Low concentration of reactant and temperature will be good for forming nanosheet and increase the distance between the nearby MoS2 nanosheet. Low concentration of reactant and temperature will increase the surface ratio of MoS2.
Acknowledgements
This work is supported by the National Natural Science Foundation of China (Grant No.51472096), the R&D Program of Ministry of Education of China (No.62501040202). The authors acknowledge the Analytical and Testing Center of Huazhong University of Science and Technology (HUST) for providing Ra-man measurements. The authors acknowledge the Advanced Manufacturing and Technology Experiment Center of Mechanical College for providing the field emission scanning electron microscope measurements.
References
[1] Mcdonnell, S.J. and Wallace, R.M. (1892) Atomically-Thin Layered Films for Device Applications Based upon 2D TMDC Materials. Thin Solid Films, 616, 482-501.
https://doi.org/10.1016/j.tsf.2016.08.068
DOI: 10.4236/jmmce.2018.63026 380 J. Minerals and Materials Characterization and Engineering
MoS2/TiO2/Si Nanowires Composite with Enhanced Photocatalytic Performance
under Visible Light. Materials & Design, 109, 634-643.
https://doi.org/10.1016/j.matdes.2016.07.098
[3] Zhang, W., Zhang, P., Su, Z. and Wei, G. (2015) Synthesis and Sensors Application of MoS2-Based Nanocomposites. Nanoscale, 7, 18.
https://doi.org/10.1039/C5NR06121K
[4] Novoselov, K.S., Geim, A.K., Morozov, S.V., Jiang, D., Zhang, Y., Dubonos, S.V., Grigorieva, I.V. and Firsov, A.A. (2004) Electric Field Effect in Atomically Thin Carbon Films. Science, 306, 666-669. https://doi.org/10.1126/science.1102896 [5] Geim, A.K. and Novoselov, K.S. (2009) The Rise of Graphene. Nature Materials, 6,
183-191. https://doi.org/10.1038/nmat1849
[6] Mccann, E. and Koshino, M. (2012) The Electronic Properties of Bilayer Graphene,
Reports on Progress in Physics, 76, Article ID: 056503.
[7] Lee, C., Wei, X., Kysar, J.W. and Hone, J. (2008) Strength of Monolayer Graphene Measurement of the Elastic Properties and Intrinsic. Science, 321, 385-388.
https://doi.org/10.1126/science.1157996
[8] Tiwari, A. (2015) Graphene-Based Composite Materials. Dissertations & Thes-es—Gradworks, 442, 282-286.
[9] Balandin, A.A., Ghosh, S., Bao, W., Calizo, I., Teweldebrhan, D., Miao, F. and Lau, C.N. (2008) Superior Thermal Conductivity of Single-Layer Graphene. Nano Let-ters, 8, 902-907. https://doi.org/10.1021/nl0731872
[10] Ghasemi, F. and Mohajerzadeh, S. (2016) Sequential Solvent Exchange Method for Con-Trolled Exfoliation of MoS2 Suitable for Phototransistor Fabrication. ACS
Ap-plied Materials & Interfaces, 8, 31179-31191.
[11] Yang, T., Cui, Y., Chen, M., et al. (2017) Uniform and Vertically Oriented ZnO Nano-Sheets Based on Thin-Layered MoS2: Synthesis and High-Sensing Ability.
ACS Sustainable Chemistry & Engineering, 5, 1332-1338.
[12] Cao, X.H., Shi, Y.M., Shi, W.H., Rui, X.H., Yan, Q.Y., Kong, J. and Zhang, H. (2013)
Preparation of MoS2 Coated Three Dimensional Graphene Networks for
High-Performance Anode Material in Lithium-Ion Batteries. Small, 9, 3433-3438.
https://doi.org/10.1002/smll.201202697
[13] Tran, M., Banister, D., Bishop, J.D.K. and McCulloch, M.D. (2012) Realizing the Electric-Vehicle Revolution. Nature Climate Change, 2, 328-333.
https://doi.org/10.1038/nclimate1429
[14] He, Y.B., Zhou, W., Yildirim, T. and Chen, B.L. (2013) A Series of Metal-Organic Frameworks with High Methane Uptake and an Empirical Equation for Predicting Methane Storage Capacity. Energy & Environmental Science, 6, 2735-2744.
https://doi.org/10.1039/c3ee41166d
[15] Gutfleisch, O., Willard, M.A., Bruck, E., Chen, C.H., Sankar, S.G. and Liu, J.P. (2011) Magnetic Materials and Devices for the 21st Century: Stronger, Lighter, and More Energy Efficient. Advanced Materials, 23, 821-842.
https://doi.org/10.1002/adma.201002180
[16] Jacobson, M.Z., Colella, W.G. and Golden, D.M. (2005) Cleaning the Air and Im-proving Health with Hydrogen Fuel-Cell Vehicles. Science, 308, 1901-1905. [17] Qi, T., Jiang, J.J., Chen, H.C., Wan, H.Z., Miao, L. and Zhang, L. (2013) Synergistic
Effect of Fe3O4/Reduced Grephene Oxide Nanocomposites for Supercapacitors with
Good Cycling Life. Electrochimica Acta, 114, 674-680.
DOI: 10.4236/jmmce.2018.63026 381 J. Minerals and Materials Characterization and Engineering
[18] Chen, L.X., Zhu, Y.F., Yang, C.C., et al. (2016) A New Strategy to Improve the High-Rate Performance of Hydrogen Storage Alloys with MoS2, Nanosheets.
Jour-nal of Power Sources, 333, 17-23. https://doi.org/10.1016/j.jpowsour.2016.09.148
[19] Baek, D.H. and Kim, J. (2017) MoS2, Gas Sensor Functionalized by Pd for the
De-tection of Hydrogen. Sensors & Actuators B: Chemical, 250, 686-691.
https://doi.org/10.1016/j.snb.2017.05.028
[20] Mcdonnell, S.J. and Wallace, R.M. (2016) Atomically-Thin Layered Films for Device Applications Based upon 2D TMDC Materials. Thin Solid Films, 616, 482-501. [21] Yao, Y., Tolentino, L., Yang, Z., Song, X., Zhang, W., Chen, Y. and Wong, C. (2013)
High-Concentration Aqueous Dispersions of MoS2. Advanced Functional Materials,
23, 3577-3583. https://doi.org/10.1002/adfm.201201843
[22] Late, D.J., Huang, Y.-K., Liu, B., Acharya, J., Shirodkar, S.N., Luo, J., Yang, A., Charles, D., Waghmare, U.V., Dravid, V.P. and Rao, C.N.R. (2013) Sensing Beha-vior of Atomically Thin-Layered MoS2 Transistors. ACS Nano, 7, 4879-4891.
https://doi.org/10.1021/nn400026u
[23] Perkins, F.K., Friedman, A.L., Cobas, E., Campbell, P.M., Jernigan, G.G. and Jonker, B.T. (2013) Chemical Vapor Sensing with Monolayer MoS2. Nano Letters, 13,
668-673. https://doi.org/10.1021/nl3043079
[24] Lee, K., Gatensby, R., Mcevoy, N., Hallam, T. and Duesberg, G.S. (2013) High-Performance Sensors Based on Molybdenum Disulfide Thin Films. Advanced Materials, 25, 6699-6702. https://doi.org/10.1002/adma.201303230
[25] Zhang, S.-L., Choi, H.-H., Yue, H.-Y. and Yang, W.-C. (2014) Controlled Exfolia-tion of Molybdenum Disulfide for Developing Thin Film Humidity Sensor. Current Applied Physics, 14, 264-268. https://doi.org/10.1016/j.cap.2013.11.031
[26] Liu, K., Feng, J., Kis, A. and Radenovic, A. (2014) Atomically Thin Molybdenum Disulfide Nanopores with High Sensitivity for DNA Translocation. ACS Nano, 8, 2504-2511. https://doi.org/10.1021/nn406102h
[27] Li, H., Yin, Z., He, Q., Li, H., Huang, X., Lu, G., Fam, D.W.H., Tok, A.L.Y., Zhang, Q. and Zhang, H. (2012) Fabrication of Single- and Multilayer MoS2 Film-Based
Filed-Effect Transistors for Sensing NO at Room Temperature. Small, 8, 63-67.
https://doi.org/10.1002/smll.201101016
[28] Eda, G., Yamaguchi, H., Voiry, D., Fujita, T., Chen, M. and Chhowalla, M. (2011) Photoluminescence from Chemically Exfoliated MoS2. Nano Letters, 11, 5111-5116.
https://doi.org/10.1021/nl201874w
[29] Zhang, L., Liu, T., Li, T., et al. (2017) A Study on Monolayer MoS2, Doping at the S
Site via the First Principle Calculations. Physica E: Low-Dimensional Systems and Nanostructures, 94, 47-52. https://doi.org/10.1016/j.physa.2017.04.173
[30] Silveira, J.V., Batista, J.A., Saraiva, G.D., et al. (2010) Temperature Dependent Be-havior of Single Walled MoO3, Nanotubes: A Raman Spectroscopy Study.
Vibra-tional Spectroscopy, 54, 179-183. https://doi.org/10.1016/j.vibspec.2010.10.002
[31] Wang, W., Zeng, X., Wu, S., et al. (2017) Effect of Mo Concentration on Shape and Size of Monolayer MoS2 Crystals by Chemical Vapor Deposition. Journal of Physics