1
Comparing Probabilistic and Statistical Methods in Landslide
1
Susceptibility Modeling in Rwanda /Centre-Eastern Africa
2
3
Jean Baptiste Nsengiyumva
a,b,c,d, Geping Luo
a,b,*
, Amobichukwu Chukwudi Amanambu
a,b,e,
4
Richard Mind’je
a,b,d, Gabriel Habiyaremye
d,h, Fide le Karamage
b,f, Friday Uchenna Ochege
a,b,g5
and Christophe Mupenzi
d6
a.
State Key Laboratory of Desert and Oasis Ecology, Xinjiang Institute of Ecology and Geography, Chinese
7
Academy of Sciences, No. 818, South Beijing Road, Urumqi 830011, China.
8
b.
University of Chinese Academy of Sciences, Beijing 100049, China.
9
c.
M inistry in Charge of Emergency M anagement, P.O. Box 4386, Kigali, Rwanda.
10
d.
Faculty of Environmental Studies, University of Lay Adventists of Kigali (UNILAK), P.O.Box 6392, Kigali,
11
Rwanda.
12
e.
Water, Engineering and Development Centre, School of Civil and Building Engineering, Loughborough
13
University, Leicestershire, UK.
14
f.
Key Laboratory of Watershed Geographic Sciences, Nanjing Institute of Geography and Limnology, Chinese
15
Academy of Sciences, Nanjing 210008, China.
16
g.
Department of Geography and Environmental M anagement, University of Port Harcourt, PM B 5323 Choba,
17
East-West, Port Harcourt, Nigeria.
18
h.
Lancaster University, Lancaster Environment Centre, Faculty of Science and Technology. LA 1 4 YQ, UK.
19
20
* Corresponding Author:
[email protected]; Tel.: 7823127; Fax:
+86-991-21
7885320
22
23
24
Abstract:
25
Application of suitable methods to generate landslide susceptibility maps (LSM ) can play a key role in
26
risk management. Rwanda, located in centre-eastern Africa e xperiences frequent and intense landslides
27
which cause substantial impacts. The ma in a im of the current study was to effectively generate
28
susceptibility maps through exploring and comparing diffe rent statistical and probabilistic models.
29
These included weights of evidence (Wo E), logistic regression (LR), f requency ratio (FR) and
30
statistical inde x (SI). Experiments were conducted in Rwanda as a study area. Past landslide locations
31
have been identified through extensive fie ld surveys and historical records . Totally, 692 landslide
32
points were collected and prepared to produce the inventory map. This was applied to calibrate and
33
validate the models. Fourteen maps of conditioning factors were produced for landslide susceptibility
34
modelling, name ly: elevation, slope degree, topographic wetness index (TWI), curvature, aspect,
35
distance from rivers and streams, d istance to ma in roads, lithology, soil te xture, soil depth, topographic
36
factor (LS), land use/land cover (LULC), precip itation and norma lized diffe rence vegetation index
37
(NDVI). Thus, the produced susceptibility maps were va lidated using the receiver operating
38
characteristic curves (ROC/AUC). The findings fro m this study disclosed that prediction rates were
39
92.7% , 86.9%, 81.2% and 79.5% respectively for Wo E, FR, LR and SI models. The WoE achieved the
40
highest AUC value (92.7%) wh ile the SI produced a lowest AUC value (79.5%). Addit ionally, 20.42%
41
of Rwanda (5,048.07km2) was modelled as high susceptible to landslides with the western part the
42
highly susceptible comparing to other parts of the country. Conclusively, the compa rison of produced
43
maps revealed that all applied mode ls are pro mising approaches for landslide susceptibility studying in
44
Rwanda. The results of the present study may be useful for landslide risk mit igation in the study area
45
and in other areas with simila r terrain and geomorphological conditions. More studies should be
46
performed to inc lude other important conditioning factors that exacerbate increases in susc eptibility
47
especially anthropogenic factors.
48
49
Ke ywor ds: Landslide; Susceptibility; Rwanda; Frequency ratio; Statistical inde x; Logistic regression.
50
___________________________________________________________________________________
51
52
1.
Introduction
53
Landslide is one the of most devastating natural disasters that causes loss of human lives, properties
54
and infrastructure in many parts around the globe (Chen et al. 2018a; Chen et al. 2018b). Many
2
countries in the world a re susceptible to landslide ha zards with unacceptable levels of natural
56
underlying risks (Pisano et al. 2017). Their fatalities are recurrently recorded, especially in
57
mountainous prone zones. The impacts of landslide hazards are therefore still nu merous in most parts
58
of the globe (Pisano et al. 2017; Zêze re et al. 2017; Chen et al. 2018a). According to the international
59
disaster analysis in 2015, it was disclosed that 346 d isaster cases were reported, with 22,773 deaths and
60
98.6 million people affected. Additionally, 66.5 billion USD were lost due to these natural disasters
61
with five countries being the most hit, including China; USA; India; Philippines and Indonesia (Pisano
62
et al. 2017; Ahmed and De wan 2017). Furthermore, 174 landslides cases were recorded worldwide in
63
2014, leading to ma jor devastating effects and impacts. Previous studies reported that landslides are
64
categorized as the third cause of the most global serious and deadly natural disasters (Ramani et a l.
65
2011; Ahmed and Dewan 2017; Nsengiyumva et al. 2018).
66
The Management of landslide risks requires a lot concerted efforts, but landslide susceptibility
67
mapping beco mes the most significant tool to min imize their impacts through resilience building (EA C
68
2012; Nsengiyumva 2012; Zschau and Küppers 2013; Chen et al. 2018a). There fore, susceptibility
69
maps reveal the spatial distribution of probabilities of landslide occurrences in a given area based on
70
certain conditioning factors. Generally, landslide susceptibility is controlled by a nu mber of pa ra meters
71
including conditioning factors, types of landslides, fa ilure mechanis ms, and coverage of affected a reas,
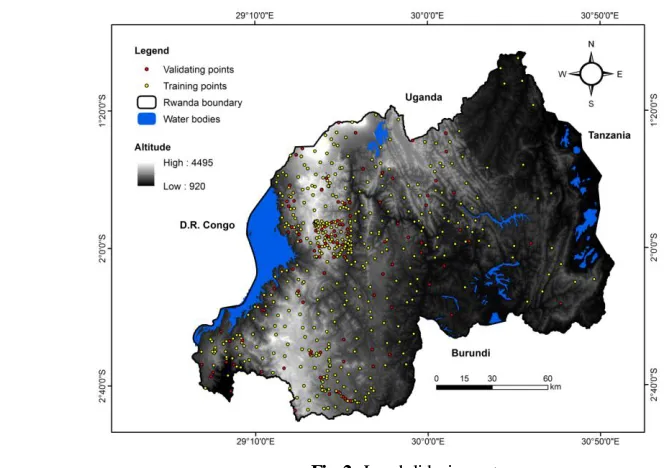
72
frequency and intensity among others.
73
In the previous decades, the study of landslide susceptibility attracted the attention of many
74
researchers worldwide, but still, landslides constitute a major threat to human life . The literature on
75
landslide studies avails various susceptibility mapping techniques and approaches, ranging fro m very
76
simp le to mo re co mple x. These include inventory based (Nichol and Wong 2005; Van Westen et al.
77
2006; Yalc in et a l. 2011; Akgun 2012; Van Den Eec khaut et a l. 2005), data-driven methods composed
78
by bivariate and mult ivariate statistics (weights of evidence, frequency ration, logistic regression,
79
cluster analysis, artificia l neural networks (Dahal et a l. 2008b; Neuhäuser and Terhorst 2007; Dahal et
80
al. 2008a; Moha mmady et a l. 2012; Ayale w and Ya magishi 2005; Yilma z 2009; Ra man i et a l. 2011;
81
Sujatha et al. 2012; Zê zere et a l. 2017; Chen et al. 2018a); and the knowledge-driven methods for
82
landslide susceptibility studies (fuzzy logic, ana lytical h iera rchy process, spatial mult i-c riteria
83
evaluation, mu lti-class overlay and Boolean logic) (Gorsevski et al. 2006; Pradhan 2010b, 2010a;
84
Neaupane and Piantanakulchai 2006). Additionally, so me landslide susceptibility studies use
85
probabilistic methods composed of both parameter uncertainty and tempora l p rediction (Re fice and
86
Capolongo 2002; Zhou et al. 2003; Mazzanti et a l. 2015; Brenning 2005; Zê zere et a l. 2004) and
87
physically-based and deterministic methods (Cervi et a l. 2010; Gö kceoglu and Aksoy 1996; Godt et a l.
88
2008; Ya lc in 2008; Bau m et a l. 2008; Terlien et al. 1995; Kuriakose et al. 2009; McDougall and Hungr
89
2005; Wu et al. 2009; Turner et al. 2015; Schilirò et al. 2016; Sinarta et al. 2017).
90
Fro m the above literature rev iew, it was revealed that several data driven models e xist such as
91
statistical and probabilistic methods but have never been compared for landslide susceptibility
92
modeling in Africa. In addition, the application of data driven methods may play a big role in
93
accurately predicting landslide susceptibility fo r African prone regions (Nsengiyumva et al. 2018;
94
Monsieurs et al. 2018; Bizimana and Sön me z 2015; MIDIMAR 2015a). Thus, it is therefore important
95
to compare probabilistic and statistical methods to achieve suitable and accurate outputs for landslide
96
susceptibility mapping (Youssef et al. 2016). The current study aims therefore to ma ke a co mparative
97
analysis of four models, including statistical inde x (SI), frequency ratio (FR), logistical regression (LR),
98
and weights-of-evidence (WoE) models to predict landslide susceptibility in Rwanda.
99
100
2.
Ge neral description of the study area
101
The present study covered the entire territory of Rwanda, a country located in the great lakes
102
region of the central-east Africa (Nahayo et al. 2018; Kara mage et a l. 2016). Rwanda is a land-locked
103
country occupying a total surface area of 26,338 square kilo metres with a total po pulation of 12,
104
601,482 in 2018. Rwanda is one of the most densely-populated countries in Africa (Nsengiyumva et
105
al. 2018).
106
Rwanda e xtends over the eastern shoulder of the Kivu -Tanganyika rift in Africa (Fig.1). Despite
107
its pro ximity to the equator, Rwanda enjoys a tropica l c limate moderated by hilly topography varying
108
between 920 and 4495 m above sea level, stretching fro m east to west (Ndayisaba et al. 2016). The
109
country has four climatic seasons in which long rainy (late February to late May) and short rainy
110
seasons (end September to early Dece mber) a lternate with long dry (June –September) and short dry
111
3
season B and season A, respectively. The annual precipitation ranges between 700 and 1400 mm,
113
with the eastern part having short rains.
114
115
116
117
118
119
120
121
122
123
124
125
Fig.1. Location map of the study area
126
Rwanda is characterized by a strongly heterogeneous landscape, with very d iffe rent terra in
127
features over the 30 districts. High mountains up to 4km above sea level are found in the west and
128
northwest parts of the country, including the Congo Nile Ridge, the Volcanic Range and the Buberuka
129
highlands. The plains are found in the eastern part of the country, including the eastern savanna, the
130
eastern plateau, the central plateau and the Bugesera-Mayaga. A large wet land reservation in the
131
Akagera Nat ional Pa rk is found in the northeast of the country (Ndayisaba et al. 2016). Based on the
132
statistical analysis fro m the geospatial lithologica l and soil types, it is confirmed that Rwandan soils are
133
ma inly co mposed by fragile soils (a physico -chemica l a lteration of basic schistose, quartzite, granite,
134
basic igneous rock, and volcanic rocks). The underlying geolo gy consists of the Acrisols (47.5%),
135
Ferra lsols (17.5%), Regosols (13%), Andosols (5%), Histosols (4.1%) and Ca mb isols (3.2%), Ve rtisols
136
(1.8%), Greysols (1.5%), Nitosols (0.4%), and water bodies cover the rema ining 6%. Agriculture
137
which occupies 58.31% of the land re mains entire ly ra infed and is ma inly pract iced on hill slopes.
138
(Karamage et al. 2016).
139
Due to its topographic nature with steep slopes, Rwanda is prone to natural hazards including
140
mass wasting especially landslides which a re the most recurrent ha zards in the sub -region. Landslide
141
hazards are very co mmon natural phenomena in the centre-eastern Africa. The geo morphology in the
142
study area presents, therefore, a favorable uniqueness to explore and test the four methods (FR, SI,
143
WoE and LR). Moreover, as confirmed by the Ministry of Disaster Management and Refugees , 124
144
people were killed by landslides, 141 injured and 897 houses destroyed in the study area from 201 1 to
145
May 2017 (Nsengiyumva et al. 2018). In addition, fro m January to October 2018, natural disasters
146
including landslides killed 234 people, injured 218, destroyed 15,264 houses and 9,412 hectares of
147
crops, 31 roads and 52 bridges damaged, 86 classrooms completely destroyed as we ll as 797 livestock
148
killed (MIDIMAR 2018). Therefore, this testifies how much the study area is a landslide prone zone.
149
3.
Data and methods
150
3.1.
The landslide inventory
151
For any susceptibility mapping activ ity, it is essential to detect and understand the relationship
152
between conditioning factors and past landslide distribut ion (Nsengiyumva et a l. 2018; Youssef et al.
153
2016; Chen et al. 2018a; Chen et al. 2018b). Th is informat ion is therefore obtained fro m the past
154
landslide locations inventory and landslides are mostly represented as p oints (Reg mi et al. 2014).
155
Thus, for this study, the inventory map was generated with 692 past landslide points. These points
156
represent areas in Rwanda where landslides had occurred in the past. These landslides locations were
157
4
2017. Intervie ws were conducted with local residents in the ha zard-prone zones. Historical records
159
and disaster reports from the MIDIMA R and district offices were also consulted. Additionally, some
160
landslide data were extracted from existing provincial topographic maps (1: 500,000-scale).
161
Therefore, the inventory map and the maps of the landslide predictors were produced at the
162
national scale of 1:1,000,000 since the current study covered the entire Rwanda. Thus, 75% o f
163
collected past landslides (519 points) we re used to simulate the mode ls while 25% (equiva lent to 173
164
landslide points) were used for validation (Fig. 2). To e xtract and split the total points into training
165
and testing points, authors used the geostatistical analyst e xtension of ArcMap 10.3, through the
166
subset feature that divides the original dataset into two parts: one was used for modeling the spatial
167
structure and to produce a surface, while the other was used for co mparing and va lidating the output
168
surface by sub-setting the data (Youssef et al. 2016; Zêzere et al. 2017).
169
170
171
172
173
174
175
176
177
178
179
180
181
Fig.2. Landslide inventory map
182
3.2.
The landslide conditioning factors
183
To carry out the landslide susceptibility mapping, various datasets have to be used including landslide
184
conditioning factors and inventory maps (Chen et al. 2017b). For the current study, fourteen landslide
185
conditioning factors have been used including precipitat ion, distance fro m ma in roads, desistance fro m
186
rivers/streams, slope, elevation, NDVI, lithology, TWI, topographic factor (LS), soil depth, curvature,
187
LULC, soil te xture and aspect. The selection of these factors based on available datasets, historical
188
records, fie ldworks in the study area, study area context as well as objectives of the study. Therefore,
189
conditioning factors play a critical role in modeling landslide susceptibility.
190
To investigate landslide susceptibility in the study area, the digita l e levation model (DEM) of 30m
191
resolution was used. This was obtained from the Global Digita l Elevation Model-GDEM (Maes et al.
192
2018). The DEM was used to derive six landslide causal factors including slope, aspect, elevation,
193
curvature, topographic factor and topographic wetness index (Fig.3). The spatial e xtension toolset of
194
ArcMap 10.3 was used to deduce these factors.
195
Furthermore, land cover/land use (LULC) is a lso considered as an important landslide conditioning
196
factor (Ra mani et al. 2011). The latest LULC map of 2017 (Fig. 3k), has been produced from Landsat-8
197
OLI images. These images were obtained fro m the Un ited States Geo logical Survey (USGS) through
198
global visualization tool (Maes et al. 2018; USGS). Th is was accomplished by using the ma ximu m
199
like lihood classification technique in Envi 5.3 software. Subsequent to radiometric corrections,
200
masking of cloud shadows and gaps filling; the LULC map has been classified. The c lassification was
201
done following the previous classification by the reg ional centre for mapping of resources for
202
development (RCM RD) for East-Africa region.Similarly, the current study applied type one of USGS
[image:4.596.80.413.226.460.2]5
classification techniques (Nsengiyumva et a l. 2018; Ka ra mage et al. 2017). Thus, the study area was
204
then classified into six c lasses (forestland: 15.38%, grassland: 14.31%, c ropland: 58.31%, built up land:
205
1.86%, wetland: 4.02% and water bodies: 6.12%). In addition, for the accuracy assessment, authors
206
randomly co mposed sixty points for each land use/land cover type, which were overlaid to a classified
207
image in Google Earth to ma ke verification. An overall satisfactory accuracy of 92 % was therefore
208
achieved.
209
Existing geologica l maps with good scale (1:100,000) were obtained fro m Rwanda Natura l
210
Resources. These datasets were used to deduce lithology factor for landslide susceptibility modeling in
211
Rwanda. Additionally, soil datasets were obtained fro m the M inistry of Agriculture and Rwanda
212
agriculture board. They were orig inated fro m e xtensive soils mapp ing and surveys nationwide in 1995.
213
Soil is a very important conditioning factor of landslide susceptibility (Dou et al. 2018; Chen et al.
214
2017a; Coppola 2006). Therefore, three factors we re generated na mely soil depth, lithology and texture
215
(Fig. 3i, 3j and 3l).
216
For the precipitation factor, this study applied monthly mean ra infa ll for 21 years (1996-2017).
217
Authors utilized ra infall datasets fro m climate haza rds group infra Red precip itation with s tation data
218
(CHIRPS) as described by Funk. et al., (2017). These datasets were coupled with rain fall data fro m
219
meteorologica l stations in the study area as provided by Rwanda Meteorological Agency. In most
220
landslide studies, rainfall is considered as a severe trigger of landslide haza rds especially in
221
mountainous areas (NASA; Schilirò et al. 2016).
222
The topographic factor represents the product of slope length (L) and steepness (S) factor. LS
223
illustrates the influence of topography on landslide/soil erosion occurrence (Ra man i et al. 2011) and
224
has a high value if the length and slope of terrain are high. If the length and steepness of slope are
225
more , the landslide will be high and vice versa. Thus, it can be estimated through field measure ments
226
or can be derived fro m dig ital e levation model (DEM). LS equation has been developed to generate the
227
topographic factor map based on DEM (Moore and Wilson 1992). For this study, LS factor was
228
estimated fro m the Shuttle Radar Topography Mission (STRM), 30m resolution provide d by the
229
National Aeronautics and Space Administration (NASA). The spatial analyst e xtension tool of ArcMap
230
10.3 was used to derive the L and S values of each pixe l using equation 1 for L factor developed by
231
Desmet and Govers (1996) and equation 2 for S factor applying McCool et al. (1987) method.
232
233
Li.j =
Ai.j−in+D2m +1−Ai.j−inm +1 Dm +2∙x
i.j
m∙ 22.13 m (1)
234
m = β
1 + β (1a)
235
β =3 Sin θ Sin θ/0.08960.8+0.56 (1b)
236
Si.j=
10.8sinθi.j+ 0.03, tan θi.j < 9%
16.8sinθi.j− 0.50, tan θi.j ≥ 9% (2)
237
238
where Li.j = slope length factor for the grid cell with coordinates (i.j); D = the grid-cell size (m); Xi.j =
239
(Sin ai.j + Cos ai.j); ai.j = aspect direction for the grid-ce ll with coordinates (i.j); Ai.j−in is the flow
240
accumulat ion or contributing area at the inlet (m2) of a grid-ce ll with coordinates (i.j). Besides, the
241
slope-length exponent m is re lated to the ratio β of rill e rosion (caused by flow) to interrill erosion
242
(princ ipally caused by raindrop impact); β is the ratio of rill to interrill e rosion for conditions when the
243
soil is moderately susceptible to both rill and interrill erosion ; θ is the slope angle in degrees
244
(Karamage et al. 2017).
245
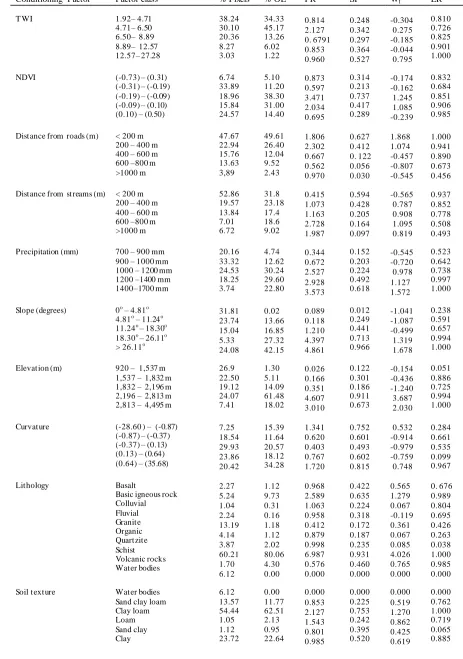
For the present study, NVDI has been considered as one of the landslide conditioning factors . The
246
6
NDVI was e xtracted fro m Landsat-8 for 2016 with 30m resolution. This was achieved using spatial
248
analyst tool in ArcMap 10.3 based on equation 3 as follows:
249
250
NDVI = Band 5 − Band 4
Band 5 + Band 4 (3)
251
For landslide susceptibility modeling, topographic wetness inde x (TWI) is considered as a significant
252
conditioning factor (Ah med and Dewan 2017; Youssef et al. 2016). For the present study, TWI
253
computation was achieved by using the flow accumulat ion obtained from the flo w direction . All these
254
were g iven by DEM using hydrological tool fro m spatial analyst tools of ArcMap 10.3. Equation 4 was
255
therefore applied to calculate TWI and it ranges from 1.92 to 27.28 (Fig. 2h).
256
257
TWI = ln As
tan α (4)
258
Where As is the catchment a rea and α is the slope gradient (in degrees). The curvature can be
259
influenced by the slope erosion processes as convergence or divergence of water during downhill flow
260
and it constitutes one of the landslide conditioning factors.
261
262
Fie ldworks in the study area revealed that some landslide cases were caused by proximity to
263
roads and streams/rivers. Therefore, authors decided to consider both distance from roads and distance
264
fro m rivers as landslides conditioning factors in Rwanda. Road datasets were freely obtained fro m the
265
Rwanda Transport Develop ment Agency while geospatial datasets on rivers and strea ms networks,
266
were obtained fro m the Ministry of Lands and Forests . The distances were calculated using Euclidian
267
distance of spatial analyst tool of ArcMap10.3. All the 14 conditioning factors were applied to models
268
(FR, SI, WoE and LR) in generating landslide susceptibility maps for Rwanda.
269
270
271
272
273
274
275
276
277
278
279
280
281
282
283
284
7
286
287
288
289
290
291
292
293
294
295
296
297
298
299
300
301
302
303
304
305
306
307
308
309
310
311
312
Fig.3. Landslide conditioning factors: (a) Distance from roads; (b) Distance from streams/rivers; (c) Precipitation;
313
(d) Slope; (e) Elevation; (f) Curvature; (g) Normalized Difference Vegetation Index (NDVI); (h) Topographic
314
Wetness Index (TWI); (i) Lithology; (j) Soil texture; (k) Land use/cover 2017 (LULC); ( l) Soil depth; ( m)
315
Aspect; (n) Topographic factor (LS).
316
8
For this study, each of the conditioning factors was correlated with the landslide occurrences.
318
3.3.
Landslide susceptibility modeling
319
3.3.1.
Study design
320
Fig.4
presents the study framework for landslide susceptibility assessment in the study area.
321
322
323
Fig.4. Flowchart of the study
324
In susceptibility modeling, the accuracy and quality of produced maps largely depend on input
325
datasets, study area comple xity and applied methodologies as well. Th is section presents a detailed
326
description of applied methods . Thus, the authors e xplored and co mpared p robabilistic and statistical
327
models to predict landslide susceptibility in the study area.
328
329
3.3.2.
The Statistical Index Model (SI)
330
In the literature re lated to landslide hazards and disasters, statistical inde x mode l has widely been
331
applied by d iffe rent researchers (Bui et al. 2011; Ahmed and De wan 2017). SI is a statistical, b ivariate
332
approach to study susceptibility in landslide prone zones . The weighting value is obtained by dividing
333
the density of landslides in the class by the landslide in the entire map. Therefore, the SI can be
334
modeled using equation 5.
335
WSI = ln Exy
E = ln Lxy
LT
Pxy
PL
(5)
336
where, WSI, is the statistical inde x weight assigned to a given landslide class x of the y factor; Exy,
337
stands for the density of landslides in x class of y factor; E, entire density of landslide in the total map;
338
Lxy, a mount of landslides in a given x class of y the parameter; Pxy, amount of pixe ls of the x class for
339
the y factor; LT, total landslide in the whole map; PL, nu mber of p ixe ls of the whole mapped area. The
340
landslide susceptibility map through SI is therefore obtained with equation 6.
341
342
LSMSI = WSI 1+ WSI 2+ WSI 3+ ⋯ WSIn (6)
343
344
whereby LSMSI represents the landslide susceptibility for statistical index mode l, and WSI = the
345
assigned weight of a given landslide conditioning factor or a range of conditioning factors.
346
347
3.3.3.
Frequency Ratio Model (FR)
348
Generally, present and past landslide occurrences are assumed to be useful in pred icting future
349
9
circu mstances (Pradhan and Lee 2010; Reg mi et a l. 2014). Based on this principle, it is required to
351
determine the relationship between conditioning factors and past landslides while modeling
352
susceptibility. As confirmed by previous studies (Reg mi et a l. 2014), frequency ratio model discloses
353
the correlation between observed landslides and conditioning factors.
354
Landslide pred iction is performed through the relat ion between the causal factor and landslides event
355
inventory (Reg mi et a l. 2014). The estimat ion of the FR is given by the ratio of area of the landslide
356
points to area that has not been affected by landslide. This is then computed for each class factors.
357
For the production of susceptibility inde x (LSI), the values for each factor’s frequency ratio are to be
358
summed up using appropriate equations. As previously indicated by studies (Mohammady et al. 2012),
359
FR ratios are calculated and summed for each considered factor to generate hazard susceptibility.
360
Therefore, the higher the value, the greater the probability of the landslide to occur and inversely, the
361
lower values represent the lower occurrences of landslide ha zards. Frequency ratio is mode led using
362
equation 7 below:
363
364
LSI = Fr 1+ Fr 2 + Fr 3 + ⋯ Frn (7)
365
Hence, as described by Regmi et al.(2014), landslide susceptibility by FR, is yielded by equation 8:
366
367
LSI = FRn
1 (8)
368
fro m equation 8, LSI = landslide susceptibility inde x and Fr stands for each factor’s rat ing. As
369
previously stated by Ahmed (2011), the frequency ratio method is expressed in more details with
370
equations 9 and 10.
371
372
FRij= FrXij
FrYij (9)
373
fro m equation 9, FRij is the landslide occurrence proportion for the i c lass of the j factor; FrXij denotes
374
the frequency of observed landslides within c lass i of factor j; a lso FrYij represents the frequency of the
375
percentage for non-observed landslides in class i of factor j. For this equation, it is deduced that a
376
greater ratio shows stronger correlat ion between occurrence and the factor’s class and the lower ratio
377
shows less relationship between occurrences and considered factors (Regmi et al. 2014).
378
From this assumption, landslide susceptibility is determined by applying equation 10.
379
LSIFR = Wij n
j=1
(10)
380
where LSIFR is the landslide s usceptibility inde x by frequency ration model; Wij= the we ight for class i
381
within j conditioning factor and n = the total number of all considered conditioning factors.
382
3.3.4.
Weights
of Evidence Model (WoE)383
The mapping of susceptibility has attracted attention of more researchers through application of
384
statistical approaches (Mohammady et a l. 2012; Reg mi et a l. 2014). WOE is one of the fundamental
385
models in studying landslide susceptibility worldwide. The WoE application to susceptibility modeling
386
has also been widely recognized in the literature related to landslide studies (Reg mi et a l. 2014). The
387
performance of WoE model requires the calcu lation of positive and negative parameters (W+ and W-
388
Weights).
389
Generally, past landslide datasets are the key factors for we ights determination (Monsieurs et al.
390
2018). It has also been confirmed that landslide susceptibility modeling has to rely on the theory that
391
landslide events can be caused by similar conditions to those which triggered past landslides (Regmi
392
et al. 2014). Thus, the WoE is modelled using equations 11 and 12.
393
W+= ln P XY
P Xy (11)
10
W−= ln Px y
P yx (12)
395
whereby P = the probability of occurrence, ln = the natural logarith m. Besides, X and x represent the
396
presence and absence of landslide conditioning factors, whilst Y and y stand for the p resence and
397
absence of landslides events. When modeling landslide susceptibility, WoE computes each landslide
398
conditioning factor’s weight x accord ing to the existence or absence of landslide haza rds in the study
399
area as per equations 13 and 14.
400
W+= ln NLP xy TNLP y NSP xy TNSP y
(13)
401
where W+ is the positive we ighting for the x c lass of the y factor, NLPxy equals to the total points of
402
landslide hazards within x c lass of y factor, TNLPy is the sum of landslide points for each y factor,
403
NSPxy represents number of pixels in stable condition for x c lass of y factor. Thus, TNSPy = the
404
number of total pixels of y factor in stable condition. The negative weight is therefore determined using
405
equation 14.
406
w−= ln NLP ny TNLP y NSP ny TNSP y
(14)
407
fro m equation 14, W- is the negative weight to be assigned when the class x of the factor y is absent ,
408
NLPny is the a mount of landslide points in further n c lasses of y factor, TNLPy equals total points of
409
factor y, NSPny denotes stable pixe ls in e xtra n classes of y factor, TNSPy is the total amount of pixe ls
410
with stability of y factor. Furthermore, positive weighting (W+) determines the presence of the
411
landslide conditioning factors in place and this testifies the strong link between the presence of hazard
412
events and conditioning factors. In case of the negative weighting (W-), it is confirmed the
non-413
existence of conditioning factors which shows lack of correlation (Regmi et al. 2014).
414
Accordingly, the weight of contrast (Wf) is obtained from the difference between W+ and W-.
415
The LSI is therefore obtained fro m we ight of contrast (Youssef et a l. 2016). Thus, the Wf is calcu lated
416
using equation 15.
417
Wf = W+− W− (15
418
LSIWofE = Wfxy
n
j =1
(16)
419
where Wf = the we ight of contrast, LSI =landslide susceptibility inde x, WofE = we ights of evidence,
420
Wfxy = final weight of x class in y conditioning factor, and n the total number of conditioning factors.
421
422
3.3.5.
Logistic
regression (LR) model423
Logistic Regression which is a mult ivariate model has extensively been applied in many different
424
studies related to landslide susceptibility studies (Chen et al. 2017a; Chen et al. 2017b). Th is model
425
produces results basing on one or more independent variables, and the result is measured through
426
dichotomous variables such as true and false or 0 and 1. In this study, the application of logistic
427
regression in susceptibility modeling, served to define the linkage between the presence and lack of
428
landslide events with related conditioning factors. LR generates coefficients that predict landslides in a
429
given area. Logistic regression model was therefore applied using equations 17 and 18.
430
z = a0 +a1x1 + a2x2+ a3x3 + ⋯ anxn (17)
431
where z = the linear co mbination of the dependent variables representing the absence (0) or the
432
presence (1) of landslide, and variable values fro m -∞ to +∞, a0 stands for the intercept of the model, a1,
433
a2, ….an represent the coefficients of logistic regression model, and x1, x2, …xn denote the conditioning
434
11
436
In a simplified way, logistic regression model is expressed using equation 18:
437
P = ln P 1−P =
1
1+e−z (18)
438
with P = the probability (varying between 0 and 1) of a landslide to occur, and z = the linear model for
439
considered variables. At this stage, with logistic regression model, the landslide susceptibility index is
440
calculated using equation 19.
441
SI = exp z / (1 + exp z (19)
442
where, SI = the landslide susceptibility index.
443
444
3.4.
Model performance validation
445
Studies on landslide have ascertained that susceptibility map s are not useful unless they are validated
446
(Chen et al. 2018b). For susceptibility mapping, it is required to assess the valid ity of the models
447
applied since they have no scientific significance without validation (Chen et a l. 2018a) Appropriate
448
methods are therefore essential to validate landslide susceptibility maps generated using models. To
449
validate the LSMs in this study, authors applied the rece iver operating characteristic (ROC). Thus,
450
ROC p resents the percentages of true positive rating of past landslides aga inst the false positive rating
451
percentage of susceptibility inde x in a cu mu lative decreasing order. This he lps to get the ROC curve of
452
the rate of success (Ahmed and Dewan 2017; Chen et al. 2018a). The a rea under the ROC curve (AUC)
453
is useful to detect which of the applied models is the best predictor of landslide susceptibility for the
454
area under investigation.
455
In case of the poor prediction or non-imp rovement, the AUC va lue becomes less or equal to 0.5 while
456
the best and ideal susceptibility modeling is obtained when AUC value is higher or equal to 0.7
457
(Devkota et a l. 2013; Ahmed and Dewan 2017). The literature confirms that AUROC curves are one of
458
the most common tools used to validate and co mpare landslide susceptibility modeling methods
459
(Zêzere et al. 2017). The AUC was therefore calculated using equation 20 (Chen et al. 2018b).
460
461
AUC = TP + TN P +N (20)
462
where P is the total nu mber of landslides and N is the total number of non-landslides; TP = the true
463
positive and TN =the true negative.
464
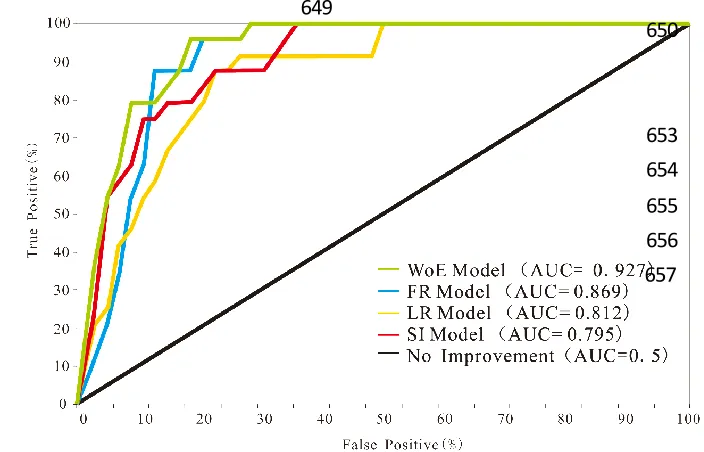
4.
Results and discussion
465
4.1.
Relationship between conditioning factors and landslide locations
466
The spatial re lationship between each landslide conditioning factor and landslide locations was
467
calculated using the four models FR, SI, Wf and LR, and the results are shown in Tables 1 and 2.
468
As shown in Table 1, each factor has been assigned different values depending on the previously
469
observed landslides including percentage nu mber o f p ixe ls with the applied models. It was observed
470
that some factor c lasses gained high values for a ll the four models . These factors include distance fro m
471
roads (classes of <200m and 200-400m), precip itation ( classes of 1400-1700mm and 1200-1400mm),
472
slope degrees (>26.11o and 18.30-26.11o), e levation (2,196-2,813m and 2,813-4,495m), lithology
473
(schist, basic igneous rock and volcanic rocks), soil texture (c lay loa m, clay), land use/land cover
474
(cropland, built up and forestland), soil depth (<0.5m and 0.5-1.0m), slope aspect (south and
475
southwest), curvature (0.64-35.68), and LS (2.50-7.81m ad 1.77-2.50m). In contrast, the models
476
presented some diffe rences for class factor relat ionship between TWI, NDVI and distance fro m strea ms .
477
12
Table 1 Spatial relationship between each landslide conditioning factor and landslide locations using FR and
481
WoE, SI and LR
482
483
Conditioning Factor Factor class % Pixels % OL FR SI Wf LR
T WI 1.92– 4.71
4.71– 6.50 6.50– 8.89 8.89– 12.57 12.57– 27.28 38.24 30.10 20.36 8.27 3.03 34.33 45.17 13.26 6.02 1.22 0.814 2.127 0. 6791 0.853 0.960 0.248 0.342 0.297 0.364 0.527 -0.304 0.275 -0.185 -0.044 0.795 0.810 0.726 0.825 0.901 1.000
NDVI (-0.73) – (0.31)
(-0.31) – (-0.19) (-0.19) – (-0.09) (-0.09) – (0.10) (0.10) – (0.50)
6.74 33.89 18.96 15.84 24.57 5.10 11.20 38.30 31.00 14.40 0.873 0.597 3.471 2.034 0.695 0.314 0.213 0.737 0.417 0.289 -0.174 -0.162 1.245 1.085 -0.239 0.832 0.684 0.851 0.906 0.985
Distance from roads (m) < 200 m 200 – 400 m 400 – 600 m 600 –800 m >1000 m 47.67 22.94 15.76 13.63 3,89 49.61 26.40 12.04 9.52 2.43 1.806 2.302 0.667 0.562 0.970 0.627 0.412 0. 122 0.056 0.030 1.868 1.074 -0.457 -0.807 -0.545 1.000 0.941 0.890 0.673 0.456
Distance from streams (m) < 200 m 200 – 400 m 400 – 600 m 600 –800 m >1000 m 52.86 19.57 13.84 7.01 6.72 31.8 23.18 17.4 18.6 9.02 0.415 1.073 1.163 2.728 1.987 0.594 0.428 0.205 0.164 0.097 -0.565 0.787 0.908 1.095 0.819 0.937 0.852 0.778 0.508 0.493
Precipitation (mm) 700 – 900 mm 900 – 1000 mm 1000 – 1200 mm 1200 –1400 mm 1400–1700 mm 20.16 33.32 24.53 18.25 3.74 4.74 12.62 30.24 29.60 22.80 0.344 0.672 2.527 2.928 3.573 0.152 0.203 0.224 0.492 0.618 -0.545 -0.720 0.978 1.127 1.572 0.523 0.642 0.738 0.997 1.000
Slope (degrees) 0o – 4.81o 4.81o – 11.24o 11.24o – 18.30o 18.30o – 26.11o > 26.11o
31.81 23.74 15.04 5.33 24.08 0.02 13.66 16.85 27.32 42.15 0.089 0.118 1.210 4.397 4.861 0.012 0.249 0.441 0.713 0.966 -1.041 -1.087 -0.499 1.319 1.678 0.238 0.591 0.657 0.994 1.000
Elevation (m) 920 – 1,537 m 1,537 – 1,832 m 1,832 – 2,196 m 2,196 – 2,813 m 2,813 – 4,495 m
26.9 22.50 19.12 24.07 7.41 1.30 5.11 14.09 61.48 18.02 0.026 0.166 0.351 4.607 3.010 0.122 0.301 0.186 0.911 0.673 -0.154 -0.436 -1.240 3.687 2.030 0.051 0.886 0.725 0.994 1.000
Curvature (-28.60 ) – (-0.87) (-0.87) – (-0.37) (-0.37) – (0.13) (0.13) – (0.64) (0.64) – (35.68)
7.25 18.54 29.93 23.86 20.42 15.39 11.64 20.57 18.12 34.28 1.341 0.620 0.403 0.767 1.720 0.752 0.601 0.493 0.602 0.815 0.532 -0.914 -0.979 -0.759 0.748 0.284 0.661 0.535 0.099 0.967
Lithology Basalt
Basic igneous rock Colluvial Fluvial Granite Organic Quartzite Schist Volcanic rocks Water bodies 2.27 5.24 1.04 2.24 13.19 4.14 3.87 60.21 1.70 6.12 1.12 9.73 0.31 0.16 1.18 1.12 2.02 80.06 4.30 0.00 0.968 2.589 1.063 0.958 0.412 0.879 0.998 6.987 0.576 0.000 0.422 0.635 0.224 0.318 0.172 0.187 0.235 0.931 0.460 0.000 0.565 1.279 0.067 -0.119 0.361 0.067 0.085 4.026 0.765 0.000 0. 676 0.989 0.804 0.695 0.426 0.263 0.038 1.000 0.985 0.000
Soil texture Water bodies
[image:12.596.75.538.112.771.2]13
With FR, SI, WoE and LR models, the results of spatial re lationship between conditioning
484
factors and landslide locations revealed that for the d istance to roads, the classes of <200m has the
485
highest values 1.806, 0.627, 1.868 and 1.000 fo r a ll mode ls respectively. It was observed during
486
fie ldworks that many landslides in Rwanda occur alongside the roads due to slope stability
487
modification. Results of the study also disclosed that spatial re lationship values for precipitation
488
classes have indications with increasing of precip itation in the study area. Precipitation c lass of
1400-489
1700mm has the highest value for FR, SI, WoE and LR models ( 3.573, 0.618, 1.572 and 1.000
490
respectively) followed by the class of 1200-1400 mm (2.928, 0.492,1.127 and 0.997 values for FR, SI,
491
WoE and LR respectively). This is entirely the western part of the country where most landslides
492
events are frequently recorded. Additionally, the relat ionship between slope degrees and landslide
493
probability showed that the class of > 26.11o has the highest FR, SI, WoE and LR va lues (4.861,
494
0.966, 1.678 and 1.000 respectively), whereas the class of 0o-4.81o gives the lowest values (0.089,
495
0.012, -1.041 and 0.238 respectively for FR, SI, WoE and LR models). Basically, as the slope
496
increases, the shear stress increases, and gentle slope angles are norma lly e xpected to have lower
497
weights values since they are associated with lower shear stresses (Pourghasemi et al. 2012).
498
Regarding elevation factor, the c lasses of 2,196-2,813m and 2,813-4,495m have the highest
499
values (4.607; 0.911; 3.687; 0.994 and 3.010; 0.673; 2.030 and 1.000 respectively for FR, SI, Wo E
500
and LR models) while the c lass of 920-1,537m has the lowest values for all the models. The results of
501
this study revealed that the spatial re lationship values increased with increasing elevation. Besides,
502
the study showed that areas with schist lithology are highly sus ceptible to landslides in Rwanda. A lso,
503
clay loa m soils and cropland areas were found highly susceptible in the study area. Soil depth class of
504
0.5-1.0m was proven to have the highest spatial relat ionship with 5.227; 0.997; 2.604 and 1.00 va lues
505
for FR, SI, WoE and LR models respectively.
506
The overall analysis of conditioning factors revealed that 10 factors are more influential than
507
others. They include slope degree, precipitation, e levation, curvature, aspect, soil depth, land use /land
508
cover, soil texture, distance to roads and topographic factors (Table 2).
509
510
511
512
513
514
515
516
Land use/ cover Built-up land Crop land Forest land Grass land Wet land Water bodies 1.86 58.30 15.38 14.31 4.05 6.12 4.12 78.29 12.35 5.14 0.10 0.00 1.234 6.7921 0.786 0.582 0.187 0.000 0.341 0.913 0.567 0.231 0.167 0.000 0.658 3.271 0.590 -0.157 -0.008 0.000 0.983 1.000 0.754 0.432 0.029 0.000
Soil depth (m) < 0.5 m 0.5 –1.0 m > 1.0 m
17.63 29.48 52.89 10.20 82.22 7.58 0.708 5.227 0.014 0.383 0.997 0.261 0.423 2.604 -0.979 0.897 1.000 0.553
Slope aspect Flat (-1)
North (0 – 22.5) Northeast (22.5 – 67.5) East (67.5 – 112.5) Southeast (112.5–157.5) South (157.5 – 202.5) Southwest (202.5 – 247.5) West (247.5 – 292.5) Northwest (292.5 – 337.5)
9.42 4.14 10.47 8.57 11.26 10.14 13.21 16.95 15.84 0.00 11.83 8.16 7.91 8.43 19.08 26.91 8.03 9.65 0.000 1.032 0.899 0.967 0.726 1.859 1.934 0.764 0.896 0.122 0.233 0.229 0.175 0.224 0.294 0.332 0.193 0.242 0.000 0.028 -0.220 -0.689 -0.465 0.658 0.780 -0.574 -0.098 0.000 0.640 0.829 0.516 0.758 0.994 0.960 0.536 0.958
LS (m) 0.03 –0.49
14
Table 2
Statistical coefficients generated by R Software517
518
Predicting factors Estimate Std. Error z value Pr (>|z|)
519
(Intercept) -2.664e-08 6.479e+02 0 1
520
Elevation 4.344e-16 2.431e-04 0 1
521
TWI -4.147e-14 2.544e-02 0 1
522
Soiltexture 2.081e-14 4.092e-02 0 1
523
Slope 7.173e-08 1.744e+03 0 1
524
Rainfall 8.725e-06 4.740e-04 0 1
525
NDVI -2.740e-14 5.781e-01 0 1
526
LS 7.559e-07 1.838e+04 0 1
527
Lithology -8.647e-15 3.695e-02 0 1
528
LANDUSE 1.556e-13 8.501e-02 0 1
529
Distance_river -3.287e-17 3.104e-05 0 1
530
Distance_road 1.570e-17 1.995e-05 0 1
531
Curvature 1.031e-13 1.237e-01 0 1
532
Aspect 1.770e-16 6.344e-04 0 1
533
Soil depth 2.1851e-11 4.032e-02 0 1
534
4.2.
Generation of landslide susceptibility maps
535
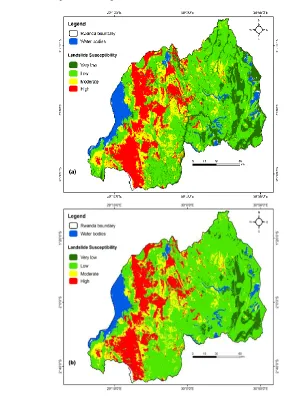
The present study explo red and co mpared d iffe rent probabilistic and statistical methods to produce
536
landslide susceptibility maps for the area under investigation (Fig. 5). Applicat ion of FR, SI, LR and
537
WoE helped authors to generate LSM for Rwanda using 14 factors. Four landslide susceptibility maps
538
were therefore produced (Fig. 5).
539
15
576
577
578
579
580
581
582
583
584
585
586
587
588
589
590
591
592
593
594
595
596
597
598
599
600
601
602
603
604
605
606
607
608
609
610
611
612
613
[image:15.596.72.401.71.529.2]
614
Fig.5. Landslide susceptibility maps using: (a) FR model; ( b) LR model; ( c) SI model and (d) WoE model.
615
616
The FR, SI, Wo E and LR models were constructed using the training points and layers of landslide
617
conditioning factors (Fig. 2). Previous studies recommended that the combination of more factors play
618
a big role in generating accurate landslide susceptibility maps (Pille r 2016; Nsengiyumva et al. 2018;
619
Pradhan and Lee 2010). Thus, the calculated landslide susceptibility inde x (LSI) va lues for the entire
620
study area using FR, SI, WoE and LR models were between 0.00 and 1.00. Finally, all landslide
621
susceptibility inde x va lues of the area under investigation were div ided into four classes using the equal
622
interval method to generate landslide susceptibility maps of Rwanda. Areas we re respectively classified
623
as high susceptibility (0.75−1), moderate susceptibility (0.50−0.75, low susceptibility (0.25−0.50) and
624
very low susceptibility (0.00−0.25), (Fig.5.)
625
The produced susceptibility maps (Fig.5) re flect what was observed from field-work in the study area
626
(Fig. 2). Moreover, the disaster losses database available in the Ministry in Charge of Emergency
627
Management in Rwanda, and interviews with local e xperts in the study area, disclose that landslide
628
susceptibility is spatially dispersed across the study area. However, steep slope zones become the
629
highly susceptible. Additionally, higher prec ipitations were found the ma jor triggers of landslide events
630
in the study area. Landslide ha zards affect people, livestock, crops, fa mily houses and other diffe rent
631
important infrastructure including roads and bridges . Additionally, fie ldwork confirmed that ma jority
632
of past landslide events occurred in crop land, built-up land and forest land (Fig. 3k and Fig.2) and this
633
can also undermine the agriculture sector.
634
16
4.3.Validation and comparison of models
637
In landslide susceptibility modeling, most scientists agree that appropriate methods need to be
638
applied to evaluate the performance of landslide susceptibility models. However, there is no clear
639
agreement concerning which methods are the best or must be used given regional variab ility. For this
640
study, the results of the four landslide susceptibility models were validated using validation datasets
641
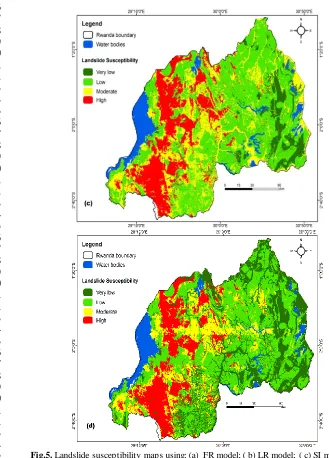
obtained during fie ldwork a stated earlier . Additionally, we used the AUC to evaluate the model results
642
(Fig.6). Results confirmed that a ll four mode ls have good susceptibility prediction capacity. There fore,
643
the AUC values of 92.7%, 86.9%, 81.2% and 79.5% respectively for WoE, FR, LR and SI models
644
showed reasonable prediction fo r a ll the mode ls . Ho wever, the results indicated that the WoE model
645
performed the best (92.7%) in mapping landslide susceptibility in the study area whereas SI model
646
showed the smallest AUC value (79.5%).The weight of evidence proved the best model capable of
647
combining expert knowledge with field datasets in susceptibility modeling.
648
649
650
651
652
653
654
655
656
657
658
[image:16.596.86.438.226.452.2]659
660
661
662
Fig.6. Prediction rates with AUC for model performance.
663
664
The landslide susceptibility maps are co mmonly considered as a funda mental stage in managing
665
landslide risks (Chen et al. 2018a). They play a big role in identify ing critica l risk zones; inform
666
relocation of fa milies fro m hazard - prone zones as well as development of landslide mit igation
667
infrastructure. This stage of risk manage ment cycle can a lso help to identify significant triggers of
668
landslides. Significantly, it was noted fro m results of this study that most of past landslide events
669
occurred between March and May of the prev ious years and rain has been confirmed a ma jor trigger of
670
landslides.
671
Analytically, landslide risks and exposure in the study area was found to be very high. Majority
672
of the affected population are ru ral people liv ing in e xt re me poverty. Most of them live in poorly
673
constructed houses that are located in highly vulnerable landslide zones, and are unable to cope at the
674
event of any landslide disaster. Districts were pred icted to be high ly prone to landslide ha zards
675
including Ngorore ro, Nyabihu, Ka rongi, Nya masheke, Ga kenke , Muhanga, Rusizi, Nya magabe,
676
Rulindo, Musanze and Nyaruguru (Fig. 1, 2 and 5). Rwanda is tenderly refe rred to as a country of
677
thousand hills (Das et al. 2010), as depicted by its topography with volcanoes and dominant
Congo-678
Nile ridge hills. All prone Districts are located within high elevation zones. Inversely, nine districts
679
were found stable to landslide hazards name ly Kirehe, Rwa magana, Ngo ma, Kayonza, Gatsibo,
680
Nyagatare, Bugesera, Gisagara and Nyanza. These have mostly been c lassified as low and very low
681
susceptible (Fig. 1 and 5). The population growth increases the pressure on land even in steep slope
682
areas through informa l and illegal settlements by the local co mmun ity me mbers . Inappropriate land use
683
has continued exacerbate the impacts of landslide ha zards in the study area. This situation requires
684
landslide resilience building from national to local level.
685
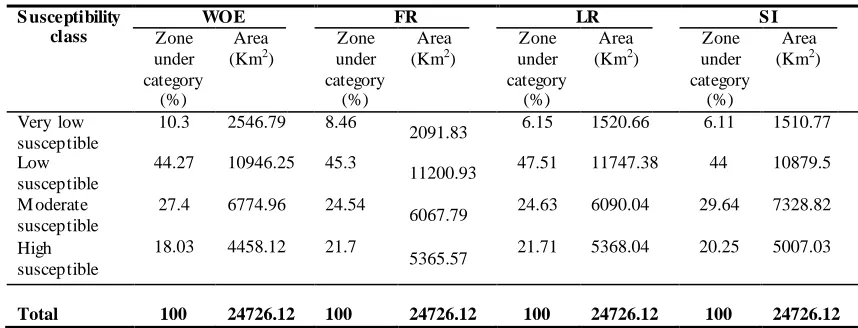
The spatial distribution of different landslide susceptibility class es is illustrated in Table 3. The
686
17
areas covered under different susceptibility categories (high, moderate, low and very lo w) were
688
calculated using ArcMap 10.3, as shown in Table 3. In the case of WoE model, it can be observed that
689
the high susceptibility c lass accounts for 18.03% of the study area. The moderate, low and very low
690
susceptibility classes account for 27.4%, 44.27% and 10.3% of the study area, respectively. For the
691
landslide susceptibility map generated by the FR model, 8.46% of the study area belongs to very low
692
susceptibility class. The low susceptibility class covers 45.3% of the study area and the moderate
693
susceptibility class accounts for 24.54% of the study area, while the high susceptibil ity class accounts
694
for 21.7% of the study area. Regarding landslide susceptibility map produced using LR model, the
695
very low and low susceptibility classes account 6.16% and 47.52 of the study area, respectively.
696
24.63% of the study area falls into the moderate susceptibility class and 21.71% fa lls into the high
697
susceptibility class. This comparat ive study confirms that the four models (FR, SI, Wo E and LR) are
698
promising approaches to map landslide in Rwanda since they all produced reasonable susceptibility
699
maps. Additionally based on the landslide susceptibility map produced using SI model, it is revealed
700
that 6.11% of the study area falls into the very lo w susceptibility c lass, while 44% o f the study area
701
falls into the low susceptibility class. Both moderate and high susceptibility classes account for 29.64%
702
[image:17.596.82.511.312.476.2]and 20.25% of the study area, respectively.
703
Table 3
Landslide susceptible areas for WOE, FR, LR and SI models704
705
In general, it is shown that 20.42% (5,048.07 km2) of Rwanda falls into high susceptibility class
706
whereas 7.75% (1,917.5 km2) falls into very low susceptibility class (Table 3).
707
The Results of the current susceptibility modeling study is in conformity with the previous studies in
708
the study area (Nsengiyumva 2012; Nsengiyumva et al. 2018; Piller 2016; Nduway e zu 2017;
709
MIDIMA R 2012, 2015b). This agree ment confirms the western and the northern parts as landslide
710
prone zones while the eastern part is the least susceptible. Objectives of the study have been reached
711
since the applied models (FR, SI, Wo E and LR) produced reasonable susceptibility maps , and
712
AUC/ ROC was used to assess the model performance. The landslide susceptibility mapping should be
713
followed by detailed risk assessment and vulnerability analysis to improve risk reduction practices .
714
Disaster risk is norma lly a p roduct of hazard, risk, vulnerability and e xposure. Further quantitative
715
studies should therefore be conducted to address landslide manage ment uncertainties. However, the
716
findings fro m the current study confirmed that the co mparison of FR, SI, LR and WoE is a very
717
reasonable and a pro mising approach to generate landslide susceptibility maps within p rone areas of
718
Rwanda as well as the centre-eastern-Africa region. Landslide control practices such as contouring,
719
strip-cropping and terracing should be adopted especially for areas falling into moderate and high
720
susceptibility classes to lessen the impacts.
721
5.
Conclusion
722
Landslide ha zards are very recurrent in the study area. In the current study, WOE, FR, LR, and SI
723
models were applied to map landslide susceptibility in Rwanda. The four models have never been
724
compared before in the entire literature re lated to landslide susceptibility studies for the Africa region.
725
S usceptibility class
WOE FR LR S I
Zone under category
(%)
Area (Km2)
Zone under category
(%)
Area (Km2)
Zone under category
(%)
Area (Km2)
Zone under category
(%)
Area (Km2)
Very low susceptible
10.3 2546.79 8.46
2091.83 6.15 1520.66 6.11 1510.77
Low susceptible
44.27 10946.25 45.3
11200.93 47.51 11747.38 44 10879.5
M oderate susceptible
27.4 6774.96 24.54
6067.79 24.63 6090.04 29.64 7328.82
High susceptible
18.03 4458.12 21.7
5365.57 21.71 5368.04 20.25 5007.03