Accepted Manuscript
Physically short crack propagation in metals during high cycle fatigue
C. Santus, D. Taylor
PII: S0142-1123(09)00092-9 DOI: 10.1016/j.ijfatigue.2009.03.002
Reference: JIJF 2248
To appear in: International Journal of Fatigue
Received Date: 25 February 2008 Revised Date: 28 January 2009 Accepted Date: 2 March 2009
Please cite this article as: Santus, C., Taylor, D., Physically short crack propagation in metals during high cycle fatigue, International Journal of Fatigue (2009), doi: 10.1016/j.ijfatigue.2009.03.002
ACCEPTED MANUSCRIPT
1 2 3 4 5 6 7 8 9 10 11 12 13 14 15 16 17 18 19 20 21 22 23 24 25 26 27 28 29 30 31 32 33 34 35 36 37 38 39 40 41 42 43 44 45 46 47 48 49 50 51 52 53 54 55 56 57 58 59 60 61 62 63
Physically short crack propagation in metals during
high cycle fatigue
C. Santus
a,∗
D. Taylor
baDipartimento di Ingegneria Meccanica, Nucleare e della Produzione. Universit`a di Pisa.
Via Diotisalvi n◦2 - 56126 - Pisa. Italy.
bDepartment of Mechanical Engineering, Trinity College, Dublin 2, Ireland.
Abstract
In metals, during high cycle fatigue on plain specimens, almost the entire fatigue life is spent as short crack initiation and propagation. The fatigue short crack life can be schemat-ically divided into two subsequent phases: microstructurally short crack and physschemat-ically short crack. Recently, Chapetti proposed a physically short crack threshold and propaga-tion driving force model [1]. In his model the physically short crack behavior is obtained from the long crack propagation, just introducing the reduced threshold due to unsaturated closure. In the present paper the physically short crack propagation is similarly modeled by means of a driving force equation, but independent from the long crack propagation. In this way, a better description of the short crack behavior is provided, however short crack propagation data is required. Physically short crack propagation model parameters were obtained, by fitting experimental data drawn from the literature, for two Aluminum alloys and a Titanium alloy at two different heat treatment conditions and load ratios.
By calculating the physically short crack plus long crack propagation, and assuming mi-crostructurally short crack as part of the initiation stage, a purer information about crack initiation can be drawn from the S−N curves, and it is shown in the paper for the investi-gated materials. A precise crack initiation size and the number of cycles just for initiation are then provided. This information is useful to accurately predict fatigue life for blunt notched and for thick components, where the propagation is much higher than in the small plain specimen.
A validation of the model was obtained by predicting the fatigue life of a notched speci-men. An accurate prediction was obtained both when the initiation was much smaller than propagation and when almost the entire fatigue life was initiation.
Key words: Microstructurally short cracks. Physically short cracks. Fatigue crack initiation. Fatigue crack propagation. Notched component fatigue life.
∗ Corresponding author:
Phone: +39 050 836607, Fax: +39 050 836665.
ACCEPTED MANUSCRIPT
1 2 3 4 5 6 7 8 9 10 11 12 13 14 15 16 17 18 19 20 21 22 23 24 25 26 27 28 29 30 31 32 33 34 35 36 37 38 39 40 41 42 43 44 45 46 47 48 49 50 51 52 53 54 55 56 57 58 59 60 61 62 63
Notation
σa Stress amplitude.
∆σ Stress range (=2σa).
∆K Stress intensity factor range (full range, even for negative load ratio).
∆Kth Long crack threshold stress intensity factor range.
∆σth Threshold stress range.
da/dN Crack propagation rate.
a Semielliptical surface crack depth.
w Semielliptical surface crack width.
σ0 plain specimen fatigue strength amplitude at high number of cycles to failure.
∆σ0 plain specimen fatigue strength range (=2σ0).
Nf Number of cycles to failure.
N0 Number of cycles to failure at which the fatigue strengthσ0is based on.
Ni Number of cycles for initiation.
Np Number of cycles for propagation.
CP Paris law constant.
mP Paris law exponent.
σ′
f, b Basquin’s law parameters.
β Shape factor for crack stress intensity factor.
Ds Specimen diameter.
∆Kth,a Crack size dependent physically short crack threshold.
∆Kth,d Smallest physically short crack threshold.
∆KC Stress intensity range threshold closure term.
k Exponential factor in Chapetti model.
a0 Critical distance.
aD Critical defect size.
d Material microstructurally strongest barrier or largest non damaging crack.
d2 Smallest long crack.
rn Notch radius
Dn Notch depth
dn Notch inner diameter.
ACCEPTED MANUSCRIPT
1 2 3 4 5 6 7 8 9 10 11 12 13 14 15 16 17 18 19 20 21 22 23 24 25 26 27 28 29 30 31 32 33 34 35 36 37 38 39 40 41 42 43 44 45 46 47 48 49 50 51 52 53 54 55 56 57 58 59 60 61 62 63
1 Introduction
The fatigue strength of metal components without any pre–existing crack or de-tectable defect has to be explained by the short crack mechanisms. After the nucle-ation the fatigue crack is obviously short. While a crack is short the non propagating
condition∆K<∆Kthcould be satisfied even for very high cyclic stress∆σ, much
larger than actual values that cause fatigue failure. In other words the Linear Elastic Fracture Mechanics (LEFM) fundamental parameter K loses its meaning while the crack is shorter than some characteristic material length.
There is more than one type of short crack [2]. A fatigue crack that nucleates from an approximately flat surface (such as a plain specimen, or a blunt notch), in ambi-ent air and room temperature, grows through three phases [3]:
• Microstructurally Short Crack (MSC), where the continuum mechanics itself is
questionable, since the crack size is similar to the grain size, or less;
• Physically Short Crack (PSC), where crack growth is increased due to reduced
crack closure and other effects;
• Long Crack (LC), where Paris law holds, up to the final fracture.
Large scientific literature exists on mechanistic descriptions of MSC and PSC. Main contributions were given by Miller [4,5], Miller and O’Donnell [6], Riemel-moser and Pippan [7], and finally a very clear description of the plasticity induced crack closure mechanisms are available in Pippan and Riemelmoser [8] (crack plas-tic wake closure mechanism under plane strain conditions) and Pippan et al. [9] (asymmetric crack plastic wake as the reason for roughness induced closure). The lack of fully developed closure is broadly accepted to be the main mechanistic rea-son for the physically short crack’s faster growth. Recently, Chapetti proposed a PSC propagation model based on the reduced closure concept [1]. In the present paper the physically short crack propagation Chapetti model is followed, however some modifications / improvements are provided and motivated.
Usually, the crack initiation is assumed as the existence of a detectable crack size that depends on the inspection technique. Obviously, this definition has a valid experimental meaning. In his recent paper Chapetti suggested as initiation /
prop-agation boundary the transition from MSC to PSC. Indeed, the ∆K is basically
meaningless for the fatigue crack in the MSC regime, while it already has a mech-anistic soundness in the PSC regime. In the present paper the MSC to PSC crack
initiation is quantitatively obtained from the S−N curves by subtracting the PSC
and LC propagation portions from the entire fatigue life, and the PSC propagation is obtained integrating the proposed equation.
2 Materials
Materials investigated in the present paper, are aluminum alloys: 2024–T3, 7075–
ACCEPTED MANUSCRIPT
1 2 3 4 5 6 7 8 9 10 11 12 13 14 15 16 17 18 19 20 21 22 23 24 25 26 27 28 29 30 31 32 33 34 35 36 37 38 39 40 41 42 43 44 45 46 47 48 49 50 51 52 53 54 55 56 57 58 59 60 61 62 63
and Seeger materials data book under cyclic loading [10], for load ratio R=−1.
For the Titanium alloy the load ratio R=0.1 is also considered. Data for Ti–6Al–
4V alloy loaded at R=0.1 are from Peters et al. [11].
The main material properties are reported in Tab.1.
SY SUTS R σf′ b N0 σ0
Alloy MPa MPa MPa MPa Ref.
2024–T3 378 486 -1 1 044 -0.114 5×10⁶ 166 [10]
7075–T6 512 572 -1 776 -0.095 5×10⁶ 168 [10]
Ti–6Al–4V 1 188 1 236 -1 1 797 -0.085 5×10⁶ 457 [10]
Ti–6Al–4V 915 965 0.1 429 -0.0325 108 230 [11]
Table 1
Static and fatigue material properties.
where: SYis the static Yield strength, SUTS is the Ultimate Tensile Strength,σf′and b are the two constants defining Basquin’s relationship: σa =σf′(2Nf)b, andσ0 is
the fatigue strength amplitude (i.e. half the full range:∆σ0=2σ0) based on a
rea-sonably high number of cycles to failure N0(higher than 106).
Even though compositions of Ti–6Al–4V reported in Ref.[10] and Ref.[11] are very similar, the mechanical properties of the two Ti alloys were quite different (higher strength for the alloy reported in Ref.[10]). Apparently, different heat treatments induced different microstructures and then different mechanical properties. To dis-tinguish the two different Titanium alloys in the present paper, the load ratio R
is mentioned since alloy from Ref.[10] was loaded at R=−1, while alloy from
Ref.[11] was loaded at R=0.1.
3 Long crack propagation models
Long crack propagation rate can be described accurately by the Paris law, where
two material parameters are required only: CP and mP, to be deduced by fitting
to experimental data. Several generalizations of the Paris law are available in the literature, that can be easily found in textbooks, e.g. Ref.[12]. Most of them are derived to allow for a unique set of material parameters to take into account load ratio R sensitivity. Other generalizations of the Paris law are designed to model the smooth transition at the near threshold condition. Several models are available, see for example the advanced textbook by Ellyin [13]. However, the two most popular ones assume as an effective parameter the difference between the stress intensity factor range and the threshold stress intensity factor range, but in a slightly different way:
• Zheng and Hirt [14]
da
dN =CP(∆K−∆Kth)
ACCEPTED MANUSCRIPT
1 2 3 4 5 6 7 8 9 10 11 12 13 14 15 16 17 18 19 20 21 22 23 24 25 26 27 28 29 30 31 32 33 34 35 36 37 38 39 40 41 42 43 44 45 46 47 48 49 50 51 52 53 54 55 56 57 58 59 60 61 62 63• Klesnil and Luk´aˇs [15]
da
dN =CP(∆K
mP
−∆KthmP) (2)
Mechanistic explanations for Eqs.1 and 2 may be questionable and discussion about their validity can be found in many papers, however, even the Paris law finds its main justification just in its fitting experimental data success. Eqs.1 and 2 agree in terms of asymptotes: they give rise to the same threshold and the same crack
prop-agation rate at high driving force ∆K≫∆Kth but in the intermediate region they
differ significantly, since CP(∆K−∆Kth)mP<CP(∆KmP−∆KthmP).
100 101 102
10−12 10−10 10−8 10−6
Delta KI [ MPa m1/2 ], (log) Crack growth − long crack, R=−1
Klesnil−Lukas Holper 2003
[ MPa m ], (log) K ' d /d [ m /c y cl e ], (l o g ) a N
100 101 102 10−10
10−8 10−6
Delta KI [ MPa m1/2 ], (log) Klesnil−Lukas Bu 1986 Wu 1998
[ MPa m ], (log)
K ' d /d [ m /c y cl e ], (l o g ) a N (a) (b)
100 101 102
10−14 10−12 10−10 10−8
Delta KI [ MPa m1/2 ], (log) Klesnil−Lukas Stanzl−Tschegg 2006
[ MPa m ], (log) K ' d /d [ m /c y cl e ], (l o g ) a N
100 101 102
10−12 10−10 10−8 10−6
Delta KI [ MPa m1/2 ], (log) Crack growth − long crack, R=0.1
Klesnil−Lukas Boyce 2001
[image:6.612.102.499.165.574.2][ MPa m ], (log) K ' d /d [ m /c y cl e ], (l o g ) a N (c) (d)
Fig. 1. Long crack near threshold propagation: (a) 2024–T3 (R=−1), experimental data from Ref.[16]. (b) 7075–T6 (R=−1), Ref.[17,18]. (c) Ti–6Al–4V (R=−1), Ref.[19]. (d) Ti–6Al–4V (R=0.1), Ref.[20]. Predictions using the Klesnil–Luk´aˇs approach (Eq.2).
Eq.2 was fitted to the data, drawn from the literature, for the materials mentioned above, and it is reported in Fig.1 where it is clearly effective in describing the near threshold propagation (Eq.2 is termed as “Klesnil–Lukas” in Fig.1). Eq.2 parame-ters, obtained by fitting materials data just shown, are reported in Tab.2.
ACCEPTED MANUSCRIPT
1 2 3 4 5 6 7 8 9 10 11 12 13 14 15 16 17 18 19 20 21 22 23 24 25 26 27 28 29 30 31 32 33 34 35 36 37 38 39 40 41 42 43 44 45 46 47 48 49 50 51 52 53 54 55 56 57 58 59 60 61 62 63
R ∆Kth mP CP
Alloy MPa√m (MPam/√cyclem)mP Ref.
2024–T3 -1 4.8 3.20 1.5×10⁻¹¹ [16]
7075–T6 -1 4.0 3.14 1.1×10⁻¹¹ [17,18]
Ti–6Al–4V -1 5.6 4.26 6.7×10⁻¹⁴ [19]
[image:7.612.204.427.296.430.2]Ti–6Al–4V 0.1 4.2 4.05 9.0×10⁻¹³ [20]
Table 2
Eq.2 fitting parameters for considered materials.
4 Short crack threshold models
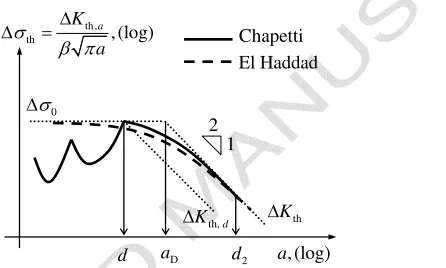
The most effective tool to describe the short crack threshold is the Kitagawa–Takahashi (KT) diagram, Fig.2.
, (log)
a
th,
th , (log)
a
K
a
V
E S ' '
th
K
'
0
V '
th, d
K
'
d aD
Chapetti El Haddad
1 2
2
d
Fig. 2. Kitagawa–Takahashi diagram. El Haddad [21] and Chapetti [1] short to long crack threshold models.
There are some models available to describe the shape of the KT diagram. Among them the El Haddad model is both accurate and simple. Indeed, it just requires the
two asymptotes:∆σ0and∆Kthas material parameters.
∆Kth,a=∆Kth r
a a+aD
(3)
where aDis the size of the critical defect:
aD= a0
β2 (4)
and a0is the material critical distance:
a0=
1
π ∆
Kth
∆σ0
2
(5)
Actually, the El Haddad model was originally formulated using a0in Eqs.3 instead
of the critical defect size aD [21]. The introduction of aD is explained by
ACCEPTED MANUSCRIPT
1 2 3 4 5 6 7 8 9 10 11 12 13 14 15 16 17 18 19 20 21 22 23 24 25 26 27 28 29 30 31 32 33 34 35 36 37 38 39 40 41 42 43 44 45 46 47 48 49 50 51 52 53 54 55 56 57 58 59 60 61 62 63
Then the long crack asymptote in the KT diagram is shifted, due to the shape fac-torβ, which in turn gives the intersection, with the fatigue strength∆σ0, in aD. A
deeper discussion about the meaning of aD, and its relation to a0, can be referred to
Refs.[22,23].
During early fatigue crack propagation, at a plain specimen surface (and at a blunt notch surface too) crack dimensions are much smaller than surface curvature radius and specimen (or component) thickness. It is a reasonable assumption to consider a crack that nucleates from a flat surface in a semi-infinite body, with the crack orien-tation perpendicular to the uniaxial normal stress direction. In such a situation the
typical observed surface crack aspect ratio is a/w=0.8, where a is the crack depth
and w is the crack surface half-length. During fatigue crack initial propagation, its aspect ratio can be either higher or lower than 0.8. In particular for sub–surface initiations the crack aspect ratio can temporarily be larger than unity [24], anyway
an average aspect ratio a/w=0.8 can be assumed. For this basic crack geometry
configuration, the stress intensity factor K at the deepest point of the crack is [25]:
∆K=β∆σ√πa, β =0.746 (6)
When the fatigue crack grows and its dimensions become comparable with any
sig-nificant specimen (or component) geometry dimension, the shape factorβ changes.
Despite this geometry shape factor sensitivity, the surface crack starting from a semi-infinite body flat surface is here considered as reference geometry, then shape
factorβ =0.746 is also assumed in Eq.4.
The El Haddad model does not explain the different regimes of short cracks, be-cause it is a unique equation that covers the entire scale of crack size. On the contrary, the Chapetti model [1] distinguishes between microstructurally and phys-ically short crack regimes. It considers a transition size d (material dependent only) which is the strongest microstructural barrier of the material. Any crack smaller than d is microstructurally short and its behavior can not be modeled by means of the stress intensity factor. Any crack larger than d is initially physically short, until its closure is saturated as it grows. However, the stress intensity factor can be already used to predict PSC crack propagation rates, provided that the Paris law is modified to consider the reduced closure and the resulting higher propagation rate. Chapetti proposed the following model, to define threshold stress intensity factor range for PSC:
∆Kth,a=∆Kth,d+∆KC (7)
where∆Kth,d is the smallest physically short crack threshold (a=d):
∆Kth,d=β∆σ0
√
πd (8)
and∆KCis the closure term:
ACCEPTED MANUSCRIPT
1 2 3 4 5 6 7 8 9 10 11 12 13 14 15 16 17 18 19 20 21 22 23 24 25 26 27 28 29 30 31 32 33 34 35 36 37 38 39 40 41 42 43 44 45 46 47 48 49 50 51 52 53 54 55 56 57 58 59 60 61 62 63
in which k is a material constant and a good estimate of it is given by the equation:
k= 1
4d
∆Kth,d ∆Kth−∆Kth,d
(10)
Obviously∆KCis null as a=d, and∆Kth,atends to the LC threshold∆Kthwhen a
is much larger than d.
As already pointed out, the Chapetti model (Eqs.7–10) is not valid in the MSC re-gion; the resistance curve shown in the MSC region in Fig.2 is qualitative only. The Chapetti model requires a material length d, that should be obtained by means of microstructure observation. The microstructure length d has been observed to be either the average grain size or any microstructural barrier spacing, depending on the material microstructure. For example, d is the ferrite grain size in ferrite-perlite
microstructure, or laths spacing in bainite-mertensite steels [1,26], or primary α
phase size in bimodal Ti–6Al–4V alloy [27].
The concept of largest non propagating crack was initially introduced several years ago by Taylor and Knott [28]. If a crack shorter than the largest non propagating crack is present in a plain specimen it does not reduce the fatigue strength. Clearly from Fig.2 it follows that the largest non propagating crack is coincident to the Chapetti model’s strongest barrier d.
Comparing the Chapetti and El Haddad threshold models, it follows that the El Haddad one is not able to predict the existence of any non damaging crack, though the two lines remain very close.
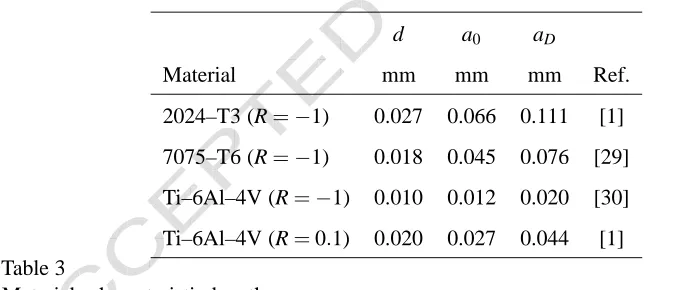
Values of material lengths d, a0, aD, drawn from the literature, are reported in Tab.3.
d a0 aD
Material mm mm mm Ref.
2024–T3 (R=−1) 0.027 0.066 0.111 [1]
7075–T6 (R=−1) 0.018 0.045 0.076 [29]
Ti–6Al–4V (R=−1) 0.010 0.012 0.020 [30]
[image:9.612.91.429.418.563.2]Ti–6Al–4V (R=0.1) 0.020 0.027 0.044 [1]
Table 3
Materials characteristic lengths.
The material length d is the grain size for the two aluminum alloys, while d is the
primary α phase size for the bimodal Ti alloy. Critical distance a0 was obtained
from data reported in Tabs.1,2, and Eq.5. To obtain aD, from critical distance a0,
the shape factorβ =0.746 was assumed, as discussed above.
Materials KT diagrams are reported in Fig.3, for the considered materials, and the characteristic lengths are marked on the graphs.
A further material length, shown on the KT diagrams, is the smallest long crack
d2. Both the two models here compared show a smooth transition at d2 and then
they meet the LC threshold. For all the materials investigated in the paper a good
estimate of d2is: d2=10 d, also in agreement with Taylor and Knott paper [28]. In
ACCEPTED MANUSCRIPT
1 2 3 4 5 6 7 8 9 10 11 12 13 14 15 16 17 18 19 20 21 22 23 24 25 26 27 28 29 30 31 32 33 34 35 36 37 38 39 40 41 42 43 44 45 46 47 48 49 50 51 52 53 54 55 56 57 58 59 60 61 62 6310−6 10−5 10−4 10−3 10−2 101
102 103
defect size [ m ], (log) Chapetti
El Haddad d1 aD d2
[ m ], (log)
a th [ M P a ], (l o g ) V ' d D a 2 d
10−6 10−5 10−4 10−3 10−2 101
102 103
defect size [ m ], (log) Chapetti
El Haddad d1 aD d2
[ m ], (log)
a th [ M P a ], (l o g ) V ' d D a 2 d (a) (b)
10−6 10−5 10−4 10−3 10−2 101
102 103
defect size [ m ], (log) Chapetti
El Haddad d1 aD d2
[ m ], (log)
a th [ M P a ], (l o g ) V ' d D a 2 d
10−6 10−5 10−4 10−3 10−2 101
102 103
defect size [ m ], (log) Chapetti
El Haddad d1 aD d2
[ m ], (log)
[image:10.612.106.509.63.402.2]a th [ M P a ], (l o g ) V ' d D a 2 d (c) (d)
Fig. 3. Kitagawa–Takahashi diagrams and characteristic lengths: d, aD, d2, for
investi-gated materials: (a) 2024–T3, R=−1. (b) 7075–T6, R=−1. (c) Ti–6Al–4V, R=−1. (d) Ti–6Al–4V, R=0.1.
The Chapetti model threshold stress range is slightly higher the El Haddad
predic-tion. This is particularly true for both the two Ti alloys where aDis around twice d.
The condition of aDnot much larger than d has to be interpreted as little stress
in-tensity factor closure component∆KC. For the Ti alloy loaded at load ratio R=0.1
the small amount of closure can be addressed to the high load ratio itself, while
for the Ti alloy loaded at load ratio R=−1, the reason can be the very high yield
strength SY, Tab.1, which in turn reduces the wake mechanisms responsible for the
crack closure [8,9]. For the two aluminum alloys the critical defect size aD ranges
from 3 to 4 times the material microstructural size d.
5 Physically short crack propagation model
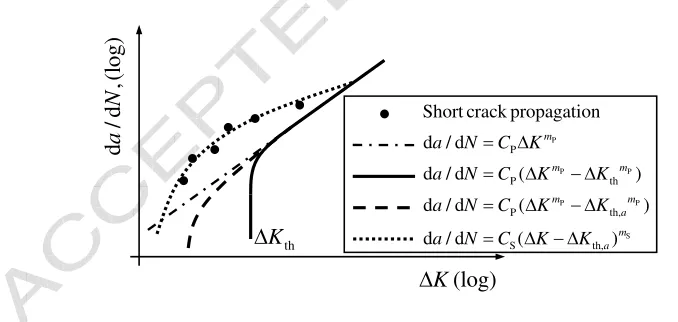
To model the PSC propagation rate, Chapetti considered the use of Eq.1, in which
he replaced the long crack threshold stress intensity factor range ∆Kth with the
short crack threshold∆Kth,a(defined in Eq.7) that is a function of the crack size a.
ACCEPTED MANUSCRIPT
1 2 3 4 5 6 7 8 9 10 11 12 13 14 15 16 17 18 19 20 21 22 23 24 25 26 27 28 29 30 31 32 33 34 35 36 37 38 39 40 41 42 43 44 45 46 47 48 49 50 51 52 53 54 55 56 57 58 59 60 61 62 63
approach the stress intensity full range∆K is considered instead of the positive
por-tion of the range∆K+, or the effective portion of the range∆Keff(positive portion
minus opening stress intensity factor) that are suggested in different approaches. The crack closure during a portion of the fatigue cycle is the intrinsic component of the threshold stress intensity range. The threshold stress intensity factor range increases, as the crack grows, due to the closure saturation. The difference between the full range and the threshold term (Eq.1) correctly considers the crack closure and then it is assumed a physically relevant propagation driving force parameter. However, the same author also proposed the use of the other equation: Eq.2 to model the short crack propagation, in papers Refs.[27,31].
In the present paper long crack propagation is modeled by means of Eq.2, while Eq.1 is used for physically short crack propagation only, introducing the short crack threshold which is a function of the crack size. Eq.1 is then re–issued here to be ded-icated uniquely to the PSC propagation:
da
dN =CS(∆K−∆Kth,a)
mS (11)
In the following, the term∆Kth,ais evaluated by means of the El Haddad short crack
threshold Eq.3. By considering Chapetti short crack threshold (Eq.7) in Eq.11, in-stead of El Haddad, negligible difference would result since the two models are quite similar, Fig.2,3. This difference is much smaller than the inherent short crack propagation data scatter. More importantly, modeling the PSC propagation with
Eq.2, and substituting the PSC threshold∆Kth,a, limits the PSC propagation rate to
be lower than the Paris straight line (CP(∆KmP−∆Kthm,aP)<CP∆KmP), Fig.4, while
experimental data shows that the PSC propagation rate can be higher (see data re-ported later, in Fig.5).
th
K
'
(log) K
'
d
/
d
,(
lo
g
)
a
N
P
P P
P P
S
P
P th
P th,
S th,
Short crack propagation
d / d
d / d ( )
d / d ( )
d / d ( )
m
m m
m m
a
m a
a N C K
a N C K K
a N C K K
a N C K K
'
' '
' '
[image:11.612.99.438.444.605.2]' '
Fig. 4. Crack propagation models.
A similar approach was followed by Navarro et al. in a fretting fatigue application [32]. They found the crack propagation fatigue life portion integrating a growth rate equation proposed by the NASA/FLAGRO software. That equation has a more
complex form than the Eq.11, however it contains the term∆K−∆Kth. They
intro-duced the El Haddad short crack correction for∆Kthto obtain higher propagation
rate while the crack is short, and then properly model their experimental results. The short crack propagation rate experimental data are drawn from the literature
ACCEPTED MANUSCRIPT
1 2 3 4 5 6 7 8 9 10 11 12 13 14 15 16 17 18 19 20 21 22 23 24 25 26 27 28 29 30 31 32 33 34 35 36 37 38 39 40 41 42 43 44 45 46 47 48 49 50 51 52 53 54 55 56 57 58 59 60 61 62 63fitting Eq.11 and results are summarized in Tab.4.
101 10−10 10−9 10−8 10−7 Long crack Kaynak 1992 Eq.11,3
[ MPa m ], (log) K ' d /d [ m /c y cl e ], (l o g ) a N
100 101
10−10 10−9 10−8 10−7 10−6 Long crack Tokaji 1990 (S I) Tokaji 1990 (S II) Eq.11,3
[ MPa m ], (log) K ' d /d [ m /c y cl e ], (l o g ) a N (a) (b)
101 102
10−10 10−9 10−8 10−7 10−6 Long crack Jono 1996 Eq.11,3
[ MPa m ], (log) K ' d /d [ m /c y cl e ], (l o g ) a N
100 101 102
10−12 10−10 10−8 10−6 10−4 Long crack Peters 2002 Eq.11,3
[ MPa m ], (log) K ' d /d [ m /c y cl e ], (l o g ) a N (c) (d)
Fig. 5. Short crack propagation prediction given by Eq.11 and El Haddad threshold. (a) 2024–T3, R=−1, experimental data from Ref.[33]. (b) 7075–T6, R=−1, Ref.[34]. (c) Ti–6Al–4V, R=−1, Ref.[35]. (d) Ti–6Al–4V, R=0.1, Ref.[11].
R mS CS
Alloy (MPam/cycle√
m)mS
2024–T3 -1 1.76 9.75×10⁻¹⁰
7075–T6 -1 1.57 2.20×10⁻⁹
Ti–6Al–4V -1 1.58 6.03×10⁻¹⁰
[image:12.612.109.506.86.435.2]Ti–6Al–4V 0.1 1.54 2.70×10⁻⁹
Table 4
Eq.11 material parameters.
Obviously, it follows that mS <mP for all materials. This condition implies that
short crack propagation line crosses the long crack propagation line at some crack size. This behavior is well known from short crack propagation experimental obser-vation.
Fig.5(a) reports short crack propagation data for 2024–T3 aluminum alloy [33].
[image:12.612.95.392.489.624.2]ACCEPTED MANUSCRIPT
1 2 3 4 5 6 7 8 9 10 11 12 13 14 15 16 17 18 19 20 21 22 23 24 25 26 27 28 29 30 31 32 33 34 35 36 37 38 39 40 41 42 43 44 45 46 47 48 49 50 51 52 53 54 55 56 57 58 59 60 61 62 63
exactly the physically short crack size range.
Fig.5(b) shows short crack propagation data for 7075–T6 aluminum alloy. In Ref.[34] two series of short crack propagation data are reported at two quite similar cyclic stress ranges, then in the present paper model the average cyclic stress was assumed
∆σ =610 MPa. Moreover, short crack data in Ref.[34] are distinguished between
Stage I and Stage II propagation. It is possible to observe that Stage I / Stage II transition is slightly later that MSC / PSC transition, indeed some points in the PSC regime are still in the Stage I propagation. Obviously this result is not general, but it is restricted to this particular alloy at this loading condition. The present paper model (Eq.11, dashed line) was obtained simulating a short crack a ranging from
d to 5 d2. The PSC higher rate propagation does not cross the long crack behavior
at exactly d2 but for a larger crack size. Other short crack fatigue data were
avail-able in the literature for this (quite common) aluminum alloy. In particular, short crack data reported in Ref.[17], showed a higher rate than long cracks, even at quite large crack size, in the order of millimeters. As discussed above, Eq.11 allows for
PSC higher propagation rate than LC even for a crack larger than d2. However, data
reported in Ref.[17] was not completely coherent with the short crack model here obtained, because PSC higher propagation rate than LC was extended to very large crack size.
Fig.5(c) shows short crack propagation data for Ti–6Al–4V (R=−1). In Ref.[35]
several cyclic stress series are reported, not very different among them. The average
cyclic stress∆σ =1271 MPa was considered and short crack material parameters
obtained. In the reported model short crack a ranges from 2d to 2 d2. Unfortunately,
short crack data are not available in the very short crack threshold region (with
at least some points lower than 10−9 m/cycle) limiting the accuracy check of the
proposed model. For the same material, and loading condition, a very similar pre-diction was obtained from data in Ref.[36] (for brevity not reported here).
Finally, Fig.5(d) shows short crack propagation data for Ti–6Al–4V (R=0.1). In
Ref.[37] short crack propagation data is reported for cyclic stress∆σ =450 MPa.
The reported models were obtained for a short crack a ranging from 1.3 d to 6 d2.
For this material and loading condition, the short / long crossing point is obtained
for a=6 d2, i.e. for a crack size which definitely should be already ‘long’. This
apparent model inconsistency was already found for materials 7075–T6 and Ti–
6Al–4V (R=−1). It is worth stressing that the short / long crack size transition for
crack propagation rate can be much higher than the short / long crack size transi-tion at threshold (d2).
An experimental evidence is that the stress intensity factor does not completely describe the short crack behavior, but the short crack propagation is also
sensi-tive to the stress level ∆σ. In other words two short cracks, different in size, but
loaded by the same∆K, do not show same propagation rate; in particular the shorter
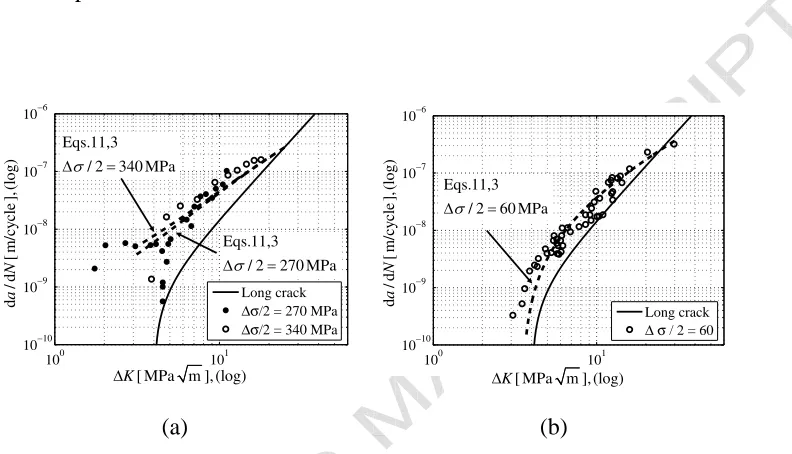
one grows faster than the other because it is loaded by a higher cyclic stress level. This experimental evidence is acknowledged in the present PSC propagation model Eqs.11,3, indeed the threshold term is sensitive to the crack size. Fig.6(a) shows short crack propagation data, previously presented about the 7075–T6 aluminum
alloy, where two data series were produced at different stress levels∆σ (previously
ACCEPTED MANUSCRIPT
1 2 3 4 5 6 7 8 9 10 11 12 13 14 15 16 17 18 19 20 21 22 23 24 25 26 27 28 29 30 31 32 33 34 35 36 37 38 39 40 41 42 43 44 45 46 47 48 49 50 51 52 53 54 55 56 57 58 59 60 61 62 63
stress levels∆σ that the experimental series were obtained. At the same ∆K, the
higher the stress level, the higher the propagation rate, coherently with the experi-mental results. However, Fig.6(a) data was obtained with very similar cyclic stress levels and then the two lines are almost overlapped, indeed the two experimental series are very near. A clearer comparison is given by Fig.6(b) that shows same material short crack propagation, under a lower cyclic stress. This other short crack series was drawn from the paper by Bu and Stephens, Ref.[17]. The present model reproduces a slower propagation rate, especially near the threshold, in agreement with the experimental results.
100 101
10−10 10−9 10−8 10−7 10−6
Long crack
∆σ/2 = 270 MPa
∆σ/2 = 340 MPa
[ MPa m ], (log) K
'
d
/d
[
m
/c
y
cl
e
],
(l
o
g
)
a
N
Eqs.11,3 / 2 340 MPa V
'
Eqs.11,3
/ 2 270 MPa V
'
100 101
10−10 10−9 10−8 10−7 10−6
Long crack
∆ σ / 2 = 60
[ MPa m ], (log) K
'
d
/d
[
m
/c
y
cl
e
],
(l
o
g
)
a
N
Eqs.11,3 / 2 60 MPa V
'
[image:14.612.107.503.192.419.2](a) (b)
Fig. 6. Short crack propagation sensitivity to load level∆σ: (a) high cyclic stress level, data from Tokaji et al. 1990 [34], (b) low cyclic stress level, data from Bu and Stephens 1986 [17].
In the PSC regime the small scale yielding condition can be at the limit of its va-lidity. For example, assuming the simple Irwin’s model to esteem the plastic size
for a semielliptical crack (β =0.748) with a crack size a=0.100 mm, in a thick
7075–T6 aluminum alloy component (yield strength SY =500 MPa), loaded by
σ =300 MPa, stress intensity factor K=4.0 MPa√m, the plane strain plastic size
is rp=0.004 mm, i.e. 25 times smaller the crack size. Miller [4] pointed out that
ACCEPTED MANUSCRIPT
1 2 3 4 5 6 7 8 9 10 11 12 13 14 15 16 17 18 19 20 21 22 23 24 25 26 27 28 29 30 31 32 33 34 35 36 37 38 39 40 41 42 43 44 45 46 47 48 49 50 51 52 53 54 55 56 57 58 59 60 61 62 63
6 Fatigue crack initiation from S–N curves
Finite life HCF testing is usually obtained from plain specimens under cyclic axial
load. The number of cycles to failure Nf is considered at the complete fracture of
the specimen, or sometimes, at the occurrence of a visible crack, or a crack large enough that reduces specimen stiffness perceptibly. In all these three conditions the final crack size is already long.
Assuming initiation / propagation transition at d crack size, it is possible to predict the number of cycles for propagation and then subtract the propagation portion to find the number of cycles just for initiation. The propagation phase is given by the PSC propagation plus the LC propagation, up to the final failure (or one of the conditions above). To find the number of cycles for PSC propagation it suffices to integrate Eq.11 starting from d up to the short / long crack crossing point. After that, physically short crack becomes long crack and then propagation prediction is
given by Eq.2. A purer initiation information is then drawn from the S−N curves:
the number of cycles Nito nucleate the d crack size, as function of the cyclic load
amplitudeσa, in the HCF regime.
The idea of subtracting the propagation portion from the S−N curve was also
re-cently proposed by McClung et al., [38]. They did not suggest a precise initiation size, they just proposed a crack size much shorter than 1 mm (which is traditionally considered the initiation from an engineering point of view) but not shorter than the material grain size.
To back calculate the plain specimen crack growth some assumptions were intro-duced. As the crack propagates through a round specimen bar, the crack shape
factorβ increases, mainly because the ligament area reduces. The round bar crack
through stress intensity factor problem has been widely investigated, even recently, through Finite Element (FE) [39–43,24]. In these papers particular attention was devoted to the crack shape evolution, when the crack propagates inside the round bar, for different initial elliptical crack aspect ratios. While the crack size is equal to (or not much larger than) the material length d, the crack is very smaller than the
specimen diameter Ds (usually around 10 mm). This geometrical configuration is
equivalent to the semielliptical flat surface crack in a seminfinite body. The aspect ratio evolution, as the crack grows inside the specimen, is not considered in the present paper because almost the entire propagation is spent as the crack is much smaller than Ds. The initial preferential aspect ratio a/c=0.8 is assumed
through-out the entire life of the fatigue crack. However, the dependency of the shape factor
β to a/Ds (assuming constant aspect ratio), has been taken into account following
the results published in Ref.[39].
In Fig.7 the propagation portion Np is compared to the entire fatigue life Nf and
the initiation portion Niresults as difference. The HCF initiation S−N curves were
found for all the investigated materials.
It is evident that the despite materials scatter, the predicted propagation life was al-ways lower than the entire fatigue life for all materials, in the HCF regime Nf>104.
Among the four investigated materials, the Ti alloy loaded at R=0.1 shows a much
ACCEPTED MANUSCRIPT
1 2 3 4 5 6 7 8 9 10 11 12 13 14 15 16 17 18 19 20 21 22 23 24 25 26 27 28 29 30 31 32 33 34 35 36 37 38 39 40 41 42 43 44 45 46 47 48 49 50 51 52 53 54 55 56 57 58 59 60 61 62 63
103 104 105 106 107 0
100 200 300 400 500
S−N curve
PSC prop. int. Eq.11 + LC prop. Initiation
i, p, f, (log)
N N N
a
[
MP
a
]
V
103 104 105 106 107 0
100 200 300 400 500
S−N curve
PSC prop. int. Eq.11 + LC prop. Initiation
i, p, f, (log)
N N N
a
[
MP
a
]
V
(a) (b)
103 104 105 106 107 0
200 400 600 800 1000
S−N curve
PSC prop. int. Eq.11 + LC prop. Initiation
i, p, f, (log)
N N N
a
[
MP
a
]
V
103 104 105 106 107 108 0
100 200 300 400 500
S−N curve
PSC prop. int. Eq.11 + LC prop. Initiation
i, p, f, (log)
N N N
a
[
MP
a
]
V
[image:16.612.109.503.67.410.2](c) (d)
Fig. 7. Predicted propagation fatigue life portion, against entire fatigue life: (a) 2024–T3, R=−1, fatigue data is from Ref.[10]. (b) 7075–T6, R=−1, Ref.[10]. (c) Ti–6Al–4V, R=−1, Ref.[10]. (d) Ti–6Al–4V, R=0.1, Ref.[11].
7 Application
In a notched component the fatigue crack propagation is a large portion of the entire fatigue life. The stress at the notch root is high, then the fatigue crack easily initiates, but as the crack grows the stress intensity factor trend is lower than in the plain spec-imen geometry, due to the stress gradient. The crack propagation emanating from a notch can experience a retardation or the crack can even stop propagating. The present model focuses on the physically short crack only, the mechanically short crack fatigue life can not be predicted with the proposed model. A finite radius
notch specimen fatigue S−N curve was considered to validate the model.
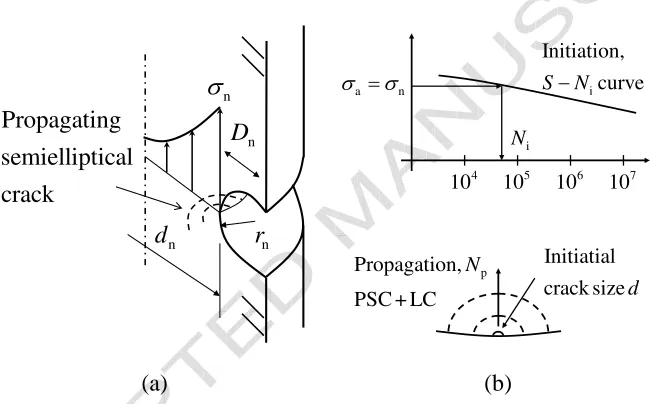
Mac-Gregor and Grossmann [44,12] published un–notched and notched fatigue data for the main aeronautical structural materials. In particular they published aluminum
alloy 2024–T4 round notched fatigue test results, with notch depth Dn=1.59 mm,
notch inner diameter dn=7.62 mm, and notch radius rn=0.25 mm, Fig.8(a). In the
ACCEPTED MANUSCRIPT
1 2 3 4 5 6 7 8 9 10 11 12 13 14 15 16 17 18 19 20 21 22 23 24 25 26 27 28 29 30 31 32 33 34 35 36 37 38 39 40 41 42 43 44 45 46 47 48 49 50 51 52 53 54 55 56 57 58 59 60 61 62 63
indeed the plain specimen S−N fatigue curve, reported by MacGregor and
Gross-mann [44] (not reported here for brevity) and the S−N curve reported by Boller
and Seeger showed very similar mean lines.
The crack initiation number of cycles can be obtained from the material initiation
S−N curve that was found in the previous section, Fig.7(a). At the blunt notch root
the stress distribution is approximately uniaxial and uniform, up to a depth equal to
d, so in similar conditions than that reproduced by the plain specimen S−N testing,
Fig.8(b). After the initiation, the subsequent PSC plus LC propagation phases were evaluated by assuming a semielliptical crack growing from the notch root, calcu-lating the stress intensity factor at the deepest point on the crack front and using the proposed propagation model. FE simulations were performed to calculate the stress intensity factor for different crack sizes. A solid three–dimensional analysis was performed first, followed by a plane strain analysis submodel simulation [45], obtaining the stress intensity factor using the parabolic quarter–point elements [25]. A numerical fit was then used to find the stress intensity factor as a function of the crack size.
n
V
n d
n D
n r Propagating
semielliptical crack
Initiatial
crack sized
p
Propagation,
PSC + LC N
4
10 105 106 107
i
N
i
Initiation,
curve SN
a n
V V
[image:17.612.126.452.292.494.2](a) (b)
Fig. 8. Blunt notch under fatigue loading: (a) geometry, (b) fatigue crack initiation and propagation predictions.
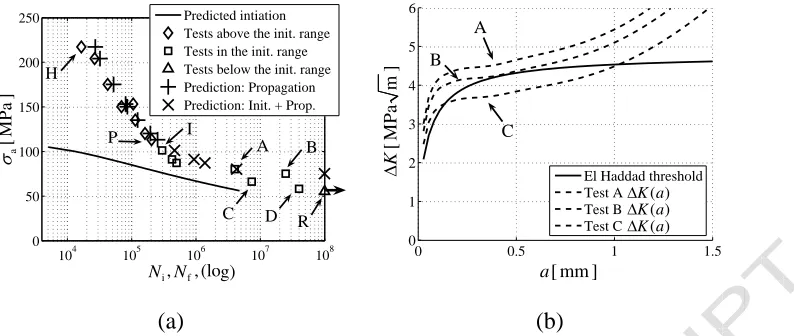
The comparison between the experimental and the model prediction results are re-ported in Fig.9(a). The notched specimen initiation curve was obtained from the plain specimen initiation curve, divided by the notch stress concentration factor
kt. The initiation stress range divided the notched tests into three groups: the tests
above the initiation stress range (from the highest stress test, labeled ‘H’, to the test labeled ‘P’); the tests inside the initiation range (from test ‘I’ to ‘D’); and finally the test ‘R’ below the initiation stress range, Fig.9(a).
The prediction of the first group of tests was propagation only, because the initiation is small in comparison to the PSC and LC propagation. For each test the predicted fatigue life was very similar to the experimental, Fig.9(a).
ACCEPTED MANUSCRIPT
1 2 3 4 5 6 7 8 9 10 11 12 13 14 15 16 17 18 19 20 21 22 23 24 25 26 27 28 29 30 31 32 33 34 35 36 37 38 39 40 41 42 43 44 45 46 47 48 49 50 51 52 53 54 55 56 57 58 59 60 61 62 63
104 105 106 107 108 0
50 100 150 200
250 Predicted intiation Tests above the init. range Tests in the init. range Tests below the init. range Prediction: Propagation Prediction: Init. + Prop.
A B
C R
P I
D H
i, f, (log)
N N
a
[
M
P
a
]
V
0 0.5 1 1.5
0 1 2 3 4 5 6
El Haddad threshold Test A
Test B Test C A
B
C
[ mm ]
a
( ) K a '
( ) K a '
( ) K a '
[
M
P
a
m
]
K
'
[image:18.612.109.506.66.234.2](a) (b)
Fig. 9. Notched geometry results: (a) prediction fatigue life compared with the experimental results, (b) non propagating crack prediction.
range as function of the crack size at the notch root∆K(a), and the El Haddad
resis-tance curve∆Kth,a, Eq.3. The driving force is the difference of the two, according
to Eq.11. In test ‘A’, the short crack experiences a retardation but does not stop. In
test ‘B’, the∆K(a)curve almost collapses on the resistance curve, and then the
pre-dicted propagation is very high, due to the strong retardation at the crack size where two curves are very near. This critical condition is very sensitive to many factors that are here approximated, such as the actual resistance curve, and also the crack
aspect ratio that is here assumed a/c=0.8 as in the plain specimen, but that can
be smaller for a notch crack, and then the∆K(a)would be higher. About the tests
‘C’ and ‘D’, after the initiation, the model predicts the non propagating condition
when the∆K(a)curve crosses the El Haddad resistance curve. On the contrary, the
experimental evidence is failure instead of crack arrest. It is difficult to provide a precise explanation of this, because again many factors can play a role. A possible mechanism of coalescence of multiple initiated cracks can generate a wide crack
front. The actual∆K would be quite higher than that predicted assuming a single
crack leading to propagation up to the final failure, instead of crack arrest.
Finally, the test ‘R’ was predicted as not initiated crack, because the stress level was below the initiation stress range, indeed, it was a run out test.
8 Discussion
This study offers a link between fatigue stress and fatigue fracture mechanics ap-proaches. The stress approach can be used to predict the number of cycles just for initiation, and a precise initial propagation crack size is given. After that, the frac-ture mechanics can be used and the entire fatigue life obtained. This initiation / propagation separation is useful especially when the propagation phase is expected
to be larger than that in the S−N plain specimen tests. If the fatigued component
ACCEPTED MANUSCRIPT
1 2 3 4 5 6 7 8 9 10 11 12 13 14 15 16 17 18 19 20 21 22 23 24 25 26 27 28 29 30 31 32 33 34 35 36 37 38 39 40 41 42 43 44 45 46 47 48 49 50 51 52 53 54 55 56 57 58 59 60 61 62 63
and the notched specimens are compared in terms of the peak stress at the notch root
(σnin Fig.8) the notched component fatigue strength would be underestimated. This
is usually expressed by the fact that the fatigue notch factor is lower than the stress concentration factor. However, the information given by the plain specimen fatigue
S−N curve and the material short crack propagation allowed to reproduce notched
fatigue strength calculating the initiation and the further propagation, taking into ac-count the stress gradient below the notch root surface. In principle, this approach is an extension of the Theory of Critical Distances, because a generic notched geom-etry fatigue strength is obtained combining the two material pieces of information drawn from the two extreme conditions: the fatigue strength of the plain specimen: no stress concentration; and the fatigue behavior of the crack: strongest stress con-centration.
In the paper, the short crack propagation materials data and the S−N curves were
drawn from independent testing for all investigated alloys, except for Ti alloy Ti–
6Al–4V, R=0.1. Some inaccuracy of the results here shown, can be ascribed to
the fact that crack propagation and fatigue life were drawn from just nominally same materials. In the Application case study, the discrepancy between the model prediction and the experimental finite fatigue life for tests ‘C’ and ‘D’ (Fig.9) can also be addressed to the not perfectly equal materials heat treatments, especially in the critical condition of almost arrested crack, where the model discrepancy was higher. It was also found (details are not reported for brevity) that the aspect ratio plays a very important role especially if a small difference of the predicted stress intensity factor generates large difference of the predicted propagation number of cycles, or even discriminates the propagating or arrest condition. However, the er-rors in predicting specimens B, C and D are quite small and fall within the scatter in the experimental results.
The size of the microstructure strongest barrier should be determined from the crack growth rate data, while it is here suggested to esteem d from the material microstructure direct observation, looking for different metallic microstructure fea-tures depending on the alloy and heat treatment. Obtaining d from the material observation it is simpler than from crack growth rate and it is enough accurate to provide an indicative length that can be used in the proposed model.
The present physically short crack model can also be used for extending damage tolerant approach. If the experimental crack inspection resolution is adequate to de-tect cracks in the physically short crack regime, the remaining fatigue life can be calculating, offering larger inspection periods.
9 Conclusions
(1) A physically short crack model was proposed, based on the driving force con-cept. Materials parameters were obtained by fitting experimental data drawn from the literature.
propaga-ACCEPTED MANUSCRIPT
1 2 3 4 5 6 7 8 9 10 11 12 13 14 15 16 17 18 19 20 21 22 23 24 25 26 27 28 29 30 31 32 33 34 35 36 37 38 39 40 41 42 43 44 45 46 47 48 49 50 51 52 53 54 55 56 57 58 59 60 61 62 63
tion rate, than expected according to long crack behavior, even when the crack size is already quite larger than the minimum long crack threshold size. The proposed model does not explain the mechanistic reason for that, but it of-fers a phenomenological tool to describe this behavior. Moreover, El Haddad threshold was assumed instead of Chapetti threshold. El Haddad equation is simpler and the values are quite similar.
(3) By subtracting physically short, and long, crack propagation cycles from the entire fatigue life, it is then possible to extract the initiation number of cycles
from the S−N curves.
(4) Aluminum alloys 2024–T3, 7075–T6 and Ti alloy Ti–6Al–4V S−N curves,
load ratio R=−1, showed that propagation portion is actually negligible
ap-proaching to the fatigue strength, but near Nf=104 propagation is already a
large portion of the entire fatigue life. On the contrary, Ti alloy Ti–6Al–4V,
load ratio R=0.1, showed physically short crack rate so high that even at
Nf =104propagation is still a small portion of the entire fatigue life.
(5) A validation of the model was provided by predicting the fatigue S−N curve
of a notched specimen and comparing the calculated fatigue life to the exper-imental result. The model was able to predict the number of cycles to failure quite accurately both when the initiation was smaller than the propagation and when the initiation was predominant.
References
[1] M.D. Chapetti. Fatigue propagation threshold of short cracks under constant amplitude loading. International Journal of Fatigue, 25(12):1319–1326, 2003.
[2] S. Suresh. Fatigue of Materials. Cambridge University Press, 2nd edition, 1998.
[3] S. Suresh and R.O. Ritchie. The Propagation of Short Fatigue Cracks. International Metals Reviews, 29(6):445–476, 1984.
[4] K.J. Miller. The short crack problem. Fatigue & Fracture of Engineering Materials & Structures, 5(3):223–232, 1982.
[5] K.J. Miller. The two thresholds of fatigue behaviour. Fatigue & Fracture of Engineering Materials & Structures, 16(9):931–939, 1993.
[6] K.J. Miller and W.J. O’Donnell. The fatigue limit and its elimination. Fatigue & Fracture of Engineering Materials & Structures, 22(7):545–557, 1999.
[7] F.O. Riemelmoser and R. Pippan. Consideration of the mechanical behaviour of small fatigue cracks. International Journal of Fracture, 118(3):251–270, 2002.
[8] R. Pippan and F.O. Riemelmoser. Visualization of the plasticity–induced crack closure under plane strain conditions. Engineering Fracture Mechanics, 60(3):315–322, 1998.
ACCEPTED MANUSCRIPT
1 2 3 4 5 6 7 8 9 10 11 12 13 14 15 16 17 18 19 20 21 22 23 24 25 26 27 28 29 30 31 32 33 34 35 36 37 38 39 40 41 42 43 44 45 46 47 48 49 50 51 52 53 54 55 56 57 58 59 60 61 62 63
[10] C. Boller and T. Seeger. Materials data for cyclic loading, volume 42E of Materials science monographs. Elsevier, 1987. Part D: Aluminium and titanium alloys.
[11] J.O. Peters, B.L. Boyce, X. Chen, J.M. McNaney, J.W. Hutchinson, and R.O. Ritchie. On the application of the Kitagawa–Takahashi diagram to foreign-object damage and high-cycle fatigue. Engineering Fracture Mechanics, 69(13):1425–1446, 2002.
[12] N.E. Dowling. Mechanical Behavior of Materials: Engineering Methods for
Deformation, Fracture, and Fatigue. Prentice Hall, 3rd edition, 2007.
[13] F. Ellyin. Fatigue damage, crack growth and life prediction. Chapmen & Hall, 1st edition, 1997.
[14] X. Zheng and M.A. Hirt. Fatigue crack propagation in steels. Engineering Fracture Mechanics, 18(5):965–973, 1983.
[15] M. Klesnil and P. Luk´aˇs. Fatigue of metallic materials, volume 7 of Materials science monograph. Elsevier, 1980.
[16] B. Holper, H. Mayer, A.K. Vasudevan, and S.E. Stanzl-Tschegg. Near threshold fatigue crack growth in aluminium alloys at low and ultrasonic frequency: Influences of specimen thickness, strain rate, slip behaviour and air humidity. International Journal of Fatigue, 25(5):397–411, 2003.
[17] R. Bu and R.I. Stephens. Comparison of short and long fatigue crack growth in 7075– T6 aluminum. Fatigue & Fracture of Engineering Materials & Structures, 9(1):35–48, 1986.
[18] X.R. Wu, J.C. Newman, W. Zhao, M.H. Swain, C.F. Ding, and E.P. Phillips. Small crack growth and fatigue life predictions for high-strength aluminium alloys: part I– experimental and fracture mechanics analysis. Fatigue & Fracture of Engineering Materials & Structures, 21(11):1289–1306, 1998.
[19] S. Stanzl-Tschegg. Fatigue crack growth and thresholds at ultrasonic frequencies. International Journal of Fatigue, 28(11):1456–1464, 2006.
[20] B.L. Boyce and R.O. Ritchie. Effect of load ratio and maximum stress intensity on the fatigue threshold in Ti–6Al–4V. Engineering Fracture Mechanics, 68(2):129–147, 2001.
[21] M.H. El Haddad, T.H. Topper, and K.N. Smith. Prediction of non propagating cracks. Engineering Fracture Mechanics, 11(3):573–584, 1979.
[22] B. Atzori, P. Lazzarin, and G. Meneghetti. Fracture mechanics and notch sensitivity. Fatigue & Fracture of Engineering Materials & Structures, 26(3):257–267, 2003.
[23] D. Taylor. The theory of critical distances: a new perspective in fracture mechanics. Elsevier, 2007.
[24] K.O. Findley, S.W. Koh, and A. Saxena. J–integral expressions for semi–elliptical cracks in round bars. International Journal of Fatigue, 29(5):822–828, 2007.
ACCEPTED MANUSCRIPT
1 2 3 4 5 6 7 8 9 10 11 12 13 14 15 16 17 18 19 20 21 22 23 24 25 26 27 28 29 30 31 32 33 34 35 36 37 38 39 40 41 42 43 44 45 46 47 48 49 50 51 52 53 54 55 56 57 58 59 60 61 62 63
[26] M.D. Chapetti, T. Tagawa, and T. Miyata. Fatigue notch sensitivity of steel blunt– notched specimens. Fatigue & Fracture of Engineering Materials & Structures, 25(2):619–723, 2002.
[27] M.D. Chapetti. Application of a threshold curve model to high-cycle fatigue behavior of small cracks induced by foreign-object damage in Ti–6Al–4V. International Journal of Fatigue, 27(5):493–501, 2005.
[28] D. Taylor and J.F. Knott. Fatigue crack propagation behaviour of short cracks; the effect of microstructure. Fatigue & Fracture of Engineering Materials & Structures, 4(2):147–155, 1981.
[29] J. Lankford. The growth of small fatigue cracks in 7075–T6 aluminum. Fatigue & Fracture of Engineering Materials & Structures, 5(3):233–248, 1982.
[30] T. Ogawa, K. Tokaji, and K. Ohya. The effect of microstructure and fracture surface roughness on fatigue crack propagation in a Ti–6A1–4V alloy. Fatigue & Fracture of Engineering Materials & Structures, 16(9):973–982, 1993.
[31] M.D. Chapetti. High–cycle fatigue of austempered ductile iron (ADI). International Journal of Fatigue, 29(5):860–868, 2007.
[32] C. Navarro, M. Garcia, and J. Dominguez. A procedure for estimating the total life in fretting fatigue. Fatigue & Fracture of Engineering Materials & Structures, 26(5):459– 468, 2003.
[33] C. Kaynak and A. Ankara. Short fatigue crack growth in AL 2024–T3 and AL 7075– T6. Engineering Fracture Mechanics, 43(5):769–778, 1992.
[34] K. Tokaji, T. Ogawa, and Y. Kameyama. The effects of stress ratio on the growth behaviour of small fatigue cracks in an aluminum alloy 7075–T6 (with special interest in stage i crack growth). Fatigue & Fracture of Engineering Materials & Structures, 13(4):411–421, 1990.
[35] M. Jono and A. Sugeta. Crack closure and effect of load variation on small fatigue crack growth behaviour. Fatigue & Fracture of Engineering Materials & Structures, 19(2–3):165–174, 1996.
[36] K. Tokaji. High cycle fatigue behaviour of Ti–6Al–4V alloy at elevated temperatures. Scripta Materialia, 54(12):2143–2148, 2006.
[37] J.O. Peters and R.O. Ritchie. Foreign-object damage and high-cycle fatigue of Ti– 6Al–4V. Materials Science and Engineering A, 319–321:597–601, 2001.
[38] R.C. McClung, W.L. Francis, and Jr. S.J. Hudak. A new approach to fatigue life prediction based on nucleation and growth. In Elsevier, editor, Fatigue 2006 – 9th International Fatigue Congress, 2006. Atlanta, GA.
[39] A. Carpinteri. Elliptical–arc surface cracks in round bars. Fatigue & Fracture of Engineering Materials & Structures, 15(11):1141–1153, 1992.
ACCEPTED MANUSCRIPT
1 2 3 4 5 6 7 8 9 10 11 12 13 14 15 16 17 18 19 20 21 22 23 24 25 26 27 28 29 30 31 32 33 34 35 36 37 38 39 40 41 42 43 44 45 46 47 48 49 50 51 52 53 54 55 56 57 58 59 60 61 62 63
[41] Y.S. Shih and J.J. Chen. Analysis of fatigue crack growth on a cracked shaft. International Journal of Fatigue, 19(6):477–485, 1997.
[42] C.Q. Cai and C.S. Shin. A normalized area-compliance method for monitoring surface crack development in a cylindrical rod. International Journal of Fatigue, 27(7):801– 809, 2005.
[43] C.S. Shin and C.Q. Cai. Evaluating fatigue crack propagation properties using a cylindrical rod specimen. International Journal of Fatigue, 29(3):397–405, 2007.
[44] C.W. MacGregor and N. Grossman. Effects of Cyclic Loading on Mechanical
Behavior of 24S–T4 and 75S–T6 Aluminum Alloys and SAE 4130 Steel. In National Advisory Commitee for Aeronautics, 1952. NACA TN 2812.
![Fig. 1. Long crack near threshold propagation: (a) 2024–T3 (RTi–6Al–4V ( = −1), experimental datafrom Ref.[16]](https://thumb-us.123doks.com/thumbv2/123dok_us/1479438.687539/6.612.102.499.165.574/fig-long-crack-near-threshold-propagation-experimental-datafrom.webp)

![Fig.5(a) reports short crack propagation data for 2024–T3 aluminum alloy [33]. Eq.11 with El Haddad threshold is shown for a short crack a ranging from d to d2,](https://thumb-us.123doks.com/thumbv2/123dok_us/1479438.687539/12.612.109.506.86.435/reports-short-propagation-aluminum-haddad-threshold-short-ranging.webp)
![Fig. 7. Predicted propagation fatigue life portion, against entire fatigue life: (a) 2024–T3,R = −1, fatigue data is from Ref.[10]](https://thumb-us.123doks.com/thumbv2/123dok_us/1479438.687539/16.612.109.503.67.410/fig-predicted-propagation-fatigue-portion-entire-fatigue-fatigue.webp)