Original Article
A study on the tissue infiltration
mechanism of
18F-FDG PET/CT in determining
biological boundaries of hepatic alveolar echinococcosis
Xiao-Hong Li, Qi-Zhou Zhang, Bin Xie, Yu-Bin Li, Aminah, Li-Shui Liu, Yong-De Qin
Department of Nuclear Medicine, The First Affiliated Hospital of Xinjiang Medical University, Urumqi 830054, China
Received October 10, 2015; Accepted March 31, 2016; Epub May 15, 2016; Published May 30, 2016
Abstract: Aim: This article aims to discuss the tissue infiltration mechanism of 18F-FDG PET/CT imaging in
determin-ing the biological boundary of hepatic alveolar echinococcosis (HAE). Methods: A total of 129 HAE patients were selected from the First Affiliated Hospital of Xinjiang Medical University and included into the present study. The collection mode of early-stage plus delay was conducted in all patients before the operation. Maximum standard uptake values (SUVmax) of the foci and liver tissues around the fringe area were collected and compared. The edge of the focus of infection was selected from the postoperative tissue samples of the 129 patients. Then, H&E staining, Masson dyeing and CD34 were conducted. Correlations between the SUVmax of the boundary zone and lymphocyte, fibrosis area and microvessel density were analyzed. Results: There was no obvious radioactive dis -tribution in the focus essence of the 129 patients. Differences in SUVmax between the focus marginal area and surrounding liver tissues were statistically significant (P<0.05), and SUVmax of the 179 focus essences and focus boundary zones were negatively correlated with the fibrosis area (r=-0.767, P=0.001). The I-model is a thick radio-active distribution belt. When SUVmax was 8.07 ± 4.40, radioradio-active distribution increased after the delaying for three hours; and the degree of concentration is positively correlated with microvessel density (r=0.878, P<0.05). The II-model is a thin radioactive distribution belt. When SUVmax was 2.71 ± 0.93, radioactive distribution did not exhibit any obvious change after delaying for three hours; and the degree of concentration was not correlated with microvessel density (P>0.05). The III-model is a defective radioactive distribution belt. When SUVmax was 1.22 ± 0.17, radioactive distribution decreased after delaying for three hours; while when SUVmax was 0.89 ± 0.07, the degree of concentration did not exhibit any correlation with microvessel density (P>0.05). In addition, SUVmax of the boundary zones are affected by granulation tumors around vesicae with different sizes, in which a large number of immune cells gather and infiltrate tissues via neovascularization. Conclusion: SUVmax in 18F-FDG PET/CT images
can reflect the degree of fibrosis at the edge of the focus and formation status of the capillary to a certain extent. This can be considered as one of the most effective methods for confirming the biological boundary of HAE, in order to offer more effective clinic guidance.
Keywords: Hepatic alveolar echinococcosis (HAE), single-photon emission computed tomography, deoxyglucose, biological boundary, comparative study
Introduction
Hepatic alveolar echinococcosis (HAE) is a kind of zoonotic parasitic disease that has caused great harm on the residents of Western China, and surgery is currently the leading treatment method for HAE [1]. The foci can be completely obliterated after its surrounding areas are com-pletely cut during the operation. However, in general, the focus of alveolar echinococcosis has no diolame and unclear boundaries with
it is necessary to evaluate the proliferation and invasion of nidi to determine further therapeu-tic schemes. In recent years, studies have dem-onstrated that [4] increasing 18F-FDG would increase glycolysis caused by cancer cell prolif-eration and the gene mutation of several can-cer signals during the conduction pathway. This can lead to apoptosis resistance, oxidative phosphorylation resistance and glycolysis acti-vation [5]. According to current studies, HAE has been verified to be more like tumors in terms of biological behaviors, such as new ves-sels and liver apoptosis around HAE nidi. On the other hand, imaging diagnoses have been mainly conducted for chronic inflammation based on the fact that 18F-FDG sets have increasingly higher requirements on energy through inflammatory and hyperplasia cells with active energy metabolism [6]. Studies have found that nidi are relatively stable in positron emission tomography/computed to- mography (PET/CT) development when 18F-FDG boundary metabolism keeps a sparse reduc-tion on radionuclide. Nidi are in at the prolifera-tion and invasion stage when metabolic level at the boundary of nidi shows a thick radioactive distribution [7]. On such basis, dynamic obser-vations on different energy metabolism situa-tions around HAE nidi and the definition of the biological boundary of nidi have new clinical significances for the infiltrative mechanism of HAE peripheral tissues. In this study, the inves-tigators aimed to analyze the correlation of maximum standard uptake values (SUVmax) with the fibrosis area and pathological micro-vascular density; and discuss whether 18F-FDG PET/CT development can reflect the biological characteristics of nidi and their histocytes in a marginal area, through evaluating the proliferation and invasion mechanisms of HAE, in order to provide more biological infor-mation for revealing lesion development and transference.
Materials and methods
Experimental materials
A total of 129 HAE patients diagnosed clinically or based on imaging inspection (at least two of the inspection methods listed below: ultra-sound, CT, or MRI) at the First Affiliated Hospital of Xinjiang Medical University between December 2010 and December 2013 were selected, including 77 male patients and 52
female patients; and average age of these patients was 40 ± 13 years. All patients accept-ed 18F-FDG PET/CT imaging and pathology demonstrations.
Instruments and reagents
GE Discovery VCT 64 PET/CT was obtained from GE Healthcare (USA); 18F-FDG tracer manufactured by the Qilin circular accelerator of GE, with radiochemical purification over 95%. Patients should fast for four to six hours prior PET/CT inspection, in order forfasting blood-glucose to be <7 mmol/L. Then, patients should accept 7.4 MBq/kg of 18F-FDG under sedentary conditions, drink 1,000 ml of water 30 minutes after accepting the 18F-FDG injection, and drink 300 ml of water again one hour after emptying their bladder, in order to fill the gastrointestinal tract. First, the scanned area was determined from the calva to upper and middle stage of the thighbone. Acquisition parameters of the CT image were as follows: voltage, 120 KV; tube current, 260 mA; detector collimation, 64×0.625 mm; thick-ness, 3.75 mm; interlayer spacing, 3.75 mm, 0.6 ms/rotate; screw pitch of the detector, 0.983; scanning time range, 20-30 seconds. During the inspection, the patients were instructed to be eupnea. PET 3D acquisition was conducted at the same scanned area of the CT, generally with 6-8 beds for three minutes in each bed. After acquisition was completed, attenuation correction was made on the PET images using CT data; and blending images of the cross section, coronal plane, vertical plane and PET/CT were acquired through ordered subset expectation-maximiza-tion (OSEM). PET/CT acquisiexpectation-maximiza-tion was condu- cted using 18FDG-PET/CT standard; that is, acquisition was carried out one hour after 18FDG-PET/CT injection. For delayed 18 FDG-PET/CT acquisition, FDG-PET/CT acquisition was conducted three hours after 18FDG-PET/CT injection.
Image analysis
determine the normal physiological uptake, normal variations and artifacts, etc. Second, the presence of thick nidi abnormal radiophar-maceuticals was determined, the nidi biological boundary was sketched, and the count and measurement of SUVmax in thick nidi were recorded. According to anatomic information, the nidi can be accurately located by CT images from the same machine.
Pathological analysis
All patients should receive operative treatment. During the collection process, samples were placed similar as the scanned position. During the pathological drawing process, the nidi boundary belt should be in line with the annular thick radioactivity belt, as shown in PET/CT. Pathological sections were conducted on lesion tissues, and sections were analyzed by physi-cians from the Department of Pathology.
Statistical analysis
Statistical analysis was conducted using SPSS 13.0 software. Measurement data were pre-sented as mean ± standard deviation. SUVmax of the central region, boundary zone and periphery liver tissues of the 37 HAE nidi were measured, respectively; and a correlation analysis between the fibrosis area and microvessel density was conducted. Pearson’s correlation analysis was conducted on materi-als that followed normal distribution; otherwise, Spearman’s correlation analysis was conduct-ed. Bilateral inspection was conducted at the 0.05 level.
Results
Imaging results
Among the 129 HAE patients, 93 patients had a single nidus, 22 patients had two nidi and 14 patients had three nidi. There are 179 nidi in total. Average diameter of HAE nidi is 14.75 ± 3.75 cm.
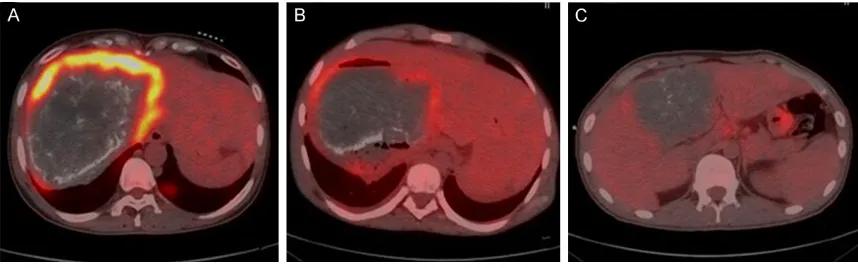
The livers of HAE patients had abnormal shapes, with imbalanced liver lobe ratios and incomplete outlines. Liver parenchyma radioac-tive distribution was uneven, and liver lobes are inconvenienced to various degrees. HAE patients had mixed occupied nidi with irregular shapes. HAE nidi boundaries were unclear and exhibited infiltrative growth, in which nidi periphery outlines can drawn through the inges-tion of radiopharmaceuticals. These can be divided into three models: I-model, a thick radioactive distribution belt; II-model, a thin radioactive distribution belt; III-model, a defec-tive radioacdefec-tive distribution belt (Figure 1).
Observations on pathological histology
[image:3.612.90.519.71.205.2]Visual observation: Faint yellow or off-white bubbly block masses were roughly shown with a hard texture. The masses were spongy and were gathered by countless small vesicae, with a faint yellow jelly liquid at the center of the nidus. Alternating necrotic light yellow and pale shiny fibers could be observed, which were embedded with incompact or piles of small vesicae (diameter, 1-3 mm) with a cellular- or wormy-like appearance.
Immumohistochemical staining: CD34 dyeing was conducted on the marginal area of nidi. It can be observed that nascent capillaries were marked as a claybank, and vascular endothelial cells after CD34-positive staining were clear. In addition to small vessels and central veins, hepatic sinusoids of normal hepatic tissues did not exhibit any CD34 expression (Figure 2). Using a computer-assisted image analysis sys-tem, a microvessel density value of 101 in the I-model nidi marginal area was measured to be 37.2 ± 7.5, a microvessel density value of 48 in the I-model nidi marginal area was measured to be 20.5 ± 5.4, and a microvessel density value of 30 in the III-model nidi marginal area was measured to be 7.7 ± 3.1 (Table 1). I-model is a thick radioactive distribution belt. When SUVmax is 8.07 ± 4.40, the degree of concen-tration is positively associated with microves-sel density (r=0.878, P<0.05).
H&E and Masson dyeing: HAE lesions were microscopically observed to be mainly made up of many follicles, intra-bubble fibrous matrixes, and a large number of sloughs and hashed cal-cifications. It is difficult to determine the necrot-ic structures and scattered calcifnecrot-ication com-positions in the structure. There were tubercu-loid granuloma and fibrous connective tissues around the coagulative necrosis, as well as in the major inflammatory cell infiltration, such as
[image:4.612.90.523.72.179.2]macrophages, lymphocytes, eosino-philic granulocytes and plasmo-cytes. There were few liver tissue organization structure residues on the edge of some sloughs and there were no fibrous capsules around the normal tissues. Thus, there was no obvious limit (Figure 2). SUVmax of the marginal zone was negatively Figure 2. A: HAE nidi edge tissue CD34 marks MVD dyeing. B: There are a large number of fibrous connective tis -sues and inflammatory cell infiltration in edge tis-sues of HAE. C: There are lymphocytes and eosinophilic granulocyte infiltration in edge tissues of HAE.
Table 1. The Value of I, II and III nidi Edge region MVD Type Number of indi MVD (unit/high power mirror) The initial SUVmax value (g/ml) Delay SUVmax value (g/ml) I 101 37.2 ± 7.5 8.07 ± 4.40 10.19 ± 6.70 II 48 20.5 ± 5.4 2.71 ± 0.93 2.56 ± 0.88 III 30 7.7 ± 3.1 1.22 ± 0.17 0.89 ± 0.07
correlated with the under-mirror fibrosis area (r=-0.767, P=0.001).
Measurement of the under-mirror fibrosis area: Masson dyeing can dye collagenous fiber blue. Masson dyeing images were acquired using a Leica microscope system (Leica DM3000). The absolute area (in pixels) was calculated as the fibrotic area in the blue zone with a viewpoint of 400× using the Image-pro plus 6.0 image anal-ysis software, and fibrotic areas under five view-points in the border area were averaged (Figure 3).
Discussion
[image:4.612.91.349.256.323.2]lesions and necrosis [10]. These typical pre-sentations can be observed under a mirror. After determining changes in multilocular hydatid cyst 18F-FDG metabolism by PET, Reu- ter [11] found that nidi are relatively stable when radionuclide on the edge of nidus li- quidation zones is reduced; which indicate that the “proliferation and invasion belt” or active zone at the edge of nidi is a key factor for determining the development of nidi. HAE biological activity is enhanced in areas with rich blood supply, which shows a hypermetabo-lism area [12] in the PET image.
PET/CT images have a higher resolution and a distinct anatomic slice compared to CT and MRI. Thus, these images can show the calcification of the liver alveolitoid hydatid wall, as well as nidi locations, size, quantity, morphology and types. In addition, clinical judgments can be made from HAE biological characteristics through the consumption meth-ods and features of positron emitting tracers and the metabolic process of radiopharmaceu-ticals, with unique functional advantages. For HAE, PET/CT can detect the invading parts, forms, quantities and boundaries of nidi, as well as the interior calcification and peripheral tissue conditions of lesions. Furthermore, it can also diagnose the biological activity of HAE in the boundaries through gathering radiopharmaceuticals.
In the present study, a total of 129 patients were enrolled; in which 179 nidi were found, including 71 in the left lobes of liver and 108 in
[image:5.612.92.373.75.223.2]the right lobes of the liver. This can be divided into three models, according to the degree of radioactive con- centration observed around nidi and the measured SUVmax. I-model is a thick radioactive distribution belt. When SUVmax is 8.07 ± 4.40 and radioactive distribution increases after delaying for three hours, the degree of concentration is positively associated with microvessel density. II-model is a thin radioactive distribution belt. When SUVmax is 2.71 ± 0.93, Figure 3. Relationship between the SUVmax value and the area of fibrosis in
the marginal zone.
radioactive distribution does not exhibit any noticeable changes after delaying for three hours and the degree of concentration is not correlated with microvessel density. III-model is a defective radioactive distribution belt. When SUVmax is 1.22 ± 0.17, radioactive distribution decreases after delaying for three hours. Furthermore, when SUVmax value is 0.89 ± 0.07, the degree of concentration does not exhibit any correlation with microvessel densi-ty. Neovascularization is an aspect of cell-medi-ated immune response around parasites, and the essence and existence of the vasculariza-tion state the disease has been verified [13]. In previous studies, Vitton et al. [14] found that the biological behavior of HAE lesion develop-ment and invasion is related to blood vessels. Microvessel density is the gold standard for the evaluation of vascularization, which can reflect HAE biological behaviors. In PET/CT images, fluorodeoxyglucose (FDG) is poured into a microvessel and participates in cell metabolism through blood circulation; and this is shown as a thick annular or block radioactivity belt around nidi. The more inten-sive the blood vessels are, the thicker the radioactive distribution [15, 16].
tissues. It envelops normal liver tissues along the direction of the hepatic sinusoid. The thick-ness of the marginal area shows different widths and densities, while some regions show intensive and dyed collagenous fibers [17].
Neovascularization and fibrosis is one aspect of cell-mediated immune response around HAE, which mainly brings a delayed type of hypersensitivity to the host. Many granulomas of different sizes are formed around the vesi-cae. Small-scale granulomas are mainly single nodes, while large-scale granulomas are made of several nodes; in which a large number of immune cells gather and infiltrate tissues. During this process, neovascularization can be observed, followed by necrosis, fibrillation and calcification [18, 19]. New research results have proposed that cytokine-related genes secreted by alveolar hydatid cysts can promote microvessel growth in surrounding granulation tissues [20, 21]. Therefore, SUVmax in the mar-ginal zone is affected by granulomas of differ-ent sizes around the vesicae [22, 23]. Experimental results have shown that FDG is located in the inflammatory cell infiltration area such as macrophages and monocytes. In addi-tion, the more obvious the inflammatory cell infiltration becomes, the more FDG would accu-mulate [24]. This is due to the fact that active leukocytes and macrophages in inflammation tissues may regard glucose as ability sources for chemotaxis and phagocytosis [25]. Some non-specific inflammations such as eosinophil-ic granuloma consist of a cell nuclei macro-phage. As active glycolysis increases sharply, acetic acid hexose bypass is activated; owing to phagocytosis. Therefore, nidus ingestion of FDG in the active stage may significantly increase [26].
SUVmax in some nidi are very high, and are within the range of 8.07 ± 4.40 for I-model. However, microvessel density counting in CD34 is not high, which indirectly shows that nidus boundaries detected by PET/CT is a biological boundary. SUVmax comprise of neovasculariza-tion density and violaceous granuloma nod-ules, which is a result of the joint action of mac-rophages, granulocytes, lymphocytes, eosino-philic granulocytes and plasmocytes [27]. The aim of this study was to confirm the correlation of AE in the proliferative and non-proliferative phase with 18F-FDG biological boundary, which
was expounded upon the degree of progress of AE nidi; and thus, providing a significant foun-dation for the biological boundary of AE from the perspective of the metabolic activity at the edge of nidi.
Disclosure of conflict of interest
None.
Address correspondence to: Yong-De Qin, Depart- ment of Nuclear Medicine, The First Affiliated Hospital of Xinjiang Medical University, Urumqi 830054, China. Tel: +86 991 4361301; Fax: +86 991 4361301; E-mail: yongdeqincn@126.com
References
[1] Silva MA, Mirza DF, Bramhall SR, Mayer AD, McMaster P, Buckels JA. Treatment of hydatid -disease of the liver. Evaluation of a UK experi -ence. Dig Surg 2004; 21: 227-234.
[2] Parsak CK, Demiryurek HH, Inal M, Sakman G, Koltas IS, Erkocak EU, Korkmaz M, Acarturk TO. Alveolar hydatiddisease: imaging findings and surgical approach. Acta Chir Belg 2007; 107: 572-577.
[3] Gollackner B, Langle F, Aner H, Maier A, Mittlböck M, Agstner I, Karner J, Langer F, Aspöck H, Loidolt H, Rockenschaub S, Steininger R. Radical surgical therapy of ab -dominal cystic hydatid disease: factors of re -currence. World J Surg 2000; 24: 717-721. [4] Reuter S, Nussle K, Kolokythas O, Haug U,
Rieber A, Kern P, Kratzer W. Alveolar liver echi -nococcosis: a comparative study of three im -aging techniques. Infection 2001; 29: 119-125.
[5] Pichler BJ, Kneilling M, Haubner R, Braumüller H, Schwaiger M, Röcken M, Weber WA. Imaging of delayed-type hypersensitivity reaction by PET and 18F-galacto-RGD. J Nucl Med 2005; 46: 184-189.
[6] Reuter S, Buck A, Manfras B, Kratzer W, Seitz HM, Darge K, Reske SN, Kern P. Structured treatment interruption in patients with alveolar echinococcosis. Hepatology 2004; 39: 509-517.
[7] Stumpe KD, Renner-Schneiter EC, Kuenzle AK, et al. F-18-fluoro deoxyglucose (FDG) positron-emission tomography of Echinococcus multi -locularis liver lesions : prospective evaluation of its value for diagnosis and follow up during benzimidazole therapy. Infection 2007; 35: 11-18.
caused by echinococcus granulosus: imaging findings. AJR Am J Roentgenol 2007; 189: 337-43.
[9] Choji K, Fujita N, Chen M, Spiers AS, Morita Y, Shinohara M, Nojima T, Irie G. Alveolar hydatid disease of liver: computed tomography and transabdominal ultrasound with histopatholo-gycal correlation. Clin Radiol 1992; 46: 73-103.
[10] Ito A, Nakao M, Sako Y. Echinococcosis: sero-logical detection of patients and molecular identification of parasites. Future Microbiol 2007; 8: 439-449.
[11] Reuter S, Gruner B, Buck AK, Blumstein N, Kern P, Reske SN. Long-term follow-up of meta -bolic activity in human alveolar echinococcosis using FDG-PET. Nuklearmedizin 2008; 47: 147-152.
[12] Czermak BV, Akhan O, Hiemetzberger R, Zelger B, Vogel W, Jaschke W, Rieger M, Kim SY, Lim JH. Echinococcosis of the liver. Abdom Imaging 2008; 33: 133-143.
[13] Pichler BJ, Kneilling M, Haubner R, Braumüller H, Schwaiger M, Röcken M, Weber WA. Imaging of delayed-type hypersensitivity reaction by PET and 18F-galacto-RGD. J Nucl Med 2005; 46: 184-189.
[14] Vitton DA, Gottstein B. Echinococcus multiocu -laris and its intermediate host: a model of par -asite-host interplay. J Biomed Biotechnol 2010; 23: 134-147.
[15] Caoduro C, Porot C, Vuitton DA, Bresson-Hadni S, Grenouillet F, Richou C, Boulahdour H, Blagosklonov O. The role of delayed 18F-FDG PET imaging in the follow-up of patients with alveolar echinococcosis. J Nucl Med 2013; 54: 358-63.
[16] Parsak CK, Demiryurek HH, Inal M, Sakman G, Koltas IS, Erkocak EU, Korkmaz M, Acarturk TO. Alveolar hydatid disease: imaging findings and surgical approach. Acta Chir Belg 2007; 107: 572-577.
[17] Bresson-Hadnis S, Vuitton DA, Bartholomot B, Heyd B, Godart D, Meyer JP, Hrusovsky S, Becker MC, Mantion G, Lenys D, Miguet JP. A twenty-year history of alveolar echinococcosis: analysis of a series of 117 patients from east -ern France. Eur J Gastroenterol Hepatol 2000; 12: 327-336.
[18] Koinuma M, Ohashi I, Hanafusa K, Shibuya H. Apparent diffusion coefficient measurements with diffusion-weighted magnetic resonance imaging for evaluation of hepatic fibrosis. J Magn Reson Imaging 2005; 22: 80-85. [19] Charbonnet P, Buhler L, Sagnak E, Villiger P,
Morel P, Mentha G. Long-term follow up of pa -tients with alveolar echinococcosis. Ann Chir 2004; 129: 337-342.
[20] Elsebaie SB, El-Sebae MM, Esmat ME, et al. Modified endocystectomy Versus pericystecto -my in Echinococcus granulosus liver cysta:a randomized controlled study and the role of specific anti-hydatid IgG4 in detection of early recurrence. J Egypt Soc Parasitol 2006; 36: 993-1006.
[21] Bauder B, Auer H, Schilcher F, Gabler C, Romig T, Bilger B, Aspöck H. Experimental investiga-tions on the B and T cell immune Response in primary Alveolar echinococcosis. Immunol 1999; 21: 409-421.
[22] Zhang L, Zhang SJ, Cao YW, Wu XW, Peng XY, Yang HQ, Sun H. The correlation be- tween osteopontin and metastasis of hepatic Echinococcus multilocularis infection. Chin J Parasitol Parasit Dis 2011; 29: 33-36. [23] Silva MA, Mirza DF, Bramhall SR, Mayer AD,
McMaster P, Buckels JA. Treatment of hydatid disease of the liver. Evaluation of a UK experi -ence. Dig Surg 2004; 21: 227-234.
[24] Bostanci B, Tetik C, Terzi C, Ozden A. Efficiency of ultrasound in the de-tection of the viability of hydatid cysts in the liver. Surg Laoarose Percutan Tech 1999; 9: 392-394.
[25] Lobe JM, Engelstad B. Giant cell arteritis re-vealed by positron emission tomography. Arthritis Rheum 2006; 54: 1710.
[26] Tawakol A, Migrino RQ, Hoffmann U, Abbara S, Houser S, Gewirtz H, Muller JE, Brady TJ, Fischman AJ. Noninvasive in vivo measure-ment of vascular inflammation with F-18 fluo -rodeoxyglucose positron emission tomography. J Nucl Cardiol 2005; 12: 294-301.