Morphometric analysis of slipface processes of an aeolian
dune: Implications for grain-flow dynamics
C A R I N C O R N W A L L * , D E R E K W . T . J A C K S O N * , M A R Y C . B O U R K E†‡ and J . A N D R E W G . C O O P E R *§
*School of Environmental Science, University of Ulster, Coleraine BT52 1SA, UK (E-mail: [email protected])
†Department of Geography, Trinity College Dublin, Dublin 2.
‡Discipline of Geological Sciences, University of KwaZulu-Natal, Private Bag X 54001, Durban 4000, South Africa
§Geological Sciences, School of Agricultural, Earth and Environmental Sciences, University of KwaZulu-Natal, Durban 4041, South Africa
Associate Editor – Charlie Bristow
ABSTRACT
Grain flows are an integral part of sand dune migration; they are a direct response to the local wind regime and reflect complex interactions between localized over-steepening of a dune slipface and complex turbulent airflow on the lee slope. Grain flows are primarily responsible for delivering sedi-ment to the base of a dune, thus driving slipface advancesedi-ment; yet, there are few constraints on their morphological and spatial characteristics or the amount of sediment that is redistributed by these flows. Using a combination of high-resolution terrestrial laser scanning and video recordings, four dis-tinct grain-flow types are identified based on morphology and area on a dune slipface. Grain-flow morphologies range from small, superficial flows to lar-ger flows that affect greater portions of the slipface, moving significant amounts of sediment. Detailed field observations are presented of the dynamics of lee slopes, including measurements of the initiation location, thickness, magnitude and frequency statistics of grain flows, as well as volume estimates of redistributed sediment for each grain flow observed. High-resolution laser scans enable accurate quantification of bulk sediment transfer from individual grain flows and can be used to study grain flows in a variety of environments. A categorization of grain-flow morphologies is presented that links styles of flows with wind strength and direction, turbu-lent airflow, sediment deposition and environment.
Keywords Aeolian, avalanche, dune migration, grain flows, sediment transport, slipface dynamics.
INTRODUCTION
Grain flows, or avalanching, on aeolian dunes is an essential process in dune migration. The migration of dunes is largely accomplished via a cycle involving the occurrence of a grain flow that redistributes sediment downslope on the lee slope, advancing the slipface locally. Grain-flow activity is followed by the restoration of the
slope from grain-fall deposition and grain salta-tion over the brink whereupon another grain flow may take place (e.g. Bagnold, 1941; Allen, 1970; Hunter, 1977, 1985; Anderson, 1988; McDonald & Anderson, 1995; Koket al., 2012). Grain flows have been the focus of many studies including in situ observations of active dunes, interpreta-tions of flow signatures and paleoenvironments in aeolianites, wind tunnel experiments, and
1
numerical modelling approaches. Despite these studies, there is still a lack of knowledge regard-ing grain-flow formation, initiation, magnitude, flow morphologies, and behaviour under a vari-ety of wind conditions and environments (e.g. Walker, 1999, 2000; Cupp et al., 2005; Breton et al., 2008; Sutton et al., 2013a; Nield et al., 2017). There is a need for additional field obser-vations, wind tunnel experimentation, and numerical modelling over a wide range of aeo-lian settings and dune morphologies, as well as a classification system of grain flows to begin con-straining spatial, morphological and dynamic characteristics of grain flows. This study presents the foundation of a classification system which can be used by future studies to describe grain-flow attributes observed in the field or during wind tunnel experiments and can also be used to compare grain-flow behaviour between a variety of environments.
Grain-flow formation
The frequency of grain flows is thought to be dependent on factors such as the depositional rate (correlated to wind velocity) and sediment characteristics or environmental conditions which may affect grain movement or angle of repose (e.g. Allen, 1968, 1970; Sweet & Kocurek,1990; McDonald & Anderson, 1992, 1995; Nickling et al., 2002; Cupp et al., 2005; Breton et al., 2008; Sutton, 2012; Sutton et al., 2013a,b; Pelletieret al., 2015; Nieldet al., 2017). However, the mechanism of formation and initia-tion of grain flows is more complex. Grain flows have been observed to be triggered by a localized over-steepening of the slipface slope near the dune brink where saltating grains are transported from the stoss slope onto the lee slope tens of centimetres below the brink (e.g. Allen, 1968, 1970; Borowka, 1979; Hunter, 1985; Anderson, 1988; Nickling et al., 2002; Walker & Nickling, 2002; Cupp et al., 2005; Kok et al., 2012; Sutton et al., 2013a,b). This process continues to form a bulge of sediment until it reaches the angle of initial yield (or exceeds the angle of repose of the sediment) and then fails. Failure occurs near the lower inflection point of the sediment bulge from which a tongue of sediment subsequently flows downslope (e.g. McDonald & Anderson, 1992, 1995; Tischler et al., 2001; Cupp et al., 2005; Dasgupta & Manna, 2011; Sutton, 2012; Sutton et al., 2013a,b; Nieldet al., 2017). As sediment is removed, a scarp forms and simultaneously migrates upslope, spreading laterally (e.g.
Hunter, 1977; Fryberger & Schenk, 1981). The resulting morphology is that of an alcove or zone of depletion just below the dune brink and a tongue of sediment or zone of accumulation directly downslope of the alcove (Sutton, 2012; Suttonet al., 2013a,b).
An alternative grain-flow mechanism was described by Fryberger & Schenk (1981) from wind tunnel experiments. These authors charac-terized two mechanisms of grain flow including scarp recession [originally described by Hunter (1977) and related to the formation of an alcove detailed above] and slump degeneration. Fry-berger & Schenk (1981) observed that slump degeneration was the most common mechanism during their experiments. Each slump began as a series of tensional features near the top of the artificial slipface. The flow progressed with com-pressional features (folds) forming in places where the sediment slowed and overrode other parts of the flow. The resulting ‘slump sheet’ produced minor deformational structures in cross-section suggesting cohesive sand, although the cause of cohesion in the dry sand was never discovered. Sutton et al. (2013b) applied the term slump degeneration to a small non-cohe-sive slab (100 to 400 cm2) which disintegrated after flowing a few centimetres downslope.
Grain-flow initiation
base of the slipface. Additionally, the upper-mid slope is also known to be the location where finer, suspended particles from the sediment cloud launched from the dune brink accumu-late, creating a potential secondary location for localized over-steepening and grain flow (McDonald & Anderson, 1992, 1995, 1996; Nick-ling et al., 2002; Nield et al., 2017). However, the possible influence of a ‘lock up zone’ or sus-pended sediment settling mid slope and the occurrence of smaller grain flows was not made in Breton et al. (2008), potentially suggesting that destabilization from larger grain flows may be an additional grain-flow trigger. There also remains the possibility that the slipface slope is more easily destabilized by primary flows due to the accumulation of sediment from a ‘lock up zone’ or mid-slope particle settling.
More recently, the exploration of complex air-flow patterns in the lee side of aeolian dunes using high resolution computational modelling has suggested a possible role for turbulent winds disturbing areas of the slipface and increasing the potential to trigger grain flow. For example, sec-ondary lee slope flow patterns generated by flow separation at the dune crest and the subsequent reattachment flow have been observed to produce complex eddies and vortices (Parsons et al., 2004a,b; Jackson et al., 2013a,b; Pelletier et al., 2015; Smithet al., 2017a). While the role of these complex airflow patterns in sediment transport on the lee side of a dune is not well-understood, they may have a significant localized effect on surface shear stress, resulting in sediment redis-tribution (e.g. Wiggs, 2001; Nicklinget al., 2002; Walker & Nickling, 2002; Cuppet al., 2005). Pel-letieret al.(2015) demonstrated that the angle of initial yield can decrease with increasing wind velocities, leading to grain flows at lower critical angles than otherwise possible, and another study noted that oblique incident airflow can result in deflected lee-flow, which promotes lateral trans-port of sediment on a slipface (Walker, 1999). Research is ongoing in the investigation on how lee slope airflow patterns potentially affect sur-face shear stress and sediment transport, and may be useful in distinguishing various grain-flow for-mation mechanisms.
Grain-flow magnitude
Grain-flow magnitude is under debate in the aeo-lian community. There is a dearth of information related to grain-flow surface area as well as flow thickness. Previous studies have discounted a
connection between sediment flux (wind velocity) and grain-flow magnitude where only a relation-ship between grain-flow frequency and sediment flux was observed (McDonald & Anderson, 1995; Cupp et al., 2005; Breton et al., 2008; Sutton, 2012; Suttonet al., 2013a,b; Pelletieret al., 2015). In contrast, Nield et al. (2017) argued that there was a correlation between grain-flow frequency as well as magnitude with greater wind velocity, where weaker winds produced smaller grain flows near the dune brink and stronger winds triggered avalanches further downslope resulting in more sediment being mobilized upslope. Additional field observations are needed to resolve the incon-sistency of the relationship between wind velocity and grain-flow magnitude and frequency.
Related to the topic of grain-flow magnitude and the formation mechanism of large grain flows is the hypothesis that grain-flow thickness directly correlates with dune height. This rela-tionship has been used to estimate palaeo dune heights from aeolianite deposits (e.g. Kocurek & Dott, 1981; Sweet et al., 1988; Kocurek, 1991) but it has not been tested extensively with mod-ern day field observations of grain-flow thick-nesses involving a variety of dune heights and morphologies. Field observations have been made of thick, large areal extent grain flows (e.g. McDonald & Anderson, 1995; Nickling et al., 2002; Breton et al., 2008) but what triggers these flows and an exact definition of what qualifies as ‘large’ have not yet been determined.
There is a possibility that the formation of large (or thicker) grain flows is not entirely con-trolled by dune height and may be influenced by environmental conditions or involve an alter-native formative mechanism (e.g. McDonald & Anderson, 1995). For example, the expansion of sediment suspension and saltation trajectories on the slipface during high velocity winds was observed to transform the localized bulge of sed-iment near the dune brink into a large wedge of sediment, and accumulate more sediment mid slope resulting in much larger grain flows on dunes (e.g. Nickling et al., 2002; Cupp et al., 2005; Nield et al., 2017). It has also been sug-gested that larger grain flows on dunes may increase in thickness and areal extent if sedi-ment is entrained from the disruption of unsta-ble grains deposited in the ‘lock up zone’ mid slope (e.g. McDonald & Anderson, 1992, 1995, 1996; Nickling et al., 2002). Both examples of high-magnitude grain flows occur on large dunes but the specific relationship between height and flow thickness has not been constrained.
Grain-flow classification
Descriptions of variations in grain-flow plan-form morphology are extremely scarce in the literature; however, they may be the key to con-solidating knowledge of grain-flow dynamics across a wide range of aeolian settings. With the growing literature and interest by research-ers in slipface processes, there is now a need to provide a structure to support discrete observa-tions of grain flows between different aeolian environments. Grain flows probably operate on a dynamic continuum, meaning that similar for-mation mechanisms and morphologies exist over a wide range of aeolian environments. Dif-fering grain-flow morphologies and magnitudes may indicate failure mechanisms due to the influence of the local wind regime, turbulent wind patterns on the lee slope, grain character-istics, or other environmental factors such as presence of salts or liquid/frozen water. There-fore, a classification of grain-flow types based on surface area and planform shape is useful for comparative studies across a range of aeo-lian environments.
The classification for grain flows introduced in this paper aims to quantify their morphomet-ric characteristics. It builds upon previous work but is based on new observations of formation patterns and morphology. It is not intended to be exhaustive and is flexible to future expansion with the potential for additional grain-flow morphologies from different wind regimes and climatic environments.
[image:4.595.60.536.384.641.2]This study constrains grain-flow thickness using sub-millimetre resolution three-dimen-sional laser scans along with simultaneous video documentation. This allows better estimates of the volume of redistributed sediment for each grain-flow morphology. In addition, there is a need to undertake further work to distinguish the controls on the specific styles of flows so that classification can be usefully linked to con-trolling parameters from environmental factors, such as climate and wind regime, to more detailed secondary airflow patterns as well as influences from physical grain characteristics and dune morphology. Further work in these areas would benefit the interpretation of aeolian deposits (e.g. McKee et al., 1971; McKee &
Bigarella, 1972; Morris et al., 1972; Bigarella, 1975; Hunter, 1977; Borowka, 1979; Fryberger & Schenk, 1981; Sweet & Kocurek, 1990; Bourke, 2005; Anderson & Walker, 2006) and further elu-cidate paleoenvironments of aeolianites (e.g. Kocurek & Dott, 1981; Sweet et al., 1988; Kocurek, 1991; Eastwoodet al., 2012).
DATA AND ANALYSIS TECHNIQUES
Field location and sediment characteristics
The study site is in the central region of the Maspalomas dune field, which has a total area of about 4 km2 and is situated on the southern end of Gran Canaria island, Spain (Fig. 1; Her-nandez et al., 2017). All observations collected took place ca 500 m inland from the ocean at 27°440412″N, 15°340238″W on a large transverse dune. The dune field is comprised of several large transverse dunes, decreasing in size and transitioning to a mixture of small transverse and barchanoid dune shapes to the east. This dune field was chosen because of the arid cli-mate, where the annual precipitation is <100 mm year1 (Marzol, 1987), resulting in sparse vegetation, and regular aeolian activity, thus making it a suitable field site for dune mor-phodynamic studies. Observations were col-lected on 8 December 2014, during the winter season when the eastern and north-eastern winds are the strongest and have the most influ-ence on dune migration (Hernandezet al., 2002; Jackson et al., 2013b; Hernandez et al., 2014; Smithet al., 2017b).
Meteorological data was retrieved from a weather station located approximately 25 km south-west of the study site (27°440090″N, 15°350452″W). Between 10:04 am and 12:50 pm (Western European Time Zone) on 8 December 2014, during the time of field observation, the Maspalomas weather station recorded an average temperature of 21°C, humidity levels around 52%, and wind fromca 55° (north-east) with an average wind velocity at 1 m height of 951 m sec1 (009 m sec1) and a maximum gust speed of 2314 m sec1.
Sediments in the Maspalomas dune field are composed of a mixture of calcium carbonate/bio-genic marine materials (Alcantara-Carrio, 1998; Hernandez et al., 2002) and phonolitic rocks weathered from the island volcanic deposits (Martinez, 1986) with an average grain size of 220lm (Alcantara-Carrio, 1998). Although a
compositional analysis was not conducted on the sediment at the study site, components of both carbonate/biogenic marine materials and volcanic deposits were recognized in the sedi-ment samples. The darker, volcanically-derived sediments were easily distinguished from the carbonate marine materials due to aeolian sort-ing effects, where the volcanic sediments con-centrated on ripples and were frequently observed coalescing along the edges of an active grain flow. Six sediment samples were collected at the study site, including the surface of the lower stoss slope, mid stoss, crest, mid lee, lower lee slope and interdune, and measured by laser diffraction. An average grain size of 244 lm was measured for the entire sand dune (excluding the interdune) and is consistent with the grain-size analysis reported by Alcantara-Carrio (1998).
Larger grains were present on the stoss slope, with a 50th percentile of 304lm on the lower stoss slope and 218 lm mid stoss. The range of grain sizes for the lower and mid stoss slope was between 86 to 756 lm and 76 to 516lm, respectively. The 50th percentile for grains col-lected from the dune crest was 254lm with a range of 98 to 586 lm. The 50th percentiles for the mid lee slope and lower lee slope were 214 lm and 229lm, respectively, and had iden-tical grain-size ranges between 76 lm and 516 lm. Lastly, the 50th percentile for interdune sediment was 194lm, ranging between 14 lm and 516 lm grain sizes. These grain sizes do not include any salt component because the laser diffraction measurements were conducted in water, thereby dissolving any salt component. Water and salt weight percentages of each sedi-ment sample were calculated by weighing sam-ples before and after overnight drying took place in an oven and prior to laser diffraction mea-surements. These percentages were calculated to investigate any potential influences of moisture on grain-flow formation.
Particle-size distribution was investigated prior to laser diffraction measurements to identify a potential salt component in the sediment sam-ples. Sample splitting was conducted followed by standard sieve analysis using a series of nested sieves with quarter phi set. Salt was easily identi-fied in all of the sediment samples after sieving took place because salt entirely comprised grain sizes <100lm. The weight percentages for salt presented here are likely to be an underestimate depending on how much salt was dislodged from sand grains during the sieving process. There was
no detectable amount of moisture in the sedi-ments collected on the dune but there was a small amount of salt, ranging from 07% weight near the crest to 34% weight near the base of the slip-face. The interdune sediment sample contained about 26% water weight with 162% weight salt. Knowledge of water and salt components in the sediment may be useful for future studies con-ducting similar grain-flow observations under dif-fering environmental conditions and a better understanding of the relationship between mois-ture and grain-flow styles may be formulated.
Slipface observations
Data collection included a series of ground-based laser scans, video recordings and images taken on a portion of a slipface of a large, trans-verse dune (Fig. 1; located at 27°440412″N, 15°340238″W). Twenty five consecutive laser scans of the slipface began at 10:00 am and con-tinued until 12:50 pm using a FARO Focus 3D X 330 terrestrial laser scanner with a laser beam wavelength of 1550 nm (FARO, Lake Mary, FL, USA). Simultaneous video recording occurred between 9:55 am and 11:20 am. Observations were collected during this time of day when winds were the strongest and most consistent, and there were no periods of calm or inactivity in sediment transport.
The FARO Focus 3D X 330 is designed to cap-ture fast and accurate measurements of complex objects or buildings, making it ideal for record-ing detailed measurements of grain flows in the
field. The scanner is calibrated yearly to guaran-tee accuracy and precision, minimizing data error from the electronic, distance, intensity, temperature and angular sensors and inclinome-ter. The FARO Focus 3D X 330 has a scan range distance between 06 mm and 330 m with a ranging error of 2 mm at 10 m and a ranging noise error at this distance of 03 mm with 90% reflectance and 04 mm with 10% reflectance. These error and noise estimates increase at greater distances. The measurements collected in this study were about 15 m from the lee slope, well within the 10 m distance for the above-mentioned error estimates, and were col-lected at full resolution (061 mm m1, or about 160 000 points per degree), producing a high-density point cloud totalling approximately 286 million data points.
[image:6.595.58.369.487.715.2]The study site dune had a height of approxi-mately 962 m and a lee slope of 3104°, as mea-sured by the ground-based, high-resolution laser scanner. A 5 m span of the slipface, directly in front of the TLS (terrestrial laser scanner) is where the highest resolution observations were recorded is referred to here as the ‘main slipface’ (Fig. 2). The main slipface was intersected per-pendicularly by a larger dune form (Fig. 1), resulting in a smaller portion of the slipface being exposed. This exposed portion had a slip-face height of 22 m and a slope of 3215°. Laser scan data were used primarily to quantify change on the slipface slope and observations were set to record a 180° view approximately 15 m from the base to the slipface, thereby
capturing the entire 22 m high main slipface section as well as portions of the larger 962 m high slipface. Three target boards were placed around the study site and real time kinematic (RTK) Global Positioning System (GPS) points were taken of each target location to allow for accurate spatial comparisons between each laser scan. Laser scans were taken at 8 min intervals from 10:00 am to 12:00 pm at full resolution. Between 12:00 pm and 1:00 pm the scan fre-quency was increased to 4 min intervals, whilst retaining the resolution. Video footage and images of the lee slopes were taken concurrently with the laser scans between 9:55 am to 10:21 am, 10:40 am to 11:00 am and 11:14 am to 11:20 am using an iPadTM (Apple, Cupertino, CA, USA) with 1080p HD video recording at 30 frames per second and 8-megapixel photo-graphs.
Post-processing of the laser scans involved fil-tering the data using FARO SCENE software (FARO Technologies UK Ltd, Warwickshire, UK). The filters applied to each individual scan included a dark scan points filter, a distance fil-ter and a stray filfil-ter. Each of these filfil-ters mini-mized noise and eliminated erroneous data points that can be common in laser scan data. The dark scan points filter is defined by a reflec-tance threshold where dark points (having weak signals and low accuracy) below the defined threshold value are removed. The distance filter can be specified for any distance and points greater than that distance are deleted. This filter was useful for minimizing noise from particles, such as airborne sediment. Lastly, the stray filter removed edge effects and other outliers from the dataset.
Grain-flow morphologies and volume estimates
Four types of grain flows were identified in this study; they were classified using their sur-face area of grain flow and planform shape. All calculations of area and volume estimates were conducted using ground-based laser scan data registered with RTK GPS points. Volume esti-mates were determined using the polygonal area of redistributed sediment on the slipface in Esri ArcMap and measurements of grain-flow thicknesses were collected using SCENE software.
Despite having high resolution scans of grain flows, deriving volume estimates of sediment from some individual flows proved difficult and
unreliable, primarily due to the amount of noise from airborne sediment and secondarily due to the highly dynamic nature of the slipface. Noise from airborne sediment increased upslope near the brink, complicating the delineation of sur-face points and laser points bouncing off the sediment cloud. Removing the sediment cloud left behind small ‘shadow zones’ on the upper slopes of the slipface, where the laser could not penetrate to the surface. These occluded survey locations precluded an accurate area measure-ment of grain-flow areas using software tech-niques but their extent was otherwise easily discerned by an observer.
In cases where noise from airborne sediment was more subdued, another difficulty arose due to the time lapse between scans. Ideally, a vol-ume estimate of redistributed sediment from a single grain flow could be derived if a previous scan recorded an undisturbed slipface surface prior to a grain-flow event. However, it was rare that each grain flow that was scanned had a pre-vious scan of the same area undisturbed prior to the flow. Smaller grain flows occurred every 30 sec across the entire slipface and larger grain flows occurred every 2 to 3 min. Laser scans in this study recorded a 180° view every 4 to 8 min making it difficult to capture the ideal conditions for a reliable volume estimate of each individual grain flow.
Therefore, a modified formula of a wedge was used to approximate the shape of the grain flows and estimate the volume of sediment displaced for each grain flow. A wedge is used to approxi-mate the thickening of grain flows downslope from their initiation point and is represented by the following formula:
V ¼1 2
bh 6ð2aþcÞ
where b is twice the thickness of the grain flow at the base of the grain flow, h is the height of the grain flow normal to the dune substrate, a is the width of the base of the grain flow, and c is the width of the grain flow near the initia-tion point (Fig. 2). Height is calculated by tak-ing the sine of slipface slope angle (3212°), multiplied by the length of the grain flow on the slipface surface. The volume of the wedge is halved to approximate a single side of the wedge, representing the grain-flow level with the slipface surface. For each grain flow, flow thicknesses were measured in three locations
along the edge of the flow, including
Table 1. Grain-flow measurements including the initiation point, dimensions of the flows, and estimates of grain-flow area and volume of redistributed sediment for each morphology. Measurements are given in centimetre units. Morphologies marked with an asterisk ( * ) indicate grain flows that occurred on the main slipface shown in Figs 3, 4 and 5. Some initiation point measurements for hourglass grain flows could not be measured due to noise from airborne sediment or inadequate video coverage. Failure number Morphology Initiation point Initiation point grain-flow thickness Midpoint grain-flow thickness Base grain-flow thickness Grain-flow length
Initiation
point
grain-flow width Base grain-flow width Approximate area Estimated grain-flow volume
Table 1. (continued). Failure number Morphology Initiation point Initiation point grain-flow thickness Midpoint grain-flow thickness Base grain-flow thickness Grain-flow length
Initiation
point
grain-flow width Base grain-flow width Approximate area Estimated grain-flow volume
37 Funnel 47 7 0 8 1 53 9 549 04 11 4 6 155 9 6386 1 38 Funnel 172 7 0 4 0 30 6 232 93 01 4 1 195 5 373 7 39 Lobe 150 00 82 01 2 104 18 01 5 4 427 1 411 9 40 Lobe 164 41 11 31 8 142 24 5 31 8 3 692 0 1828 6 41 Lobe * 223 30 20 81 2 185 82 4 43 5 7 1762 7 1861 0 42 Lobe * 177 60 10 51 5 205 23 2 14 0 9 2232 2 3087 4 43 Lobe 300 70 60 70 9 195 22 9 23 1 2 1617 2 1488 7 44 Lobe * 95 80 10 61 4 313 11 5 05 6 8 4729 3 5069 9 45 Lobe * 29 60 10 21 0 200 43 5 51 9 1 1019 4 1257 9 46 Lobe 541 40 20 50 5 415 62 0 74 7 9 5297 7 2318 1 47 Lobe 737 40 93 01 7 148 75 3 76 7 1 9978 9 4211 3 48 Lobe 299 30 10 50 1 306 82 0 85 9 6 4865 8 457 0 49 Lobe 259 60 80 91 1 281 21 6 53 7 9 2837 7 2418 6 50 Lobe 214 80 40 81 2 306 23 2 73 4 5 1 0 564 9 3341 9 51 Lobe 359 30 20 81 0 215 43 83 1 7 1818 3 1284 7 52 Lobe * 156 70 70 30 2 162 91 2 73 2 4 1403 5 212 6 53 Lobe * 84 20 10 20 9 102 72 51 9 6 535 4 334 0 54 Lobe * 110 80 60 60 3 162 61 1 73 8 1 1647 8 354 6 55 Lobe 153 80 10 50 7 301 41 81 3 1 1052 8 525 5 56 Lobe 185 20 10 40 1 210 91 15 1 2 2874 0 124 0 57 Lobe 79 10 10 81 1 337 42 64 7 3 4246 4 3198 6 58 Lobe * 68 50 20 70 5 269 51 04 4 4 3184 1 965 8 59 Lobe 234 81 92 13 5 207 81 0 13 4 4 1902 9 5091 0 60 Lobe * 128 90 10 20 1 238 28 54 0 4 2558 8 188 5 61 Lobe 232 50 11 02 4 205 81 3 32 5 5 1397 6 2819 5 62 Lobe 325 30 20 40 9 112 02 0 34 0 3 1199 9 921 1 63 Lobe 144 80 10 60 9 305 21 7 63 5 8 2908 0 2075 9 64 Lobe 225 90 21 82 4 271 11 9 33 0 5 2201 1 4714 9 65 Slab 5 10 81 11 2 615 5 568 3 568 3 349 782 5 113 511 4 66 Slab 4 80 10 11 4 663 8 439 8 439 8 291 979 0 108 733 0 67 Slab 5 80 70 80 7 826 7 677 7 677 7 560 223 0 107 293 9 68 Slab 5 40 30 50 9 715 9 688 8 688 8 493 112 5 118 051 1 69 Slab 6 70 21 05 5 693 3 549 4 549 4 380 941 8 559 344 5 70 Slab * 2 71 31 41 9 408 3 516 3 516 3 210 779 7 103 724 7 71 Slab 5 00 50 70 9 867 9 789 9 789 9 685 563 7 164 123 9
[image:9.595.101.533.60.721.2]immediately below the initiation point, midway down the flow, and at the base (source sink) of the grain flow (Table 1) to ensure that there was a gradual thickening of sediment, as assumed by the wedge formula. These measure-ments do not account for any potential concav-ity of the underside of the grain flow and only include areas of redistributed sediment, exclud-ing other features associated with the flow such as alcoves and incised ‘channels’ upslope of the grain-flow deposit.
An attempt was made to test the accuracy of the wedge formula by restoring a small portion of the slipface with a recent grain flow to pre-grain-flow conditions from a single laser scan. The grain flow selected from the scan data (#15, Table 1) had lower amounts of noise to reduce error in vol-ume calculation. To restore the slipface, the data points containing the grain flow were removed, leaving the surrounding, undisturbed slipface on either side of the flow. The remaining data points were used to interpolate the surface prior to the flow event. Volume was then calculated by sub-tracting the interpolated slipface surface from the surface with the grain flow.
The calculated volume using an interpolated surface of grain flow #15 was approximately 4348 cm3, where the wedge method estimated a volume of 5398 cm3(Table 1). It is likely that the
volume estimates using an interpolated surface are underestimates, especially higher upslope where the grain flow cut into the slipface below the alcove. Any redistributed sediment deposited
below the interpolated surface was calculated as negative volume. The volume calculations using the wedge formula include all redistributed sedi-ment from a grain flow, including sedisedi-ment deposited where the grain flow cut into the slope. Considering the uncertainty introduced in restoring the slipface via interpolation and how redistributed sediment volume was calculated, these two estimates appear to agree well.
Locations of grain-flow initiation were pri-marily isolated through GPS-registered laser scans. In cases where high levels of noise were present, the grain-flow initiation point was approximated using still frame images from video recordings using the GPS-registered target boards to constrain location (Table 1). Airborne
sediment ejected from the dune brink
introduced significant amounts of noise at the top of the slipface in the laser scans and entirely obscured approximately 10 to 20 cm of the lee slope just below the brink. Therefore, grain flows that initiated near the brink were measured in ArcMap using images captured from video. A few grain flows reported in Table 1 do not include an initiation point because the laser scan captured the grain flow after the alcove had already formed, making it difficult to estimate the exact initiation point, and there was no concurrent video record to indicate the exact location of initiation.
[image:10.595.141.453.477.643.2]Lastly, overall horizontal slipface advance-ment was approximated using two laser scans 92 min apart. The horizontal change (slipface
advancement) was determined by taking the difference of the two laser scans in ArcMap GIS, imported with 1 cm gridding. This pro-vided a visual representation and quantified slipface advancement during observation.
RESULTS
Grain-flow morphology
Grain flows displayed a variety of morphologies during observation in the Maspalomas dune field (Figs 3, 4 and 5). Previous, grain-flow clas-sifications have broadly separated ‘primary’ and ‘secondary’ flows (Breton et al., 2008). The dis-tinction focused on potential triggers of grain-flow activity but did not distinguish between differences in morphology and respective
sediment loads. Initiation of primary flows is attributed to the accumulation and destabiliza-tion of a sediment bulge centimetres below the dune brink on the slipface. Secondary flows are generally smaller and thought to be initiated in response to disturbances from primary flow activity.
[image:11.595.141.450.61.169.2]The basic distinction between ‘primary’ and ‘secondary’ flows (Breton et al., 2008) is retained in this paper but is extended by identifying sub-sets of flow features with morphological descrip-tions and quantifying sediment redistribution volumes for each. New terminology (‘hourglass’, ‘slab’, ‘lobe’ and ‘funnel’ flows) is introduced to further distinguish different flow types based on morphology. A total of 71 grain-flow events were captured during laser scanning and approxi-mately 30 of these were also recorded on video. For each grain-flow type, the location of flow
Fig. 4. An example of a ‘slab’ flow in the Maspalomas dune field, Gran Canaria, Spain. These flows begin with the appearance of horizontal tensional cracks in close proximity and parallel to the dune brink (emphasized by arrows on the left). Sediment is mobilized shortly after tensional cracks appear (right). Time progression between the left and right images is approximately 5 sec. The checkered A4 paper (2109297 mm) on the target board at the crest of the dune was used for GPS registration and can be used for background scale of the slipface. A fore-ground scale is provided in the lower right-hand corner. Slipface height is approximately 22 m.
Fig. 5. Examples of ‘lobe’ (left) and ‘funnel’ (right) flows from the Maspalomas dune field in Gran Canaria, Spain. These smaller grain flows occurred shortly before or after larger grain flows. These flows commonly occurred in clusters (multiple flow initiations seconds apart) but also occurred one at a time. In a few cases, ‘lobes’ and ‘fun-nels’ occurred together. The ‘lobes’ on the left formed seconds apart. Similarly, the two ‘funnel’ flows on the left also formed seconds apart. The checkered A4 paper (2109297 mm) on the target board at the crest of the dune was used for GPS registration and can be used for background scale of the slipface. A foreground scale is provided in the lower right-hand corner. Slipface height is approximately 22 m.
[image:11.595.141.451.262.383.2]initiation, areal extent, grain-flow thickness, and volume estimates of redistributed sediment are quantified and discussed.
Hourglass grain flows
Sediment flows observed in wind tunnel experi-ments and field observations display a localized over-steepening of the slipface from the forma-tion of a sediment ‘bulge’ a short distance from the dune brink due to an accumulation of sedi-ment by grain fall, saltation and reptation (e.g. Bagnold, 1941; Allen, 1968, 1970; Hunter, 1985; Anderson, 1988; McDonald & Anderson, 1995; Nickling et al., 2002; Cupp et al., 2005; Sutton, 2012; Sutton et al., 2013a,b). The subsequent
initiation of the grain flow results in the forma-tion of an alcove via scarp recession just below the crest that spreads upward and expands later-ally (Lindsay, 1973; Hunter, 1977; Sutton, 2012; Sutton et al., 2013b). The alcove grows as sedi-ment flows downslope, and forms a bottleneck at the point of steepest gradient on the slipface (Anderson, 1988), then the sediment accumu-lates as a fan at the base of the lee slope. In this study, these types of previously observed sedi-ment flows are referred to as ‘hourglass’ grain flows based on their morphology (Figs 3 and 6); they are considered a type of primary grain flow because they are a direct response to localized slope steepening, independent of other grain-flow activity.
The ‘hourglass’ morphology occurred fre-quently at the Maspalomas study site and tended to move moderate amounts of sediment, relative to ‘lobes’, ‘funnels’ and ‘slab’ grain flows. The 28 ‘hourglass’ flows recorded affected areas between 4352 cm2 and 23 624 cm2 on the slipface, aver-aging 10 979 cm2 (Table 1). The point of failure of the grain flow ranged between 27 cm and 36 cm downslope from the brink, consistent with previous studies (e.g. Anderson, 1988; Nickling et al., 2002; Breton et al., 2008). Grain-flow thicknesses ranged from ca 01 to 80 cm with an average thickness of 143 cm. The aver-age estimated volume of redistributed sediment from these ‘hourglass’ flows per flow event was approximately 22 494 cm3, ranging between 582 cm3(a grain flow in progress) to 85 891 cm3.
Slab grain flows
Larger grain flows have been mentioned in pre-vious work as ‘large area extent’ grain flows (e.g. McDonald & Anderson, 1995; Nickling et al., 2002; Breton et al., 2008) but these grain flows have not been rigorously studied. In the absence of a clear description of trigger mechanisms or spatial or temporal quantifiers (for example, esti-mates of area dimensions, formation frequency and flow duration), ‘slab’ flows might be one of these ‘large areal extent’ flows or a new type of large primary grain flow. In this study, ‘slab’ flows, affected large areas of the slipface, rang-ing from 210 779 to 685 563 cm2, and each mobilized a large volume of sediment that suc-cessfully reached the base of the slipface in one episode. The initiation point of these grain flows was first visible in the form of uneven horizontal tensional cracks appearing at variable distances parallel to the brink (Figs 4 and 6). The ten-sional cracks commonly appeared within 2 to A
B
[image:12.595.61.287.258.611.2]C
12 cm of the brink, with an average initiation location of about 583 cm from the brink. ‘Slab’ flows were relatively rare compared to the other grain flows with only seven events captured during observation, most of which occurred on the longer slipface slopes of the dune (Table 1). Grain-flow thicknesses increased downslope and ranged from 007 to 552 cm with an average thickness of 104 cm. The volume of sediment moved by these grain flows per flow event was estimated to range between 103 724 cm3 and 559 334 cm3 with an average volume of 182 111 cm3.
Lobe and funnel grain flows
Secondary grain flows are significantly smaller than primary flows and have been observed to occur shortly after larger grain-flow events (Bre-ton et al., 2008). Smaller grain flows were also observed to form seconds before large grain-flow events during the Maspalomas observations and were often obscured by the overriding primary grain flow. The smaller Maspalomas grain flows initiated in localized areas of slope destabiliza-tion, specifically where alcove walls failed or in areas where previous grain flows ‘locked up’ mid slope (McDonald & Anderson, 1995). Two types of distinct secondary grain flows were observed (Figs 5 and 6), referred to here as ‘lobes’ and ‘funnels’. Nearly all observed ‘lobe’ and ‘funnel’ grain flows formed in the mid-slope region of the slipface. The ‘lobe’ and ‘funnel’ grain flows that occurred higher upslope, near the brink, were frequently triggered by the failure of an alcove wall from an ‘hourglass’ grain flow. ‘Lobes’ and ‘funnels’ typically formed independently of one another but, in some cases, there were clusters of activity where two or more flows initiated at the same time or seconds apart from one another at various locations of the slipface. In other cases, a single ‘lobe’ or ‘funnel’ flow formed without any further activity.
‘Lobes’ were typically thin, broad, flattened features that rarely transported sediment to the base of the slipface. A total of 25 ‘lobe’ mor-phologies were identified in the laser scan data (Table 1). Grain-flow thicknesses of ‘lobes’ aver-aged about 077 cm and thinned upslope to the point of initiation, and sometimes thinned downslope as well. These flows moved small amounts of sediment, averaging about 1944 cm3 per flow event and ranging between approxi-mately 124 cm3and 5091 cm3.
‘Funnel’ grain-flow morphologies distinctly manifested as long, linear features that
transported small amounts of sediment down-slope through a shallow, narrow trough (Figs 5 and 6). In contrast to ‘lobes’, ‘funnels’ often suc-cessfully delivered sediment directly to the base of the slipface where it accumulated in a small depositional fan. These grain flows were quickly infilled, making it difficult to measure and iden-tify them in the laser scan data, and therefore only nine ‘funnel’ morphologies were identified in the laser scans with confidence (Table 1). From the few measurements collected, ‘funnel’ flow troughs averaged 189 cm in depth, and had widths ranging from about 2 to 5 cm. The average sediment thickness, deposited at the base of the slipface from ‘funnel’ flows, was measured to be approximately 119 cm and tapered in thickness upslope. The estimated vol-ume of sediment transported downslope by ‘fun-nel’ flows averaged about 1312 cm3 with a range of about 60 to 6386 cm3.
Frequency and magnitude
In addition to measurements from laser scans, video coverage of the main slipface (the 22 m high exposed slipface portion of the larger 962 m dune; Figs 1 and 2) between 10:00 am and 11:00 am provided the means to investigate frequency of grain-flow occurrence. This infor-mation was used to compare with the results of Breton et al. (2008). Table 2 lists the frequency of grain flows along with the grain-flow mor-phology corresponding to the grain flows listed in Table 1. Breton et al. (2008) reported 21 grain flows over 1 h of observation along a 14 m stretch of slipface of a 5 m high linear dune with wind speeds between 738 m sec1 and 749 m sec1 at a height of 05 m. The grain flows had an average area of 32 800 cm2 and occurred in ‘temporal clusters’ with an average reoccurrence of 27 min.
The main slipface of the Maspalomas study site exhibited similar clusters of activity sepa-rated by brief periods of inactivity which was accentuated directly after large grain flows occurred (Table 2). The Maspalomas grain-flow activity differs slightly from Breton et al. (2008) in terms of the time in between flows, duration of grain-flow activity, and area estimates (Tables 1 and 2). Maspalomas grain flows occurred more frequently (on average every min-ute) over a smaller area of slipface. The grain flows were also of shorter duration, averaging about 20 sec. Including all grain flows from Table 1, the spatial area was generally smaller.
‘Hourglass’ grain flows averaged 11 000 cm2, and ‘funnels’ and ‘lobes’ averaged between 200 cm2and 2900 cm2, respectively. ‘Slab’ flows (averaging 425 000 cm2) were the outlier regard-ing surface area measurements, far exceedregard-ing any grain flow reported in Bretonet al.(2008).
Slipface advancement
For the calculation of slipface advancement, laser scan data were restricted to a smaller por-tion of the slipface, overlapping with the main slipface, to investigate the relationship between grain-flow activity and slipface advancement. Based on laser scan measurements and video recordings, within 92 min of observation, approximately 277 832 cm3 of sediment was redistributed by 22 different grain flows on the main slipface (Table 1), equivalent to nearly half a metric ton of sediment. ‘Hourglass’ flows were
responsible for redistributing about 516% of that sediment. The single recorded ‘slab’ flow for this portion of the slipface moved approxi-mately 103 724 cm3 of the sediment, (about 43% of the total). Secondary flows redistributed minor amounts of sediment comprising the remaining 54% of the volume total.
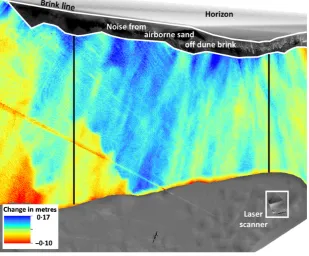
Figure 7 is a difference map of the two laser scans illustrating slipface advancement within the 90 min observation for an 8 m span of the slipface, overlapping with Figs 2, 3, 4 and 5. The difference map shows that some portions of the slipface advanced about 17 cm within this time. Using ArcMap and restricting the slipface area to a span of 5 m to correlate with the area of the main slipface, the volume difference between these scans was also calculated and resulted in a total of about 1 185 000 cm3 of sediment.
DISCUSSION
Grain-flow formation
The in situ field observations and high resolu-tion-measurements reported here provide new insights into morphodynamics of different grain flows and enable genetic insights into various grain-flow forms. ‘Hourglass’ morphologies are the best documented while smaller ‘lobe’ and ‘funnel’ morphologies are poorly known. The formational cause of particular grain-flow mor-phologies and the genetic relationships between various flow types are unknown. A few alterna-tive formation mechanisms have been proposed to explain the occurrence of spatially-small and large flows that do not result in an hourglass morphology. The various grain-flow types are discussed below.
Hourglass flows
[image:14.595.59.287.189.441.2]The most widely discussed grain-flow phe-nomenon involves the formation and failure of a bulge or larger wedge of sediment tens of cen-timetres downslope from the dune brink due to the accumulation of saltating sediment and grain fall. While the laser scan data in this study were not capable of observing the presence or growth of a sediment bulge/wedge due to noise near the dune brink, the location of failure downslope from the brink in relation to this pattern of sedi-ment accumulation is consistent with previous studies (e.g. Allen, 1968, 1970; Borowka, 1979; Hunter, 1985; Anderson, 1988; Nickling et al.,
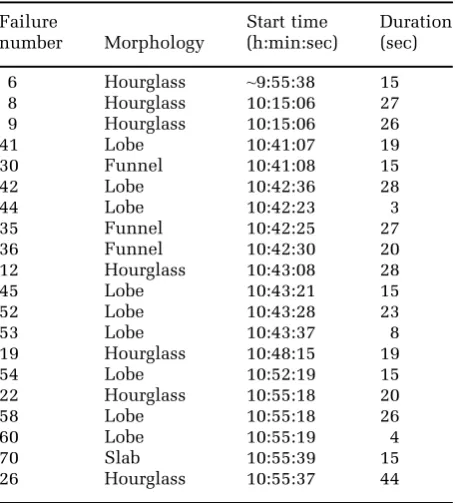
Table 2. Duration of grain flows observed on the main slipface shown in Figs 3, 4 and 5 with video coverage and scan data. Grain-flow failure numbers correlate with the failure numbers shown in Table 1. Grain flows 1 and 4 of the main slipface were only partially recorded and have not been included in this table. The start time for grain flow 6 is uncertain because video recording began at 9:55:38 am, seconds after its formation. Grain flows 6, 8 and 9 are from a separate video recording and do not have a time con-tinuum with the remaining grain flows in this table which were all recorded in the same video.
Failure
number Morphology
Start time (h:min:sec)
Duration (sec)
2002; Walker & Nickling, 2002; Cupp et al., 2005; Koket al., 2012; Sutton et al., 2013a,b).
Failures associated with the accumulation of a sediment bulge or wedge consistently correlated with the subsequent formation of an ‘hourglass’ grain flow as observed in previous field studies and wind tunnel experiments (e.g. Allen, 1968, 1970; Hunter, 1977; Borowka, 1979; Fryberger & Schenk, 1981; Hunter, 1985; Anderson, 1988; McDonald & Anderson, 1992, 1995; Tischler et al., 2001; Nickling et al., 2002; Walker & Nickling, 2002; Cupp et al., 2005; Dasgupta & Manna, 2011; Kok et al., 2012; Sutton, 2012; Sutton et al., 2013a,b; Nield et al., 2017). The difference between small and large ‘hourglass’ flows may relate to wind velocity. Stronger winds increase the saltation trajectory of grains transported over the dune brink, resulting in the formation and subsequent failure of a large sedi-ment wedge as opposed to a small bulge (Nick-linget al., 2002; Cuppet al., 2005).
Funnel and lobe flows
[image:15.595.142.452.66.322.2]Factors invoked to explain other grain-flow mor-phodynamics include disturbance from large grain flows, mid-slope accumulation of sedi-ment, and lee side airflow patterns. The forma-tion of ‘funnel’ and ‘lobe’ flows may be influenced by one or more of these factors. Bre-ton et al. (2008) observed that smaller ‘sec-ondary’ flows formed as a direct response to disturbance from larger ‘primary’ flows, and they occurred soon after the formation of the ‘primary’ flow. Some of the ‘lobe’ flows in this study also occurred as a direct result of distur-bance from larger flows. Typically, the collapse of an alcove wall from an ‘hourglass’ flow pro-duced a smaller ‘lobe’ flow. In a few instances, the tongue of the ‘hourglass’ flow disturbed nearby sediment as it moved downslope, trigger-ing simultaneous smaller ‘lobe’ flows. None of the ‘funnel’ flows were associated with ‘hour-glass’ flows but they often occurred with ‘lobes’
Fig. 7. Colourized difference map of the Maspalomas slipface depicting change in metres on the slipface, where cool colours represent advancement of the dune toward the laser scanner. Topographic change on the lee slope was created by subtracting two 3D laser scans taken 1 h, 32 min apart with 0001 m gridding. During this time, the maximum slipface advancement was approximately 17 cm. Outlines of a few individual avalanche events can still be seen. Noisy data near the dune crest is the result of airborne sediment. The white box in the lower right-hand corner contains a representation of the laser scanner, which is added automatically to each of the scans in the processing software ‘SCENE’ to show its location. The diagonal line radiating out from the scanner location is an artefact due to sensor vibrations probably caused by the windy conditions. The vertical black lines indicate the bounds of a 495 m area of the main slipface where volume calculations were derived from this difference map. This area also overlaps with the portion of the slipface shown in Figs 3, 4 and 5.
on the mid to lower lee slope preceding a larger flow. The occurrence of smaller flows prior to and independent of larger flows differs from the observations of Breton et al. (2008) and requires a different trigger mechanism.
The accumulation of sediment mid slope due to a ‘lock up zone’ (McDonald & Anderson, 1992, 1995, 1996) or the increase of aeolian transport during stronger winds (McDonald & Anderson, 1992, 1995, 1996; Nickling et al., 2002; Nield et al., 2017) are both potentially valid alternative formation mechanisms of ‘lobe’ and ‘funnel’ flows that form independent of ‘hourglass’ flows. It is possible that sediment from previous grain flows that did not reach the base of the slipface accumu-lated mid slope in this ‘lock up region’, facilitating the buildup and destabilization of sediment. In addition, observations took place during strong wind conditions (95 m sec1) which probably increased the downslope distance of where sedi-ment settled, augsedi-menting the accumulation of sediment in this mid-slope region.
Secondary lee slope airflow patterns generated by flow separation at the dune crest and subse-quent reattachment flow generate complex eddies and vortices which affect surface shear stress and sediment redistribution (Wiggs, 2001; Walker & Nickling, 2002; Parsonset al., 2004a,b; Cupp et al., 2005; Jackson et al., 2013a,b; Pel-letier et al., 2015; Smith et al., 2017a). As more airflow modelling is conducted, the effect of lee side airflow patterns on the initiation of ‘lobe’ and ‘funnel’ flows may become better under-stood, and a direct link to turbulent airflow and localized slope destabilization may be discov-ered (e.g. Walker, 1999; Walker & Nickling, 2002). ‘Lobe’ and ‘funnel’ flows may also be sen-sitive to the magnitude and direction of wind, where increasingly stronger winds can decrease the angle of initial yield leading to an increase of failures (Pelletier et al., 2015), and oblique incident airflow may promote lateral redistribu-tion of sediment on the slipface (Walker, 1999).
Slab flows
Large flows appear to be initiated by grain fall and grain saltation, similar to ‘hourglass’ flows; however, differences in scale and morphology suggest that an additional process influences the initiation of these spatially-large flows. Potential influences include moisture content (e.g. McKee et al., 1971; McKee & Bigarella, 1972; Morris et al., 1972; Bigarella, 1975), complex airflow cells on the lee side of the dune, or an alterna-tive failure process.
The presence of moisture is an obvious expla-nation for the formation of ‘slab’ flows, especially for coastal dunes which may have varying degrees of internal cohesion. Heavy rainfall occurred three days before with some light rain-fall the night before observations in this study. Despite the absence of detectable moisture in the sediment samples, internal layers of damp and dry sand could potentially influence the style of grain flow. Layers of relatively dry sand would provide a failure plane for large slabs of sediment such as those observed in this study. Similar cohesion is also thought to be present in polar aeolian deposits with alternate layers of snow, ice and sediment (e.g. Morris et al., 1972) but few field observations have been done in these envi-ronments and there are no known descriptions or observations of ‘slab’ flows on polar dunes.
Another explanation for the initiation of spa-tially-large grain flows may involve complex air-flow cells which carry and deposit sediment in the lee of the dune (McDonald & Anderson, 1995; Nickling et al., 2002). It is possible that sediment transported in flow cells may provide additional sediment, thereby increasing the mag-nitude of grain flows (Nickling et al., 2002). Cupp et al. (2005) showed from wind tunnel experiments that sediment deposition on the lee slope involves two transport zones. In the upper part of the lee slope, fallout of saltating grains results in reptation down the slope. Below this fallout area, there is a return cell that results in very minor upslope sediment transport. It has been hypothesized that the interaction between these two transport zones may produce larger grain flows (Nickling et al., 2002; Cupp et al., 2005). However, this explanation does not match well with the morphology and the initiation loca-tion of the ‘slab’ flows observed in this study.
as multiple tensional cracks centimetres from the dune brink and compressional folds formed as the ‘slab’ flow began to travel downslope (Table 1; Fig. 4). Sediment in the Maspalomas ‘slab’ flows appeared to be semi-cohesive despite the absence of detectable moisture in the sediment samples. The cause of cohesion in dry sediment was never discovered by Fryberger & Schenk (1981) but it cannot be discounted as a possible flow mechanism.
Sediment redistribution
Each of the grain-flow morphologies observed in Maspalomas has differing capacities of sediment transport which affects slipface advancement and dune migration. Details of these different types of grain flows will lead to a better under-standing of slipface processes as well as an improved interpretation of dune stratigraphy and aeolian environment.
Grain-flow morphology and magnitude
‘Slab’ flows displaced the greatest amount, nearly an order of magnitude greater volume than a single ‘hourglass’ flow and approximately two orders of magnitude greater than the average ‘lobe’ and ‘funnel’ flow. It therefore appears that ‘slab’ flows had the greatest influence on slip-face advancement and sediment redistribution. However, ‘slab’ flows were comparatively rare and it is likely that these grain flows formed under special conditions, potentially dependent on moisture which may have added cohesion to the sediment and may not be representative of typical slipface processes.
Due to the higher frequency of occurrence during observation in Maspalomas, ‘hourglass’ flows were probably responsible for moving the most sediment downslope. The regularity and frequency in which these grain flows occurred suggest that ‘hourglass’ flows play an important role in slipface advancement. ‘Lobe’ and ‘funnel’ flows appear to play a secondary role despite sediment from these flows not reaching the base of the slipface. These grain flows commonly occurred mid slope in areas on the slipface pre-viously suggested to be ‘lock-up zones’ (McDon-ald & Anderson, 1992, 1995, 1996) or zones of accumulated sediment from suspension settling (McDonald & Anderson, 1992, 1995, 1996; Nick-linget al., 2002; Nield et al., 2017). These smal-ler grain flows were the most frequent but were rapidly obscured by settling airborne sediment making it difficult to capture all the activity that
occurred during observation. The sediment that accumulates in the mid slope from grain fall or smaller grain flows may supply additional sedi-ment to other grain flows, potentially creating larger magnitude flows (McDonald & Anderson, 1992, 1995, 1996; Nickling et al., 2002), thus playing a minor role in slipface advancement.
Overall slipface advancement
There is a large discrepancy between the volume change of sediment on the slipface calculated from taking the difference between laser scans in ArcMap and measurements of individual grain flows alone from Table 1. Aggregated volume measurements of individual grain flows provide a total volume estimate of redistributed sediment
on the main slipface of approximately
277 832 cm3. In contrast, the difference of the two laser scans spanning 92 min indicated a total volume change of approximately 1 185 000 cm3 (1185 m3) for a 5 m span of the slipface.
This discrepancy is probably due to the fact that scans were acquired every 4 to 8 min and did not capture all grain flows which typically occurred at 30 sec to 1 min intervals (Table 2). In addition, the discrepancy in volume estimates between individual grain-flow measurements and the volume difference of laser scans may reflect how grain fall influences slipface advancement. Grain fall was responsible for trig-gering individual grain flows and rebuilding the slipface after an event but may have also had a significant role in slipface advancement. The precise influence that grain fall had on slipface advancement is difficult to quantify because it is a gradual process and varies depending on aeo-lian conditions.
Correlation of dune height and flow thickness
The thickness of individual grain-flow cross-strata preserved in aeolianite deposits has been previously used as a method to estimate palaeo-dune height (e.g. Kocurek & Dott, 1981; Sweet et al., 1988; Kocurek, 1991). This relationship was originally suggested by Hunter (1977) and relies on the assumption that grain-flow thick-ness is consistent on a variety of dune forms of the same height and increases in thickness with increasing dune height. While this hypothesis appears logical, there may be multiple influ-ences not accounted for that affect the thickness of a grain flow. For example, Nield et al. (2017) observed that with increasing wind velocities, the length and thickness of grain flows also increased. Additionally, the entrainment of
sediment as grain flows travel down the slipface may vary. Deposits of grain-flow thickness may increase due to the addition of grains from the mid slope where sediment can become destabi-lized in a ‘lock up zone’ or secondary location of localized over-steepening (McDonald & Anderson, 1992, 1995, 1996; Nickling et al., 2002; Nieldet al., 2017).
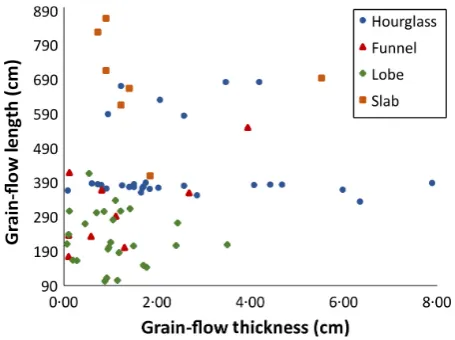
The grain flows observed in Maspalomas had a variety of flow thicknesses and did not have a strong correlation with dune height (related to grain-flow length; Fig. 8). The most variable grain-flow thicknesses were measured from ‘hourglass’ flows, where the thicker flows possi-bly entrained additional sediment from the mid slope. ‘Funnel’ flows had the strongest correla-tion between grain-flow length and thickness but also had the fewest number of observations. ‘Lobe’ flow thickness had a very weak correlation to grain-flow length but both the ‘funnel’ and ‘lobe’ flows generally did not extend the entire length of the slipface and would be a poor
indicator of potential dune height. ‘Slab’ flows had the most consistent base thickness, ranging between 1 cm and 2 cm with one outlier of 55 cm thickness (Fig. 8). These flows were rela-tively thin compared to other grain-flow
mor-phologies but may also be affected by
entrainment of additional sediment. Until more observations and measurements are collected, it is unclear how reliable grain-flow thickness is as a link to dune height, and should be treated with caution when interpreting palaeoenvironments.
Comparison of grain-flow behaviour with previous studies
Grain flows observed in Maspalomas and those reported by Breton et al. (2008) differ slightly in behaviour but are consistent when physical dif-ferences in dune morphologies and wind regime are considered. The linear dune observed by Breton et al. (2008) was 5 m high, while the main Maspalomas slipface was 22 m high. The shorter height of the Maspalomas slipface would shorten the duration of grain flows.
The Maspalomas dune had a higher frequency of grain-flow activity (Table 2), occurring on aver-age every minute whereas Breton et al. (2008) observed an average recurrence time of 27 min. Wind measurements in Breton et al., were col-lected at a height of 05 m and ranged between 738 m sec1 and 749 m sec1. Adjusting the average Maspalomas wind speed of 95 m sec1 from a height of 10 m to a height of 05 m using the wind profile power law results in a velocity of 86 m sec1. The higher frequency of grain-flow activity at Maspalomas is probably due to the greater wind speeds at the study site. Greater wind velocities trigger grain flows more fre-quently due to the larger amounts of sediment delivered to the slipface. Ignoring ‘slab’ flows, which do not appear to have occurred during the Breton et al.(2008) study, the spatial area of the Maspalomas grain flows was on average about 2 m2 smaller. This difference may also be due to
the dune height where taller dunes produce greater planform areas of grain flows as they flow downslope.
[image:18.595.58.286.348.518.2]Nield et al. (2017) collected data on a 512 m high dune using a Terrestrial Laser Scanner with wind measurements from anemometers at a height of 05 m over two days of observation. Differing grain-flow behaviour was observed and related to wind velocity, where lower wind velocities (<6 m sec1) resulted in small, dis-crete failures that occurred near the dune brink
with limited grain-flow lengths and thicknesses (Nield et al., 2017). Moderate winds (ca 65 m sec1) produced grain-flow activity further downslope of the dune brink with the ability to transport sediment to the bottom of the slipface. Strong winds (>84 m sec1) enabled ‘multiple families of failures’, where larger grain flows ini-tiated near the top of the slipface and smaller grain flows occurred partway down the slope (Nield et al., 2017). Under strong winds, there was frequent grain-flow activity and the grain flows that occurred had longer and thicker ton-gues of sediment that successfully transported sediment to the bottom of the slipface (Nield et al., 2017). Data also show that there was a downslope shift in the location from the dune brink of larger grain-flow initiation points (loca-tion of failure) from 30 cm during wind veloci-ties around 6 m sec1 to 40 cm for velocities >6 m sec1 with some grain flows initiating 1 m below the dune crest (Nieldet al., 2017).
While the Maspalomas observations did not include a study of grain-flow behaviour under a variety of wind conditions, the data agree well with the behaviour observed by Nield et al. (2017) during stronger wind velocities. The wind velocity at the study site, adjusted to a height of 05 m, was approximately 86 m sec1and exhib-ited a high frequency of grain-flow activity, where some grain flows occurred simultaneously or shortly after one another, or in ‘multiple families of failures’. No downslope shift was detected for the initiation point of ‘hourglass’ grain flows, where the location of failure remained around 30 cm below the dune brink but many ‘lobes’ and ‘funnels’ initiated further downslope. Additional observations need to be made to determine if the downslope shift in grain-flow failure is directly linked to wind velocity alone or if slipface length and dune morphology may have an effect. More specifically, an investigation of the conditions that produce sediment bulges (e.g. Allen, 1968, 1970; Hunter, 1985; Anderson, 1988; Walker & Nickling, 2002; Kok et al., 2012; Sutton, 2012; Sutton et al., 2013a,b) near the dune brink as opposed to larger sediment wedges (e.g. Nickling et al., 2002; Cuppet al., 2005; Nieldet al., 2017) may be helpful in elucidating this difference in observation.
CONCLUSION
Using a combination of high resolution, ground-based continuous laser scans and simultaneous
video recordings, various grain-flow morpholo-gies are presented for the first time. This study includes precise measurements of grain-flow thickness, as well as area and volume estimates of redistributed sediment for each grain-flow mor-phology observed (Table 1). Typical grain-flow thicknesses ranged from about 005 to 80 cm, where the thicker portions of grain flows were located where sediment accumulated at the bot-tom of the slipface. On average, grain flows were approximately 1 cm thick. ‘Slab’ flows were responsible for redistributing significant amounts of sediment, averaging about 182 111 cm3 per event but were not as common as ‘hourglass’ grain-flow morphologies and ‘funnel’ or ‘lobe’ flows. ‘Hourglass’ grain flows redistributed an average of 22 494 cm3per flow event while ‘fun-nels’ and ‘lobes’ redistributed an average of 1312 cm3and 1944 cm3, respectively.
The high-resolution measurements of grain-flow characteristics presented herein will be vital in verifying and improving laboratory and mod-elling efforts to identify grain-flow triggers for morphologically diverse grain-flow events and sediment volume flux in aeolian environments. With the growing literature on aeolian slipface processes, there is a need for a classification of lee slope grain flows based on formation patterns (for example, flow area, frequency and duration) and morphology. The morphology classification presented in this study provides a foundation for future study and a structure to support discrete observations between different aeolian environ-ments. For example, additional research is needed to investigate how grain-flow style is affected in coastal and polar environments in contrast to arid environments where cohesion from salts, liquid water and ice may affect grain-flow behaviour. This classification will aid in dis-tinguishing the influences on specific styles of flows which can be later linked to controlling parameters such as wind strength and direction, turbulent airflow, sediment deposition, grain tex-ture and environmental influences. This will ulti-mately lead to a better interpretation of aeolian strata and palaeoenvironments of dunes pre-served in the rock record (for example, estimates of dune height; McKee et al., 1971; McKee & Bigarella, 1972; Morris et al., 1972; Bigarella, 1975; Hunter, 1977; Kocurek & Dott, 1981; Sweet et al., 1988; Sweet & Kocurek, 1990; Cookeet al., 1993; Bourke, 2005; Anderson & Walker, 2006; Eastwood et al., 2012), as well as a better under-standing of the intricacies of slipface processes and overall dune migration.
ACKNOWLEDGEMENTS
We would like to thank Luis Hernandez for local logistical help in Maspalomas, the dedicated field assistants from the Universidad de Las Pal-mas de Gran Canaria, the cartographers who recorded GPS points, Dave Rogers for training and technical help with the FARO laser scanner and SCENE software, Stephen Sutton and other anonymous reviewers of this paper who pro-vided many helpful suggestions and insights. This research was funded through a Vice-Chan-cellor’s Research Scholarship from Ulster University and is a contribution towards NERC grant number NE/F019483/1.
REFERENCES
Alcantara-Carrio, J. (1998) Estudio de dinamica sedimentaria eolica en Maspalomas, Ayuntamiento de San Bartolome de Tirajana, Technical Report.
Allen, J.(1968) The diffusion of grains in the lee of ripples, dunes and sand deltas.J. Sed. Petrol.,38, 621–633.
Allen, J.(1970) The avalanching of granular solids on dune and similar slopes.J. Geol.,78, 326–351.
Anderson, R. (1988) The pattern of grainfall deposition in the lee of aeolian dunes.Sedimentology,35, 175–188.
Anderson, J.L. and Walker, I.J. (2006) Airflow and sand transport variations within a backshore-parabolic dune plain complex: NE Graham Island, British Columbia, Canada.Geomorphology,77, 17–34.
Bagnold, R. (1941) The Physics of Blown Sand and Desert Dunes. Methuen, London, 265 pp.
Bigarella, J.J.(1975) Structures developed by dissipation of dune and beach ridge deposits.Catena,2, 107–152.
Borowka, R.K. (1979) Accumulation and redeposition of eolian sands on the lee slopes of dunes and their influence on formation of sedimentary structures. Quaest Geographicae,5, 5–22.
Bourke, M.C.(2005) Alluvial fans on dunes in Kaiser Crater suggest niveo-aeolian and denivation processes on Mars.
Lunar and Planetary Science Conference. XXXVI, Abs #2373.
Breton, C., Lancaster, N. and Nickling, W.G. (2008) Magnitude and frequency of grain flows on a desert sand dune.Geomorphology,95, 518–523.
Cooke, R., Warren, A. and Goudie, A. (1993) Desert Geomorphology. UCL Press LTD, London, 329 pp.
Cupp, K.,Lancaster, N.andNickling, W.G.(2005) Lee slope processes on a small artificial flow-transverse dune. EOS Trans. Am. Geophys. Union, 86. (52, Fall Meeting Supplement), Abs #H51C-0386.
Dasgupta, P.andManna, P.(2011) Geometrical mechanisms of inverse grading in grain-flow deposits: an experimental revelation.Earth-Sci. Rev.,104, 186–198.
Eastwood, E.N., Kocurek, G., Mohrig, D. andSwanson, T.
(2012) Methodology for reconstructing wind direction, wind speed, and duration of wind events from aeolian cross-strata.J. Geophys. Res.,117, F03035.
Fryberger, S.G. andSchenk, C. (1981) Wind sedimentation tunnel experiments on the origins of aeolian strata.
Sedimentology,28, 805–821.
Hernandez, L., Alonso, I., Ruiz, P., Perez-Chacon, E.,
Suarez, C. and Alcantara-Carrio, J. (2002) Decadal environmental changes on the dune field of Maspalomas (Canary Islands): evidences of an erosive tendency. In:
Littoral 2002: The Changing Coast (Eds F. Veloso Gomes, F. Taveira Pinto and L. Das Neves), Vol. 3, pp. 293–297. Samara Publishing Limited, Cardigan, UK.
Hernandez, L., Jackson, D.W.T., Medina, R., Cordero, A.I.H.,Cruz, N.andRequejo, S.(2014) Downwind effects on an arid dunefield from an evolving urbanized area.
Aeol. Res.,15, 301–309.
Hernandez, L., Jackson, D.W.T. and Cooper, J.A.G. (2017) Island-encapsulating aeolian sedimentary systems of the Canary and Cape Verde Archipelagos. J. Sed. Res., 87, 117–125.
Hunter, R.E. (1977) Basic types of stratification in small eolian dunes.Sedimentology,24, 361–387.
Hunter, R.(1985) A kinematic model for the structure of lee-side deposits.Sedimentology,32, 409–422.
Jackson, D.W.T., Beyers, J.H.M., Delgado-Fernandez, I.,
Baas, A.C.W., Cooper, J.A.G. and Lynch, K. (2013a) Airflow reversal and alternating corkscrew vortices in foredune wake zones during perpendicular and oblique offshore winds.Geomorphology, 187, 86–93.
Jackson, D., Cruz-Avero, N., Smyth, T. and Hernandez-Calvento, L. (2013b) 3D airflow modeling and dune migration patterns in an arid coastal dune field.J. Coastal Res.,65, 1301–1306.
Kocurek, G. (1991) Interpretation of ancient eolian sand dunes.Annu. Rev. Earth Planet. Sci.,19, 43–75.
Kocurek, G. andDott, R.H.(1981) Distinctions and uses of stratification types in interpretation of eolian sand.J. Sed. Res.,51, 579–595.
Kok, J.F., Parteli, E.J.R., Michaels, T.I.andBou Karam, D.
(2012) The physics of wind-blown sand and dust. Rep. Prog. Phys.,75, 106901.
Lindsay, J.F.(1973) Reversing barchans dunes in lower Victoria Valley, Antarctica.Geol. Soc. Am. Bull.,84, 1799–1806.
Martinez, J. (1986) Dunas de Maspalomas (Gran Canaria): naturaleza petrologica de sus arenas.Anu. Estud. Atl., 32, 785–794.
Marzol, M.(1987)Las Precipitaciones en las Islas Canarias, Santa Cruz de Tenerife, p. 220. Servicio de Publicaciones de la Universidad de La Laguna, Spain.
McDonald, R.andAnderson, R.(1992) The morphology and dynamics of natural and laboratory grain flows. In:
Engineering Mechanics: Proceedings of the 9th Conference
(Eds L.D. Lutes and J.M. Niedzwecki), pp. 748–751. A. S. C. E., New York.
McDonald, R. and Anderson, R. (1995) Experimental verification of aeolian saltation and lee side deposition models.Sedimentology,42, 39–56.
McDonald, R.andAnderson, R.(1996) Constraints on eolian grain flow dynamics through laboratory experiments on sand slopes.J. Sed. Res.,66, 642–653.
McKee, E.D. and Bigarella, J.J. (1972) Deformational structures in Brazillian coastal dunes. J. Sed. Res., 42, 670–681.