9
Thg
Economzc and Social
Research Institute
PAYROLL TAX INCIDENCE, THE DIRECT
TAX BURDEN AND THE RATE OF RETURN
ON STATE PENSION CONTRIBUTIONS
IN IRELAND
GERARD HUGHES
*T.K. WHITAKER, M.SC.(ECON.), D.ECON. SC., LL.D., President of the Institute. *P. LYNCH, M.A., M.R.I.A., Chairman of the Council.
R.D.C. BLACK, PH.D., Professor, Department of Economics, The Queen’s Uniuersity, Belfast.
D.J. BUCKLEY, Vice President and General Manager, Merck, Sharp and Dohme (Ireland) Ltd., Co. Tipperary.
*SEAN CROMIEN, B.A., Second Secretary, Department of Finance. G. DEAN, M.D., F.R.C.P., Director, Medico-Social Research Board.
N.J. GIBSON, B.SC.(ECON.), PH.D., Professor, Department of Economics, New Unl-uersity of Ulster, Coleraine.
PATRICK A. HALL, B.E., M.S., DIP.STAT., Director of Research, Institute of Public Administration.
*W.A. HONOHAN, M.A., F.I.A.
*KIERAN A. KENNEDY, M.ECON.SC., B.PHIL., PH.D., Director of the Institute. MICHAEL J. KILLEEN, B.A., B.COMM., LL.D., Chairman, Irish Distillers Group. T.P. LINEHAN, B.E., B.SC., Director, Central Statistics Office.
*D.F. McALEESE, B.COMM., M.A., M.ECON.SC., PH.D., Whately Professor of Political Economy, Trinity College, Dublin.
CHARLES McCARTHY, PH.D., B.L, Professor of Industrial Relations, Trinity College, Dublin.
*EUGENE McCARTHY, M.SC.(ECON.), D.ECON.SC., Director, Federated Union of Employers.
JOHN J. McKAY, B.SC., D.P.A., B.COMM., M.ECON.SC., ChiefExecutiue Officer, Co. Cauan Vocational Education Committee.
*J.F. MEENAN, M.A., B.L.
*D. NEVIN, General Secretary, Irish Congress of Trade Unions. *TOMAS F. 6 COFAIGH, Governor, Central Bank.
JOYCE O’CONNOR, B.SOC.SC., M.SOC.SC., PH.D., Director, Social Research Centre, College of Humanities, National Institute for Higher Education, Limerick.
E. O’DRISCOLL, B.SC., M.ENG., Managing Director, Wang Laboratories Ireland, B. V., Limerick.
I. 6 FIONNGHALAIGH, Secretary, Department of Labour.
D.P. O~IAHONY, M.A., PH.D., B.L., Professor, Department of Economics, Uniaersity College, Cork.
LABHRAS 6 NUALLAIN, D.ECON.SC.
B. PATI’ERSON, B.A., M.I.I.E., A.I.P.M., Director General, Irish Management Institute. S. SHEEHY, B.AGR.SC., PH.D., Professor, Department of Applied Agffcultural
Econo-mics. University College, Dublin.
T.C. TONER, B.COMM., M.B.A., Managing Director, BWG Ltd.
*B.M. WALSH, B.A., M.A., PH.D., Professor, National Economics of Ireland and Applied Economics, University College, Dublin.
T. WALSH, M.AGR.SC., PH.D., D.SC., M.R.I.A.
*REV. C.K. WARD, B.A., S.T.L., PH.D., Professor, Department of Social Science, Uni-versity College, Dublin.
P.A. WHITE, B.CO~,~I., D.P.A., Managing Director, Industrial Deuelopment Authority, Dublin.
PAYROLL TAX INCIDENCE, THE DIRECT
TAX BURDEN AND THE RATE OF RETURN
ON STATE PENSION CONTRIBUTIONS
IN IRELAND
Copies of this paper may be obtained from The Economic and Social Research Institute (Limited Company No. 18269). Registered Office:
4 Burlington Road, Dublin 4.
Price IR£7.00
PAYROLL TAX INCIDENCE, THE DIRECT
TAX BURDEN AND THE RA TE OF RETURN
ON STATE PENSION CONTRIBUTIONS
IN 1RELAND
GERARD HUGHES
© THE ECONOMIC AND SOCIAL RESEARCH INSTITUTE DUBLIN, 1985
I am indebted to the lnstitute’s internal readers Terry Baker and Damian Hannan for their detailed and constructive comments on the first draft, to past and present ESR/ colleagues John Bradley, Tim Callan, Denis Conniffe, Connell Fanning, John FitzGerald, Kieran Kennedy, Gary Keogh, Sue Scott andJerry Sexton for their comments on an earlier draft of Chapter 2 when it was discussed at a staff meeting in the ESRI, to Eithne Fitzgerald and Christos loannidis for their comments on the contents of this chapter during seminars at the ESRI and the Department of Economics, University College Cork, and to Con Power of the Confederation of Irish Industry, the External Referee and officials of the Departments of Finance, Labour, and Social Welfare for comments on the final draft. I am also indebted to the Central Statistics Office, the Department of Social Welfare and the Revenue Com-missioners for providing information and unpublished data which were essential for certain parts of the analysis. Barry Reilly and Mark Wynne provided advice, when they were at the ESRI, on TROLL which made learn-ing this computer package, by dolearn-ing, considerably easier than it would other-wise have been.
Chap ter 1
CONTENTS
General Summary
Introduction
Page 1
Growth and Financing of Social Insurance in Ireland since 1952 and Expenditure on the Main Social Security
Programmes 9
Estimates of Payroll Tax Incidence in Ireland 27
Effects of Social Insurance Contributions on Effective Tax
Rates and the Distribution of Income for PAYE Taxpayers 49
Determinants of Old Age and Other Social Welfare Benefits 76
Development of State Pension Schemes and Rates of Return
on Social Insurance Pension Contributions 94
Summary and Conclusions 121
References 127
Appendix Tables 134
LIST OF TABLES
Table Page
1.1 Ordinary social insurance contribution rates per week for men
and women and employers and employees, and proportion of
total contribution paid by the employer, 1953-1982 10
1.2 Total social insurance contribution as a percentage of average
weekly earnings of adult and non-adult male and female
workers in Transportable Goods Industries, 1953-1982 12
1.3 Number of persons insured for some or all benefits; actual and
per cent of total labour force, 1953-1980 16
1.4 Social insurance income and expenditure, year ended 31 March,
1.6 Social assistance income and expenditure, year ended 31 March, 1953-1982
1.7 Distribution of social assistance expenditure, year ended 31
March, 1953-1982
1.8 Ratio of insurance to assistance expenditure on unemployment,
survivors’ pensions, old age pensions, and total and percentage of total social security income provided out of general taxation, year ended March, 1953-1982
1.9 Social security contributions by employees and employers in
some OECD countries in 1981 as a percentage of total taxation
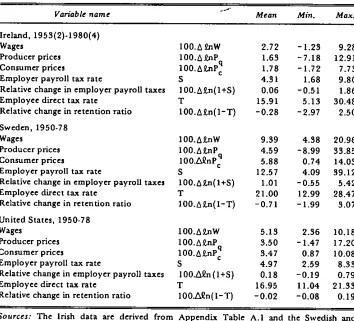
2.1 Wages, prices and taxes in Ireland, 1953-80, Sweden and the
United States, 1950-78
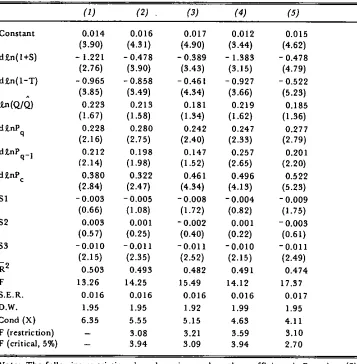
2.2 Unconstrained and constrained OLS estimates of payroll
tax incidence in Transportable Goods Industries in Ireland, 1953(3)-1980(4). Dependent variable is din AHEADJ
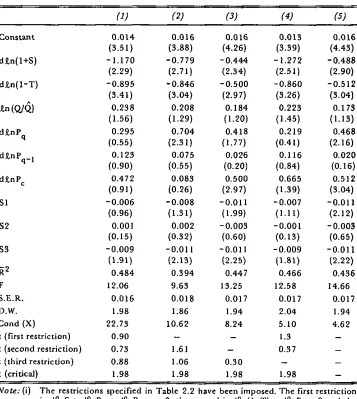
2.3 Unconstrained and constrained 2SLS estimates of payroll
tax incidence in Transportable Goods Industries in Ireland, 1954(2)-1980(4). Dependent variable is din AHEADJ
3.1 Average wage per employee and poverty fines for various
family sizes: selected years 1953-1980
3.2 Amount and effective rate of income and payroll tax on
specimen incomes, 1953-54
3.3 Amount of effective rates of income and payroll tax on
specimen incomes, 1963-64
3.4 Amount and effective rates of income and payroll tax on
specimen incomes, 1973-74
3.5 Amount and effective rates of income and payroll tax on
specimen incomes in 1980-81
3.6 Reconciliation of numbers assessed for PAYE and standard
rate PRSI contributors in 1979-80
3.7 Comparison of estimated and actual social insurance revenue,
1979-80
3.8 Actual income tax and estimated payroll tax borne by each
income class insurable at standard PRSI class rate in 1979-80
21
23
24
26
38
41
43
50
51
55
57
62
67
68
3.9 Amount and effective rates of income and payroll tax on
specimen incomes, 1979-80 70
3.10 Estimate of revenue from PRSI at standard rate where lower earnings are partially exempt and upper earnings limit is
abolished, 1979-80 74
3.11 Estimate of revenue from PRSI in 1979-80 under Programme
for Government Proposals 75
4.1 Percentage increases in the unemployment and disability
benefit scale rates and in average pre-tax earnings of male
workers in Transportable Goods Industries, 1952-82 79
4.2 Percentage increases in old age contributory pension scale
rates for a single adult and in average pre-tax earnings of
male workers in Transportable Goods Industries, 1961-1982 80
4.3 Ratios and elasticities of social welfare benefits with respect
to pre- and post-tax average industrial earnings, 1952-81 86
4.4 Equivalence scales implicit in payments of dependants of
welfare recipients 90
4..5 Regression results for effect of political influence on social
welfare payments, 1952-1981 92
5.1 Number of persons and qualified dependants in receipt of
contributory and non-contributory old-age pensions on
31 March, 1952-1980 101
5.2 Number of persons and qualified dependants in receipt of
retirement pensions on 31 March, 1971-1980 102
5.3 Pensioners and adult dependants its a percentage of those of
pension age, 1952-1979 102
5.4 Compounded growth rate per annum over the period
1961-1982 of £1 invested 1 January 1961 (with dividends
re-invested) 104
5.5 Contributory and retirement pension element in weekly
social insurance contributions, 1961-1982 (£ or %) 105
5.6 Annual contributions for contributory and retirement pensions,
1961-1982 (£) 106
5.7 Estimated average social insurance tax-benefit ratios under
5.9 Approximate real rates of return on total social insurance contributions for persons with different earnings retiring
in 2006 (per cent) 113
5.10 Approximate real rates of return on social insurance contri-butions attributable to employees with different earnings
retiring in 2006 (per cent) 114
LIST OF CHARTS
Figure Page
1.1 Ordinary rate social insurance contributions as a percentage
of average weekly earnings in Transportable Goods Industries on the date at which contribution rates were changed,
classi-fied by age and sex, 1953-82 13
3.1 Income and payroll tax rates for different household sizes,
1953-54 52
3.2 Combined income and payroll tax rates for different
house-hold sizes, 1953-54 53
3.3 Income and payroll tax rates for different family sizes,
1963-64 56
3.4 Income and payroll tax rates for different household sizes,
1973-74 58
3.5 Combined income and payroll tax rates for different
house-hold sizes, 1963-64 60
3.6 Combined income and payroll tax rates for different
house-hold sizes; 1973-74 61
3.7 Income and payroll tax rates for different household sizes,
1980-81 64
3.8 Combined income and payroll tax rates for different
house-hold sizes, 1980-81 66
3.9 Hypothetical income and payroll tax rates for different household sizes and actual average income tax rates,
3.10 Combined actual and hypothetical income and payroll tax
rates for different household sizes, 1979-80 73
4.1 Cumulative percentage increases since 1952 in single person’s
unemployment and disability benefit, average male industrial
earnings before tax, and the consumer price index gl
4.2 Cumulative percentage increases since 1961 in single adult’s old age contributory pension, average male industrial earnings
before tax, and the consumer price index 82
4.3 Single person’s unemployment benefit as a proportion of
average male industrial earnings before and after tax,
1952-81 89
APPENDIX TABLES
Figure Page
A.1 Basic data for payroll tax shifting model for Irish
Transport-able Goods Industries, 1953(1)-1980(4) 134
A.2. Weekly rates of unemployment and disability bencflt for a single adult, a married couple, and a family of four,
1952-82 137
A.3 Weekly rate of unemployment assistance (urban areas) for a
single adult, a married couple and a family of four,
1952-1982 138
A.4 Weekly rates of old age contributory pension for a single adult, a married couple, and a family of four (basic rate for pensioner under 80 with adult dependant under pension age)
1952-1982 139
A.5 Weekly rates of old age non-contributory pension for a single
adult, a married couple and a family of four (basic rate for
pensioner under 80), 1952-1982 140
A.6 Pre- and post-tax male average industrial earnings (£) on CIP
Survey data preceding date of increase in social welfare
bene-fits, 1951-1981 141
A.7 Ratios and elasticities of social welfare benefits with respect
to pre- and post-tax average industrial earnings, 1952-1982 142
A.8 Comparison of R2 for regression equations including and
The main objectives of this study are to estimate the incidence of the payroll tax in Ireland, to analyse the effective burden of direct taxation when the incidence of the payroll tax is taken into account, to consider if the benefits paid by the State’s main social welfare programmes are linked in ally way to changes in living standards, and to bring together the cost and benefit sides of part of the social insurance system by looking at the value which insured workers witb different incomes get for the contributions which they and their employers make to the State old age contributory and retirement pension plans.
Since the unification of the State’s social insurance programmes in the early 1950s the total social insurance contribution has grown from around 4 per cent of the average industrial wage to nearly 20 per cent in the early 1980s and the proportion payable by the employer has risen from a half to two-thirds. The insured labour force has grown from around 725,000 to over 1,000,000 while the proportion of the labour force covered for some social insurance benefits has risen from under 60 per cent to over 80 per cent. The revenue provided by employer and employee contributions, £4.5 million in 1953 and £537 million in 1982, has never been enough to finance all of the income maintenance payments which are made to insured workers and the deficits have been met by the State out of general revenue. In 1953 income provided by the State amounted to £2.2 million or 30 per cent of the total while in 1982 it amounted to £207 million or 28 per cent of the total. Since Ireland joined the EEC successive governments have pursued a policy of making social insurance more self-financing by reducing the State’s share and increasing the employers’ share.
If the cost of social insurance can be reallocated between insured workers, their employers and the community at large by legislative decree the effective-ness of the payroll tax as an instrument of economic policy would be con-siderab[y enhanced and it is important for this and other reasons to investigate where the incidence of the tax lies. The incidence of the tax is examined by means of a standard wage-price regression model using quarterly data for the manufacturing sector for the period 1953(1)-1980(4).
PAYROLL TAX INCIDENCE AND THE DIRECT TAX BURDEN
of the employee tax variable indicates that a one per cent increase in the proportion of earnings which is taken in income or payroll tax would push up the nominal wage rate by one half of one per cent. Employers and employees are therefore able to partially shift their components of the payroll tax and the legal and effective incidence of this tax are not the same. Employer organisations have argued that the effect of the payroll tax on job creation has become increasingly disadvantageous as the legal burden of
the tax on employers has increased over the years. The estimate of the pro-portion of the employer payroll tax which is shifted is used to evaluate the effect of the tax on employment in manufacturing. It appears that a reduc-tion in the employer’s PRSI contribureduc-tion to 2 per cent in 1979 would have increased employment in the industrial sector by approximately 1,500 or by considerably less than the increase of 2,700 which the Labour Intensive Group Committee of the Confederation of Irish Industry implies would occur in labour intensive industries alone. The employers arguments about the magnitude of the effect of the payroll tax on employment cannot, therefore, be accepted unless further evidence to support their case is forth-coming. It should also be noted that the employment elasticity of a payroll tax cut in Ireland appears to be very low and that it would seem to be far more costly to use payroll tax cuts as a method of job creation than the policy of direct grant aid which has been used so successfully in the past.
The results of the tax incidence investigation are used to provide an analysis of effective direct tax rates (i.e., income tax plus the social insurance contribution paid by the employee plus that part of the employer social insurance contribution passed back to the employee) on specimen incomes in 1953/54, 1963164, 1973/74 and 1980/81 and on actual incomes in 1979/g0. The progressivity of the income tax in the lower income ranges was offset by the payroll tax because of the absence of a lower earnings limit for social insurance contributions and the use of flat-rate rather than earnings related contributions until the mid-1970s. The adverse effects of the payroll tax on direct tax rates of those on lower incomes worsened over the years as the cost of financing social insurance increased. In the last year in which flat-rate charges alone were used, 1973/74, direct tax rates
pro-portional over the lower income ranges and progressive thereafter according to the specimen income data for 1980/81. This is confirmed by the Revenue Commissioners actual income distribution data for 1979/80. In addition, the data shows that the payroll tax still imposed a considerable burden on low income taxpayers. One-sixth of all PAYE taxpayers were exempt from income tax in 1979/80 because they earned less than the tax exemption limit yet they had to bear a payroll tax rate of 8.3 per cent on their incomes because of the lack of a lower earnings limit for payment of the tax. The close correspondence between income tax exemption limits and poverty lines for different household sizes suggests that the payroll tax still hits the poor the hardest while virtually sparing the rich.
Proposals for reform of social insurance financing made by the Commission on Taxation and the coalition government of Fine Gael and Labour in their Programme for Government are examined and it is shown that there would be revenue shortfalls under both of them. It is suggested that one way in which the burden of the payroll tax on the poor could be considerably lightened and an element of progrcssivity introduced into the tax would be to abolish the upper earnings limit and to exempt those who are already exempt from income tax except for a token payment to maintain entitle-ment to social insurance benefits. Costings of this suggestion indicate that it would have been possible to raise the sarne payroll tax revenue as was done in 1979/80 while reducing the standard ratc contribution by over one and a half per cent.
4 PAYROLL TAX INCIDENCE AND THE DIRECT TAX BURDEN
allowances and this has caused unintended work disincentive effects for some recipients of insurance benefits. The second is that the method of indexation does not take account of demographic and other changes which reduce the number of social insurance contributors per beneficiary.
It is recommended that the authorities should consider indexing benefits to take-home pay to ensure that the benefits of increased prosperity are equitably distributed among all sectors of the insured population. An advan-tage of doing so would be that there might then be no need to tax short-term social welfare benefits to deal with the work disincentive effects of high replacement ratios. It is also suggested that when demographic or other changes occur which increase the cost of social insurance, consideration should be given to adjusting insurance benefits as well as contributions to ensure that the burden is shared between the working and non-working members of the insured population rather than being borne by the working population alone.
The existence of a relationship between social insurance benefits and average industrial earnings permits a rate of return analysis of total social insurance pension contributions and of the component attributable to employees alone to be made. A tax-benefit model encompassing the main features of the contributory old age and retirement pension schemes is used to compare the cost of State pensions to people retiring in 1982 who had entered the scheme at its inception in 1961 with the cost to those who were blanketed-in when the income eligibility limit was abolished in 1974. It is found that all of those retiring in 1982 would benefit far more from the State pension than it cost them and that those who were blanketed-in would benefit considerably more than those who had contributed to the scheme
average contributor to the State pension schemes would find it extremely difficult to get a rate of return approaching the yield on State pension con-tributions and it is concluded that if the structure of the scheme remains unchanged it will give very good value for money to insured workers retiring in 2006.
The size of the internal rate of return for the average insured worker retiring in 2006 does, however, raise questions about the cost of maintaining the current relationships between social insurance pension contributions, benefits and average industrial earnings in the future. The cost implications of maintaining the current relationships until 1991 are explored using pro-jections of the number of pensioners made for the NESC by Courtney and McCashin (1983) and the effects on costs of variations in their dependency assumptions, in contributory pension age, and in the rate of growth of earnings are also investigated. It appears that if earnings grow at 2 per cent per annum, the contributory pension age is reduced to 65, and dependency ratios increase as hypothesised in Chapter 5, flat-rate contributory and retirement pension costs would rise by nearly 85 per cent in real terms over the next decade. This cost increase would have to be met by a 50 per cent increase in the proportion of the wage bill which would be used to finance State pensions in 1991. In view of the low level of social security taxes in Ireland relative to other EEC countries it is argued that cost increases of this magnitude would not impose an unsustainable burden on the working population. It is important, however, that workers and employers are pre-pared for such increases and it is argued that a very good case can be made on the basis of the value of the services which industry gets from the State’s
Introduction
In common with developments in other Western countries the general acceptance which the social insurance system commands in Ireland has begun to weaken in recent years under the strains imposed by recession, increasing cost, and demographic changes. The most dramatic manifestation of Irish workers’ discontent with the system occurred in 1982 after social insurance contributions were increased from 14.8 to 19.1 per cent. The tax revolt which this sparked off eventually forced the Government to intro-duce a special PRSI tax allowance for ordinary rate contributors to offset the rise in the contribution rate to some extent. The dissatisfaction which the working population feels with the social insurance system embraces such questions as thc incidence of social insurance contributions and of the benefits which they finance, and the future cost of maintaining the present system. Very little research has been done on these questions in Ireland, possibly bccausc of the data deficiencies concerning social policy which have been documented by the NESC (1983, Appendix 1, Section 4), but this paper will attempt to answer some of them by utilising models which have been successfully applied to social insurance systems in other countries.
Chapter 1
GROWTH AND FINANCING OF SOCIAL INSURANCE IN IRELAND
SINCE 1952 AND EXPENDITURE ON THE MAIN SOCIAL SECURITY PROGRAMMES
1.1 Introduction
This chapter ~411 present information on the financing of social insurance in Ireland since the introduction of the unified social insurance scheme in
1952. It will also trace the growth in coverage of the scheme in the post-war period and took at trends in expenditure on the main social insurance and social assistance schemes. It will not give detailed information on the historical development of the main social security programmes as this has already been done by Farley (1964). An up-to-datc guide to the modem social services is proxdded by Curry (1980) while Kennedy (1975) gives com-parisons of social expenditure in Ireland and other countries during the period 1955-72.
1.2 Social Insurance Contributions, 1953-82
Since the Social Welfare Act, 1952 unified the State’s main social insurance schemes three methods of financing the system have been used as will be seen from Table 1.1:
(i) flat-rate contributions levied from January 1953 to April 1974;
(ii) flat-rate and pay-related contributions levied from April 1974 to
April 1979;
(iii) pay-related contributions levied from April 1979 to date.
All three rncthods have been accompanied by an upward trend in the pro-portion of the social insurancc contribution nonfinally payable by the employer. The contributions were split 50:50 between employer and em-ployee for men tip to May 1967 and 60:40 approximately for women up to January 1961 when the proportion payable by the cmploycr was reduced to
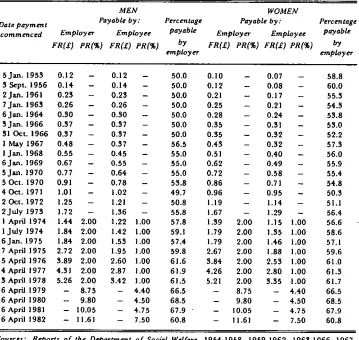
Table 1.1 : Ordinary social insurance contribution rates per week for men and women and employers and employees, and proportion of total contribution paid by the employer,
1953-1982
MEN WOMEN
Payable by: Percentage Payable by: Percentage Employer Employee payable Employer Employee payable FR(£) PR(~) FR(~) PR(%) by rs(~) PR(~) FR(~) PR(~) bY
employer employer
5Jan. 1955 0.12 - 0.12 50.0 0.10 - 0.07 58.8
3 Sept. 1956 0.14 - 0.14 50.0 0.12 - 0.08 60.0
2Jan. 1961 0.23 - 0.23 50.0 0.21 - 0.17 55.3
7Jan. 1963 0.26 0.28 50.0 0.25 - 0.21 54.3
6Jma. 1964 0.80 0.80 - 50.0 0.28 - 0.24 58.8
3Jan. 1966 0.37 0.57 50.0 0.35 - 0.31 53.0
81 Oct. 1966 0.87 0.37 - 50.0 0.85 - 0.82 52.2
1 May 1967 0.48 0.37 - 56.5 0.43 - 0.32 57.3
I Jan. 1968 0.55 0.45 - 55.0 0.51 - 0.40 56.0
6Jan. 1969 0.67 0.55 - 55.0 0.62 0.49 55.9
5Jan. 1970 0.77 0.64 - 55.0 0.72 0.58 55.4
5 Oct. 1970 0.91 0.78 - 53.8 0.86 0.71 54.8
4 Oct. 1971 1.01 1.02 - 49.7 0.96 0.95 50.8
2 Oct. 1972 1.25 1.21 - 50.8 1.19 1.14 - 51.1
2July 1978 1.72 1.36 - 55.8 1.67 1.29 - 56.4
I April 1974 1.44 2.00 1.22 1.00 57.8 1.39 2.00 1.15 1.00 56.6 1 July 1974 1.84 2.00 1.42 1.00 59.1 1.79 2.00 1.55 1.00 58.6 8Jan. 1975 1.84 2.00 1.53 1.00 57.4 1.79 2.00 1.46 1.00 57.1 7 April 1975 2.72 2.00 1.95 1.00 59.8 2.67 2.00 1.88 1.00 59.6 5 April 1976 8.89 2.00 2.60 l.O0 61.6 3.84 2.00 2.53 1.00 61.0 4 April 1977 4.31 2.00 2.87 1.00 61.9 4.26 2.00 2.80 1,00 61.3 8 April 1978 5.26 2.00 8.42 1.00 61.5 5.21 2.00 3.35 1.00 61.7 6 April 1979 -- 8.75 -- 4.40 66.5 -- 8.75 -- 4.40 66.5 6 April 1980 -- 9.80 -- 4.50 68.5 -- 9.80 -- 4.50 68.5 6 April 1981 -- 10.05 -- 4.75 67.9 " -- 10.05 -- 4.75 67.9 6April 1982 -- 11.61 -- 7.50 60.8 -- 11.61 -- 7.50 60.8 Sources: Reports of the Department of Social Welfare, 1954-1958, 1959-1962, 1968-1966,
1967-1971, 1972-1975, 1976-1978, and 1979-1980, Department of Social Welfare, Summary of Social Insurance and Social Assistance Services, April 1981 and April 1982.
Notes: (i) Pay-related contributions were chargeable on employees current gross earnings up to a ceiling of £2,500 between April 1974 and April 1979, £5,500 between April 1979 and Ap~l 1980, £7,000 between April 1980 and April 1981, .£8,500 between April 1981 and April 1982, and -1"9,500 from April 1982. The contribution rates from April 1982 include a 1% Youth Employment Levy which continues to be payable on all earnings in excess of -9,500. Average industrial earnings were used to work out the percentage payable by the employer from April 1974 onwards.
GROWTH OF THE SOCIAL INSURANCE SYSTEM I I
to about 50 per cent. In july 1973 and again in April 1974 when pay-related contributions were introduced it was increased back up to 57 per cent from which level it rose to about 62 per cent by April 1978 and then to 67 per cent in April 1979 when the changeover to a fully pay-related system was made. Tile peak in the employer proportion was reached in April 1980 when it was only 1.5 l)oints short of 70 per cent. Since then the employer propor-tion has fallen to its present level of 61 per cent.
At the beginning of 1953 the ratio of the employer contribution for female employees to that for male employees was 0.83 while the corres-ponding ratio for the ernployee contribution was 0.58. The differences in tile rate structure for male and female employees, seem, therefore, to have taken some account of differences in the average earnings of the sexes. Recognition of these differences was important because it spread the burden of the payroll tax more equally between the sexes than would have been possible under an undifferentiated rate structure. Less importance was always given to differentiating the employer payments for each sex than to differentiating the employee payments, so that by 1963 the employer con-tribution was more or less the same for male and female employees while a significant gap still existed between the amounts payable by male and female workers. This gap, however, was much narrower in 1963 than it had been in 1953 and by 1973 it had been virtually eliminated.
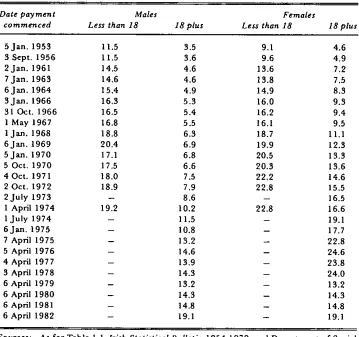
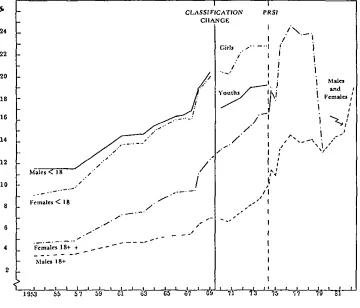
All important consequence of the use of flat-rate contributions to finance social insurance in Ireland and the convergence of the rate structure to similar payments for men and women was, as will be evident from Table 1.2 and Figure 1.1, that the principle of vertical equity in the tax system was violated and the extent to which the principle was departed from worsened until 1979 when a proportional rate structure replaced the existing flat-rate and pay-related structure.1 At the beginning of 1953 the burden of the social insurance contribution was heaviest on young persons just entering the labour force. The total contribution for males less than 18 accounted for 11.5 per cent of earnings while for females less than 18 the corresponding figure was 9.1 per cent. By 1974, the last year for which earnings data for non-aduh workers are available, the proportion of earnings by males less than 18 accounted for by the social insurance contribution was 19.2 while for females it was 22.8 per cent. Aduh male workers had higher average earnings throughout the period we are concerned with than any of the other groups identified in Table 1.2 yet the proportion of their earnings accounted for by the social insurance contribution was only 3.5 per cent in 1953 and
Table 1.2: Total social insurance contribution as a percentage of average weekly earnings of adult and non-adult male and female workers in Transportable Goods Industries,
1953-1982
Date payment Males Females
commenced Less than 18 18 plus Less than 18 18 plus
5Jan. 1953 II.5 3.5 9.1 4.6
3 Sept. 1956 I 1.5 3.6 9.6 4.9
2Jan. 1961 14.5 4.6 13.6 7.2
7Jan. 1963 14.6 4.6 13.8 7.5
6Jan. 1964 15.4 4.9 14.9 8.3
3Jan. 1966 16.3 5.3 16.0 9.8
31 Oct. 1966 16.5 5.4 16.2 9.4
1 May 1967 16.8 5.5 16.1 9.5
lJan. 1968 18.8 6.8 18.7 11.1
6Jan. 1969 20.4 6.9 19.9 12.3
5Jan. 1970 17.1 6.8 20.5 13.3
5 Oct. 1970 17.5 6.6 20.3 18.6
4 Oct. 1971 18.0 7.5 22.2 14.6
2 Oct. 1972 18.9 7.9 22.8 15.5
2July 1978 - 8.6 - 16.5
1 April 1974 19.2 10.2 22.8 16.6
1 July 1974 - 11.5 - 19.1
6Jan. 1975 - 10.8 - 17.7
7 April 1975 - 13.2 - 22.8
5 April 1976 -- 14.6 -- 24.6
4 April 1977 -- 13.9 -- 23.8
B April 1978 -- 14.3 -- 24.0
6 April 1979 -- 13.2 -- 13.2
6 April 1980 -- 14.3 -- 14.3
6 April 1981 -- 14.8 -- 14.8
6 April 1982 -- 19.1 -- 19.1
GROWTH OF THE SOCIAL INSURANCE SYSTEM 13
Figure 1.1 : Ordinary rate social insurance contributions as a percentage of average weekly
earnings in transportable goods industries on the date at which contribution rates were
changed classified by age and sex, 1953-82
24
22 20
18
16
14
12
10
8
6
4
2
I
PRS|
I /’\~ I /
GJrtJ / ...I i /’ I i
: i
/ I
MLI¢I
"~ ou~hs I" ’ ¯ and /
!
/-’
i ">..l
¯ {
~ ¯| -
.--" I [ "f
l;
10.2 per cent in 1974 compared with 4.6 per cent for aduh females in 1953 and 16.6 per cent in 1974.2 The gap between the proportion of adult male and female earnings accounted for by social insurance contributions widened from 6.4 points in 1974 to 9.7 points in 1979. This gap was eliminated in April 1979 when a fully Pay-Related Social Insurance (PRSI) system was adopted in which male and female employees paid the same proportion of their earnings into the Social Insurance Fund and tile proportion paid by the employer was the same for men and women.3 The adoption of proportional rather than flat-rate contribution rates eliminated one of the main sources of inequality in the social insurance system but the system still has features which violate the principle of vertical equity, e.g., the upper earnings limit on which contributions are payable leads to workers with high incomes pay-ing a smaller proportion in payroll tax than workers on lower incomes.4
Apart from differences in the proportion of income paid by or on bellalf of male and female and younger and older workers the other main point which is brought out by Table 1.2 in relation to the financing of social insurance in Ireland is that the proportion of average earnings accounted for by social insurance contributions has risen approximately five times from around 4 per cent in 1953 to 20 per cent in 1982. This may have occurred mainly because of the demand from the insured population for a wider range of benefits than was originally provided rather than from improvements in existing benefits. In 1961, for example, contributory old age pensions were provided for the first time and these were partly financed by increasing the flat-rate contribution so that the proportion of earnings payable by or on behalf of male employees rose from 3.6 per cent to 4.6 per cent and for
females from 4.9 per cent to 7.2 per cent. At the same time flat-rate Unem-ployment and Disability Benefit payments have been maintained at a
con-2. It will be recalled from the data in Table l.l that the employer fiat-rate contribution was almost the same for males and females throughout the period 1953-79 while there was a ~gnificant difference in the employee contributions for men and women. Relating the total contributinnJ to average earnings by age and sex rather than the employee contributions makes no difference, therefore, to the ranking of the social insurance burden by age and sex.
3. It is interesting to note from the Reports of the Department of Social Welfare 1972-75 to 1979-80 that the amount collected in pay-related contributions during the period April 1974-December 1978, £108 million, gl"eatly exceeded the amount paid out in pay-related benefit, £61 million. Since the Social Insurance Fund was in balance during this period the excess of pay-related contributions over pay-related benefits appears to have been used to replace some of the State contribution to fiat-rate benefits.
GROWTH OF THE SOCIAL INSURANCE SYSTEM 15
stant proportion of average industrial earnings from 1953 to the present as will be shown in Chapter 4.
1.3 Growth in Insured Labour Force, 1953-80
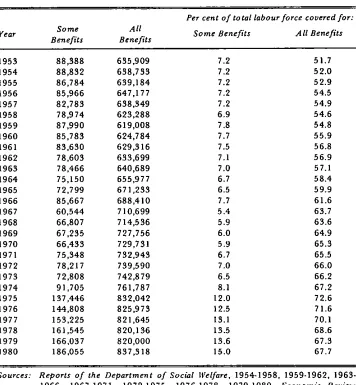
There are nine different categories under which employees covered by social insurance in Ireland are classified. The largest category refers to persons who are insured for MI Benefits while the smallest is for persons insured for Retirement, Old Age Pensions and Death Grants. The numbers included in the various categories have fluctuated over the years as new insurance pro-grammes have been introduced, income limits raised or the coverage of exist-ing programmes expanded. In this section we will focus on two categories only (i) the number insured for All Benefits and (ii) the number insured for Some Benefits. The latter are mainly public sector employees who are insured only for widows’ pension and occupational injuries benefits. The numbers in each category and the proportion which they form of the total labour force are given in Table 1.3. In 1953 there were 635,909 persons or 51.7 per cent of the labour force insured for All Benefits and 88,388 persons or 7.2 per cent of the labour force insured for Some Benefits. The number covered for All Benefits was virtually static between 1953 and 1963 although the pro-portion of the labour force covered rose from 51.7 per cent to 57.1 per cent because the number in the labour force declined from 1.2 million to 1.1 million due to large-scale emigration during the 1950s. The number covered by Some Benefits actually declined by around 10,000 during the decade 1953-63 because of a reduction in employment in the public sector. After 1963 the number covered for All Benefits increased each year until it reached 832,042 or nearly three-quarters of the labour force in 1975. Those covered for Some Benefits increased by around 7,000 between 1963 and 1966 but declined by 25,000 in the following year when some women who had previously been covered for everything except unemployment benefit had their cover extended to All Benefits. Since 1967 the number covered for Some Benefits has grown steadily as public sector employment has increased (see Sexton (1982) for details of changes in public sector employ-ment between 1961 and 1979). The proportion of the labour force covered for Some Benefits nearly tripled from 5.4 per cent in 1967 to 15.0 per cent in 1980. The big increase in the number in this category occurred in 1974
and 1975 when the income limit above which non-manual workers ceased to be insurable was abolished in 1974. The number in the All Benefits category also increased substantially because of the abolition of the income limit.5
Table 1.3: Number of persons insured for some or all benefits: actual and per cent of total iabour force, 1953-1980
YeaF Some
All Benefits Benefits
Per cent of to tal labour force covered for:
So me Benefits All Benefits
1953 88,388 635,909 7.2 51.7
1954 88,832 638,733 7.2 52.0
1955 86,784 639,184 7.2 52.9
1956 85,966 647,177 7.2 54.5
1957 82,783 638,349 7.2 54.9
1958 78,974 623,288 6.9 54.6
1959 87,990 619,008 7.8 54.8
1960 85,783 624,784 7.7 55.9
1961 83,630 629,316 7.5 56.8
1962 78,603 633,699 7.1 56.9
1963 78,466 640,689 7.0 57.1
1964 75,150 655,977 6.7 58.4
1965 72,799 671,233 6.5 59.9
1966 85,667 688,410 7.7 61.6
1967 60,544 710,699 5.4 63.7
1968 66,807 714,536 5.9 63.6
1969 67,235 727,756 6.0 64.9
1970 66,433 729,731 5.9 65.3
1971 75,348 732,943 6.7 65.5
1972 78,217 739,590 7.0 66.0
1973 72,808 742,879 6.5 66.2
1974 91,705 761,787 8.1 67.2
1975 137,446 832,042 12.0 72.6
1976 144,808 825,973 12.5 71.6
1977 153,225 821,645 13.1 70.1
1978 161,545 820,136 13.5 68.6
1979 166,037 820,000 13.6 67.3
1980 186,055 837,318 15.0 67.7
Sources: Reports of the Department of Social Welfare, 1954-1958, 1959-1962, 1963-1966, 1967-1971, 1972-1975, 1976-1978, 1979-1980, Economic Review and Outlook, 1982 and 1980, Review of 1973 and Outlook for 1974, Review of 1970 and Outlook for 1971, Economic Statistics, Budget 1965 and 1964, and information supplied by Department of Social Welfare.
GROWTH OF THE SOCIAL INSURANCE SYSTF..M 17
The proportion of the labour force covered for Some or All Benefits has risen from around 60 per cent in 1953 to over 80 per cent in 1980. This growth in coverage of the social insurance scheme has occurred mainly because of successive increases in and eventual abolition of the earnings limit used to restrict entry into the scheme and also to the decline in the importance of self-employed people in agriculture and services.
1.4 Income from Social Insurance 1953-82
1956 2,455 2.796 2,$0] 516 22 8,$18 2,297 $,0S4 1.459 1,175 1,052 9.017 -699 1956 ~,~ 1957 3,727 2.975 2,590 547 -- 9*857 3,~35 $,467 1.674 879 1,104 10~417 -5,80 1957 ~1 1958 4.527 $.091 2,697 514 SO 10,$79 $,:125 4,047 1,867 448 1,220 10,907 -28 195B O 1959 4.427 S.064 2.694 529 42 10,7 f)6 3.108 3,981 1,92t 505 1,229 10,744 ~12 1959 [-~ ~960 ~.965 3.225 2,828 D52 16 10,5,86 2,900 ~,975 1,970 ~ 446 1,252 10,54~ ",45 1960 ~-] 1961 4~666 ~,626 ~,2~6 ~64 52 12,144 2,624 4,$69 2.24~ 802 541 1.$22 I 1,901 +243 1961 1962 6,$48 5,~84 4,981 561 85 17.~59 2.B6~ 4*965 $.226 4,637 669 I,$94 17.754 "$95 1962 1965 7,648 5,734 :~.~ .~9 551 19 19.281 $.204 5,$45 3.488 4,896 629 1,509 19,124 ~157 196~ 1964 8,894 6,7~7 6,$27 542 $0~ 22,805 $.784 ~,776 4.166 5,755 790 I,S71 22.822 -17 1964 196:T 9,~99 7.639 7.~41 561 440 25.480 4,G94 7,4)9 4,750 6,466 917 1.985 25.629 -149 1965 1966 11,061 8.181 7,77~ 590 ]$0 27.757 4,455 8,025 5,177 7,04~ 965 1.97~ 2~.648 +$9 196,6 L’~ 1967 15.557 9.841 9,395 607 1~0 ~3,550 5,715 9,61~ 6,$79 B,464 1~12~ 2,21B $$.517 ~$$ 1967 1968 13.268 12.905 10,[$0 615 185 ~7,103 5,762 10.759 6,844 8.797 I,S~5 2,269 $5,746 ÷1,~57 1968 1969 14.102 15,527 12,$18 724 844 4~515 7,377 12,510 7,915 9.876 1,408 2,~65 41.449 ~ ~,066 1969 1970 15,614 18,030 14,924 951 $84 49.885 8,129 15,404 9.450 11.362 ],40~ 2,701 48,429 ~ [,454 1970 1971 20,197 2[,795 18.449 990 ~ll 61.742 [0.~56 18,897 12.126 14.286 1,681 $,017 60.653 ~ 1,079 1971 1972 26,142 25,?79 22,$15 1.166 64~ 76.045 11,808 2~,691 14.703 17,75~ ~.162 $,855 72.974 +$,071 1972 ~.] 1975 26,2S8 $0,185 25,B22 1.4~2 459 84.186 15,095 24,681 17,031 22,048 2,4?4 4,340 85.669 ’~517 1975 1974 $1.~01 41,~17 $1.124 1,621 $30 105.59~ 15,661 ~0,185 21,442 ~0,260 2,994 5.558 104.098 +1,495 1974 197~ 35.710 71,369 45,442 1.859 179 I,~2.540 24,154 45.412 27,504 41,85~ 4.757 8.022 151,465 +1,076 1975 1976 45.671 10~,277 59~996 1,889 181 210.014 43A21 60.59 ~ $4,458 55,49~ 6,403 I1.$$8 211,406 -I,$91 1976 1977 51,OIS I~1.110 73,390 1,963 220 257,698 51,407 75.735 41.680 68,422 8.04?) 14.208 259,497 -I,799 1977 1978 54.931 156.$31 85,021 ],855 270 296,406 52,121 89.947 48,$66 81.775 10.07~ 17.502 ~99,789 "3,381 1978 1979 68.471 186.496 87,509 1.491 118 344.185 ~2.124 105.478 $6,095 98.865 12.074 18.754 $4~,~88 "~797 1979 ~980 91.114 231.841 97,417 I.$56 123 ’121.851 60,963 125,962 69,705 122,204 14,414 23.259 416,505 ~’5.~50 1980 19BI 145,1 I$ 301.428 ] 16,978 2*023 290 ~65.832 102,734 IS8.598 93,227 164,094 19.747 25,742 ~64.135 -301 1981 1982 207.394 384,166e i52.945 ~,03~¢ 618 748,1:52 157.318 196.012¢ 1:~0.522 211,996 26,086e $2,318 744,2S2 ~’$.900 1982 ~J
~e: b’epor o/ Depx; mt’n a/So¢~/lett/~e, 954.1958 to197919$O, ParLiam~ta~ Dtb~tt~ D~il [~‘~t~‘ann~ ~ May ~982. c~b~ ~2$~4~and in[~rr~‘aIi~n ~uPp1i¢d by D~p~m¢m ~f Sc~
~elf~e-*VatJ: ((ii) G°’crnmen t accounu were ¢hmal~d Io a odcndar year b,,L~ in [974. F~,~ for ]975 ~ lucceedJn[ y~rs *~¢re de~ved by linear int crpolatlon. P’~ Other bent[ill include Malernhy Allowance, Ma cm y Gran . T ¢~ men Bencfi . ~¢~ened Wives’ Benefit. D~-~th Grant, and 01her [r~urlnc¢ Pa)-ment~.
"Fable 1.5: Distribution of social insurance income and expenditure, year ended 31 March, 1953-1982
INCOME PRO VIDED B Y: EXPENDITURE ON:
Interest on Disability.
Year State Employer Employee invested fundsTotal Unemployment invalldity and Sumivors" Old age Other
and other benefit occupatiorazl pensions pensions benefits
receipts injurfes benefit
Administration 7btal Year
security issued by the Department of Social Welfare in 1949 (see Depart-ment of Social Welfare, 1949). Equi-proportionate financing by the three parties involved in the social insurance system was maintained until 1957 when demands on the fund due to rising unemployment, because of the recession starting in 1956, forced the State to increase its contribution by nearly 50 per cent. As a consequence its share of the income provided went up from around 30 per cent to very nearly 40 per cent. The propor-tion of insurance income provided by the State was maintained at this level until 1967, partly due to the downturn in economic activity at the end of the 1950s and to the introduction of contributory old age pensions in 1961. A comparison of the expenditure figures for contributory and non-contributory old age pensions in Tables 1.4 and 1.6 suggests that non-contributory pensions were partly financed by the State switching some of the income it provided for pensions from the assistance to the insurance programmes. The replacement of the Workmen’s Compensation system by Occupational Injuries benefit in 1967 led to a permanent decrease in the proportion of the insurance programme financed out of general taxation and a permanent increase in the proportion financed out of the employer contribution because the employer was obliged to pay the total contribution for occupational injuries cover in line with recommendations in the Minority Report of the Commission on Workmen’s Compensation (see Farley (1964, pp. 14-15)). The downward trend in the proportion of social insurance income provided out of general taxation was reinforced in 1974 when pay-related contri-butions became part of the means of financing social insurance. This decrease in reliance on State financing of social insurance was offset by increasing reliance on employer financing of the system in order to bring "the Ex-chequer’s overall share of income maintenance expenditure more in line with practice in other EEC countries, and of making the Social Insurance Fund more self-financing" as the Minister for Finance, Mr. Ryan, said in his Budget Speech (Ireland, 1975, p. 23) in 1975. Some progress towards this objective was made in the next three years but the onset of the second oil crisis and the subsequent recession forced the State to increase its contribution to the fund to meet the rising cost of unemployment from 1979 to date. The proportion of income provided out of employee contributions remained more or less constant from 1953 to 1978 at about 30 per cent of the total. There was a decrease to 25 per cent in 1979 with the introduction of PRSI
and to 20 per cent in 1982.
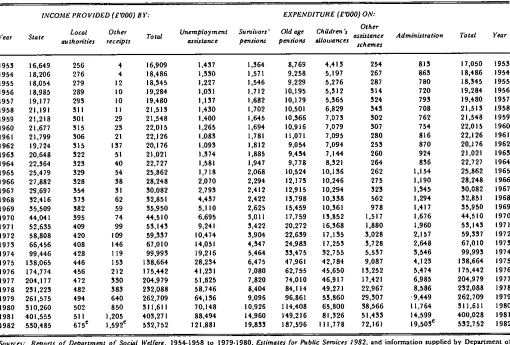
Table 1.6: Social assistance income and expenditure, year ended 31 March, 1953-1982
Year
INCOSIE PROVIDED (£~00) BY: EXPENDITURE (£~00) ON:
Other
State Local Other Total Unemployment Survivors’ Oldage Children’s assistance
authorities receipts asslstance pensions pennons allowances
schemes
Administration Total Year
1953 16,649 256 4 16,909 1,437 1,364 8,769 4,413 254 815 17,050 1993 1954 18.206 276 4 18.460 1,930 1,571 9,258 5,197 267 863 18.486 1954 1955 18,054 279 12 18,345 1,227 1,546 9,229 5,276 287 780 18,545 1955 1956 18,985 280 I0 19,284 1,051 1,712 10,195 5,312 514 720 19,284 1956 )
1957 19,177 298 tO 19,480 1,157 1,682 10,179 9,365 924 795 19,480 1957 0 1958 21,191 SII II 21,513 1,450 1,702 10,501 6,829 943 708 21,513 1958 1959 21,218 S01 29 21,548 1,400 1,645 10,366 7,075 302 762 21,548 1959 1960 21,677 315 23 22,015 1,265 1,694 10,916 7,079 307 754 22,015 1960
O 1961 21,799 306 21 22,126 1,083 1,781 11,071 7,095 280 816 22,126 1961 1962 19,724 315 197 20,176 1,093 1,812 9,094 7,094 253 870 20,176 1962 ’-1 1963 20,648 322 51 21,021 1,574 1,885 9,454 7,144 260 924 21,021 1963 1964 22,364 329 40 22,727 1,581 1,947 9,778 8,521 264 836 22,727 1964 1965 25.479 929 54 25,862 1,718 2,068 10.524 10.136 262 1.154 29,862 1965 t’3 1966 27,682 928 58 28,248 2,070 2,294 12,175 10,246 275 1,190 28,248 1966
1967 29,697 354 51 30,082 2,795 2,412 12,915 10,294 325 1,345 30,082 1967 1968 32,410 973 62 32,851 4,437 2,422 13,708 10,$30 562 1,294 32,851 1968 1969 95,909 582 99 95,950 5,110 2,625 15,459 10,361 978 1,417 35,950 1969 C 1970 44,041 395 74 44,910 6,695 3,011 17,799 13,852 1,517 1,676 44,510 1970 1971 52,635 409 99 53,143 9,241 3,422 20,272 16,368 1.880 1,960 53,143 1971
C3 1972 68,808 420 109 59,537 10,474 3,904 22,639 17,135 3,028 2,157 59,$$7 1972
1973 66,456 408 146 67,010 14,051 4,347 24,983 11,253 3,728 2,646 67,010 1973 ,~ 1974 99,446 420 119 99,993 19,216 5,464 53,475 32,755 5,537 3,546 99,993 1974 o~ 1975 138,065 446 153 198,664 28,234 6,475 47,961 42,784 9,087 4,123 138,664 1979 1976 174,774 456 212 175,442 41,231 7,080 62,755 45,650 13,252 5,474 175,442 1976 1977 204,177 472 950 204,979 51,825 7,820 74,010 46,917 17,421 6,985 204,979 1977 1976 231,223 482 383 252,088 58.746 8,404 84,114 49,271 22,967 8,586 232,088 1978 1979 261,575 494 640 262,709 64,136 9,096 96,861 53,860 29,$07 ,9,449 262,709 1979 1960 310,260 502 650 311,611 70,148 10,926 114,408 65,800 38,566 11,764 311.611 1980 1951 401,859 511 1,205 403,271 68,494 14,960 149,216 81,326 51,433 14,599 400,028 1981 1902 580,485 675e 1,592¢ 532,752 121,881 19,833 187,596 111,778 72,161 19,503¢ 532,752 1982
Sources: Reports of Department of Social Welfare, 1994-1958 to 1979-1960, Estimates for Fubh~ Services
Social Welfare.
Notes: (i) Other assistance schemes c~mpfise Social A~istanc¢ Allowanoes and Mbc¢llaneous Grants.
(ii) e - estimate based on proportion of total accounted for by thb catcgotv in previous year.
concerned. This will depend, however, on the effective incidence of the pay-roll tax. If the employer contribution is not shifted then employees and other taxpayers will have benefited at the expense of employers whereas if some of the employer contribution is shifted the burden of financing will have increased on employees with limited ability-to-pay and the progressivlty of the method of financing will have lessened. The question of the incidence of the payroll tax in Ireland will be taken up in the next chapter.
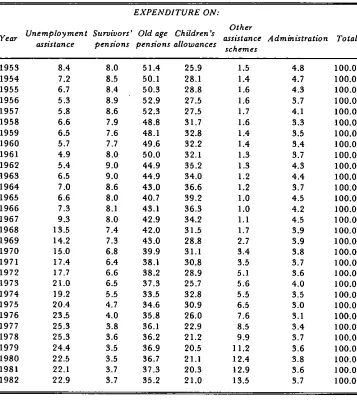
Expenditure on the main social insurance programmes for unemployment, sickness, survivorship, and old age increased rapidly between 1953 and the present. For the programmes which existed at the beginning of the period the largest increase occurred in expenditure on disability, invalidity, and occupational injuries programmes and the smallest increase was for expen-diture on other benefits. The distribution of expenexpen-diture by programme, shown in Tablc 1..5, shows that constant proportions of the total were spent on sickness (~ 30 per cent) and survivorship (~ 18 per cent) while the pro-portion spent on unemployment declined from around 30 per cent in the 1950s to less than half that by 1980 but rose again to around 20 per cent by 1982. This change is clearly related to the introduction of the contri-butory old age pension programmes because many older workers who had been in receipt of unemployment benefit prior to 1961 qualified for a contributory old age pension or a retirement pension when these programmes became operational in 1961 and 1971.
GROWTH OF THE SOCIAL INSURANCE SYSTEM 23
Table 1.7: D~$tribution of social assistance expenditure, year ended 31 March, 1953-1982
EXPENDITURE ON:
Other
Year Unemployment Survivors’ Old age Children’s assistance Administration Total assistance pensions pensions allowances
$£he~Tzes
1953 8.4 8,0 51.4 25,9 1.5 4.8 100.0
1954 7.2 8.5 50.1 28,1 1.4 4.7 100.0
1955 6.7 8.4 50.3 28.8 1.6 4.3 100,0
1956 5,3 8.9 52,9 27.5 1.6 3.7 100.0
1957 5.8 8,6 52.3 27.5 1.7 4.1 100.0
1958 6.6 7.9 48.8 31.7 1.6 3,3 100.0
1959 6.5 7.6 48.1 32.8 1,4 3.5 100.0
1960 5.7 7,7 49.6 32.2 1.4 3,4 100.0
1961 4.9 8,0 50.0 32.1 1,3 3.7 100.0
1962 5.4 9.0 44.9 35,2 1.3 4.3 100.0
1963 6.5 9.0 44.9 34.0 1.2 4,4 100.0
1964 7.0 8.6 43.0 36.6 1.2 3.7 100.0
1965 6.6 8.0 40.7 39.2 1.0 4.5 100.0
1966 7,3 8.1 43.1 36.3 1.0 4.2 100.0
1967 9.3 8.0 42.9 34.2 1.1 4.5 100.0
1968 13.5 7.4 42.0 31.5 1.7 3.9 100.0
1969 14.2 7.3 43.0 28.8 2.7 3.9 100.0
1970 15.0 6.8 39.9 31.1 3.4 3.8 100,0
1971 17,4 6.4 38.1 30.8 3,5 3.7 100,0
1972 17.7 6.6 38.2 28.9 5.1 3.6 100.0
1973 21.0 6.5 37,3 25.7 5.6 4.0 100.0
1974 19.2 5.5 33.5 32.8 5.5 3.5 100,0
1975 20.4 4.7 34.6 30,9 6,5 3.0 100.0
1976 23.5 4,0 35,8 26,0 7.6 3.1 100,0
1977 25,3 3.8 36,1 22,9 8.5 3,4 100.0
1978 25,3 3,6 36,2 21.2 9.9 3.7 100,0
1979 24.4 3.5 36.9 20.5 11,2 3,6 100,0
1980 22.5 3.5 36,7 21.1 12,4 3.8 100.0
1981 22.1 3,7 37,3 20,3 12.9 3.6 100,0
1982 22,9 3.7 35.2 21.0 13.5 3.7 100,0
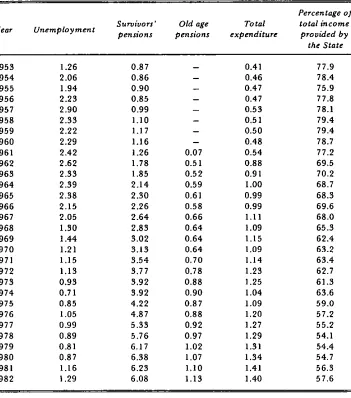
Table 1,8: Ratio of insurance to assistance expenditure on unemployment, survivors’ pensions, old age pensions, and total and percentage of total social security income
provided out of general taxation, year ended March, 1953-1982
Percentage of
Survivors’ Old age Total total income
Year Unemployment pensions pensions expenditure provided by
the State
1953 1.26 0.87 -- 0.41 77.9
1954 2.06 0,86 -- 0.46 78.4
1955 1.94 0.90 -- 0.47 75.9
1956 2.23 0,85 -- 0.47 77,8
1957 2.90 0.99 -- 0,53 78.1
1958 2.33 1.10 -- 0,51 79,4
1959 2,22 1.17 -- 0,50 79.4
1960 2.29 1.16 -- 0.48 78.7
1961 2.42 1.26 0.07 0.54 77.2
1962 2.62 1.78 0.51 0.88 69.5
1963 2.33 1.85 0.52 0.91 70.2
1964 2.39 2.14 0.59 1,00 68.7
1965 2.38 2.30 0.61 0.99 68.3
1966 2.15 2.26 0.58 0.99 69.6
1967 2,05 2.64 0.66 1.11 68.0
1968 1.30 2.83 0.64 1.09 65.3
1969 1,44 3.02 0.64 1.15 62.4
1970 1.21 3.13 0.64 1.09 63.2
1971 1,15 3.54 0,70 1.14 63.4
1972 1.13 3,77 0.78 1.23 62.7
1973 0.93 3.92 0.88 1.25 61.3
1974 0.71 3.92 0.90 1.04 63.6
1975 0.85 4,22 0.87 1.09 59.0
1976 1.05 4.87 0.88 1,20 57.2
1977 0.99 5.33 0,92 1.27 55.2
1978 0.89 5.76 0.97 1.29 54.1
1979 0.81 6.17 1,02 1.31 54.4
1980 0.87 6.38 1.07 1,34 54.7
1981 1.16 6.23 1,10 1,41 56.3
1982 1.29 6,08 1,13 1,40 57.6
Benefit due to the increase in the average duration of unemployment their only recourse in the absence of jobs was to Unemployment Assistance.
GROWTH OF THE SOCIAL INSURANCE SYSTEM 95
as the recession deepened. Survivors’ pensions were mainly provided out of the assistance scheme in the early 1950s but by the end of that decade most of the cost was met from the insurance fund. By March 1982 over six times as much was spent on contributory as on non-contributory survivor’s pen-sions. The cost of old age pensions was mainly met by general taxation during the period we are dealing with because a contributory scheme was not introduced until 1961. The contributory scheme has grown over the years as entitlement has grown and in 1979 the amount spent on contribntory old age pensions outweighed tile amount spent on non-contributory old age pensions for the first time. In the years since then expenditure on contributory old age pensions has always exceeded expenditure on non-contributory old age pensions.
An important consequence of the growth in importance of the State’s social insurance programmes, as will be seen from Table 1.8 is the decline in the proportion of total expenditure on assistance and insurance programmes financed by the State from 75 per cent in 1953 to around 60 per cent in 1982.
1.5 International Comparison of Social Security Taxes
Table 1.9: Social security contributions by employees and employers in some ,OECD countries in 1981 as a percentage of total taxation
Social security contributions by:
Total Country Employees Employers
France 10.90 29.00 39.90
Germany 15.86 19.06 34.92
The Netherlands 16.79 17.94 34.73
Sweden -- 28.51 28.51
Belgium 9.31 18.86 28.17
Italy 5.45 21.86 27.31
Japan 10.67 15.36 26.03
United States 10.25 15.53 25.78
United Kingdom 6.74 9.08 15.82
Ireland 4.85 9.24 14.09
Canada 3.99 7.33 11.32
Chapter 2
ESTIMATES OF PAYROLL TAX INCIDENCE IN IRELAND
2.1 Introduction
The familiar split in the social insurance contribution into an employer and an employee portion dates from the National Insurance Act, 1911. During the debate surrounding that Act it was argued that the Government’s intention that the employer should share part of the burden would be frustrated by the operation of market forces which would shift the employer contribution backwards onto the employee or forwards onto the consumer. Beatrice Webb, for example, tried to persuade the Royal Commission on the Poor Law, of which she was a member, that income maintenance payments during sickness, unemployment and old age, should be financed out of general taxation rather than by a charge on employers and employees because workers would end up bearing the employers’ contribution as well as their own (see HMSO, 1909, pp. 1199-1200) and Gilbert (1966, p. 270) has noted that:
Trade unionists and radicals feared that any insurance contribution by an employer would be added to his wage cost and so would be finally paid by the worker. They sought, therefore, to make any government contribution as large as possible.
In Ireland conflict over how the legal cost of social insurance should be shared among the parties that benefit from it has become particularly acute during the last decade as the Government has pursued a policy of bringing the shares of employers, employees and the Exchequer into line with the distribution of costs among these parties in other EEC countries. Since 1972, just before Ireland joined the EEC, this has resulted in a decrease in the State’s share from a third to just over a quarter, a decrease in employees share from a third to a fifth and an increase in employers share from a third to over a half.
These changes in the distribution of the legal burden of the payroll tax combined with the increase in the rate of tax for air adult male worker from 8 per cent in 1972 to just under 20 per cent at present lend particular interest to the argument that market forces could shift the employer and employee components o f the tax away from those who it was intended should pay them.
2.2 Views of lrish Commentators on Burden of Social lnsurance Contributions Some of those who have commented on the Irish payroll tax adopt a neutral stance on the incidence question or else assume that the legal and effective incidence coincide¯ Kaim-Caudle (1964, p. 23), for example, took a neutral position when he argued that:
Social security contributions, irrespective of whether they are paid by employers or employees are a pay roll tax on wages - highly regressive in their incidence
whereas O’Hagan (1977, p. 28) accepted that there was no difference between the legal and effective incidence when he conducted his analysis of employers’ social welfare contributions by "assuming the employer must bear the cost" and the Committee of the Irish Council of the European Movement, which commissioned his report, agreed with him when it asserted (O’Hagan, pp. 7-8) that:
¯ . . given free labour flows, the elasticity of supply of labour is in the long run very high, then the incidence of the tax falls on the employer who will either reduce the scale of his activities or sub-stitute capital for labour by way of reaction¯ This view implies that social welfare contributions are a tax on employment.
Dowling (1977, p. 46) also appeared to share this view when he pointed to the consequences of the flat rate social insurance contribution for employ-ment "... especially if the tax is borne by the employer". A similar position on the incidcncc question was taken by Walsh (1978). In his discussion of the growing gap between total labour costs and take-home pay he reviewed the arguments concerning the shifting of the employer’s social insurance contribution and noted the difficulty which employers in cxposed sectors of small open economies face in passing the tax onto consumers through increased prices. He doubted the relevance of Brittain’s (1971) evidence from an international cross-section study on data for the 1950s that all of the payroll tax is shifted to labour in the form of reduccd take-home pay on the grounds that in Ireland in the 1970s (Walsh, 1978, p. 4.5):
¯ . . employees increasingly bargain in terms of net or take-home pay, and resist any erosion of income due to higher taxes or other levies. To the extent that this resistance is successful, increases in the gap between take-home pay and total costs.., will tend to have employment-depressing effects.
PAYROLL TAX INCIDENCE 29
it will be completely elastic over the relevant range and this implies that the burden of the tax will fall entirely on employers while the adverse effect on employment will bc greater than would be the case if some of the burden
was bornc by employees.
In view of the potential importance of the incidence of the payroll tax for employment in Ireland, Walsh (1978) pointed to the need for further work on the effects of the tax on the price of labour and employment. O’Casaide (1978) has analysed the effect of employer and employee taxes on employ-ment in Transportable Goods Industries. He found that the labour supply curve is not completely elastic and that taxes affecting both the demand for and supply of labour do reduce employment. Unfortunately it is not possible to say anything about the effect of these taxes on the price of labour because of the way in wbich his model is spccified. Kirwan (1979) has examined the effects of chalages in the ratio of non-wagc to wage costs on employment and average hours worked ill Irish manufacturing industry. The employer social insurance contribution is the main non-wage cost involved. He found that an increase in the fixed to variable labour cost ratio led to an increase in average hours worked and a decrease in employment as predicted by the standard cost minimising model of thc firm’s demand for labour. Kirwan’s estimates of the elasticities of demand for men and hours with respect to the fixed/variable wage cost ratio arc -0.03 and 0.02. Using these figures he estimates that a reduction of£1 per week in the cmploycr’s social insurance contribution in mid-1977 would havc led to tile crcation of 1,200 extra jobs in manufacturing industry. In percentage terms this would mean that a 17 per cent reduction in thc employer contribution would have increased thc numbcr employcd in manufacturing by just over a half of one per cent.
The effects of the employer and employee componcnts of the payroll tax on the price of labour have been looked at by Bradley and Cassidy (1979) in thc context of the Phelps-Friedman cxcess demand-price expectations version of the Phillips curve which was made operational by Parkin, Sumner and Ward (1976). This model incorporates variables for employer payroll taxes and employee personal disposable income (i.e., income after deduct-ing income tax and social insurance contributions). Usdeduct-ing annual data for the period 1959-76 they found that the coefficient of the disposable income variable had the wrong sign and that changes in the employer social insurance tax variablc had no discernible effect on the rate of change of average earn-ings in industry or services.
contribution system, the rates of return accruing to different groups of contributors and the extent to which wage-cost increases are attributable to payroll tax increases.
2.3 A Model of Payroll Tax Incidence
The two main approaches to measuring the incidence of the payroll tax are the labour demand approach and the Phillips curve approach. In the first a labour demand equation is derived from a production function and expressed in a way which enables an indirect estimate to be made of the effect of the payroll tax on factor shares, the real wage or the demand for labour. The second approach uses a Phillips curve framework in which to examine the effects of changes in the employer and employee components of the pay-roll tax on wages. The amount of the tax which is shifted is indicated by the coefficients of the tax variables.
In the last decade or so around a dozen empirical studies of payroll tax incidence have been carried out for other countries in which both the labour demand and Phillips curve approaches were used. A curious feature of the results has been that many of the labour demand studies, including one which the author did in an earlier draft of this paper, found tax shifting co-efficients significantly greater than the theoretical maximum of 1 while the Phillips curve studies yielded estimates which Holmlund (1981, p. 24) described as "ambiguous to an embarrassing degree" because some researchers found that the employer component of the tax was completely shifted back within a fairly short period while others found no evidence of backward shifting at all.6 Holmlund argues that the ambiguity of the tax shifting results in the Phillips curve framework is due to dealing with multi-collinearity in the wage equation by including only one of the two payroll tax variables and to the failure to include a consumer price variable as well as an output price variable in the wage equation. He developed a model (see Holmlund 1983) based on Parkin, Sumner and Ward’s framework to deal with these problems and using annual data for the period 1950-79 estimated that about half of the post-war increases in the employer payroll tax in Sweden were directly shifted back onto labour as lower wage increases whereas increases in employees income tax were not shifted at all. It is possible, with some modifications, to apply Holmlund’s model to the quarterly data which are available on wages, prices and taxes for Transportable Goods
6. A survey of the labour demand and Phillips curve studies of payroll tax incidence is given in
Hughes (1982b, Olapter 6) together with an analysis of the Irish payroll tax in a labour demand
frame-work. The estimate of the tax shifting coefficient for Transportable Goods Industries suggested that
more than 100 per cent of the total payroll tax was shifted to labour and it was acknowledged that
PAYROLL TAX INCIDENCE 31
Industries to get estimates of payroll tax incidence for the manufacturing sector in Ireland.
Assume a Cobb-Douglas production function of the form
Q = AN~exr (2.1)
where Q is output, N is labour input and r is time. The time coefficient reflects growth in capital and knowledge. Define the profit function, lr,
as
n = PqQ- W(1 + S)N- F (2.2)
where Pq is the price of output, W is the wage rate, S is the employer payroll tax rate and F includes capital costs and fixed costs. The labour demand function for a profit maximising firm is derived by differentiating the profit function with respect to labour input and solving the resulting equation for N. Thus,
~rr = p otANa-l eXr_ W(I + S)= 0 (2.3) aN q
and 1
ND=
W(I+
(2.4)
Pq~Aexr
The firm’s demand for labour depends, according to Equation (2.4) on the ratio of the total cost of labour (including the employer payroll tax and any fringe benefits, such as occupational sick pay or pension benefit, paid by the firm) to the price of the firm’s output, the efficiency with which it organises production, and the rate of growth of its capital stock. Taking natural logarithms of Equation (2.4) gives
~nND = eD£nW +eD£n(1 +S)- eD£nPq - eDXr- eo£n(aA) (2.5)
since 1 = eD, the price elasticity of demand for labour.ct-i
Regarding the supply of labour by employees Holmlund notes that it depends on the ratio of the net wage received by employees to the price they have to pay for consumption goods. The relationship between the amount of labour supplied and the after-tax real wage can be written in general form as
)
(2.6)
Ns
c
Since 31 (2.7) as
after payment of income tax and social insurance contributions and Pc is an index of consumer prices. The labour supply function can be linearised by taking natural logarithms of both sides. Hence
~nNs =130 +3! ~n(~) (2.7)
c
= es, the price elasticity of labour supply, we can write Equation
~nNs =30 +es~nw+e$~n(l- T)- e ~nPe (2.8)
As the wage level is set by bargaining between trade unions and employers it is assumed that the participants in the labour market adjust wages so that changes in the excess demand for labour, given the expected behaviour of prices and taxes, eliminates all or part of recently observed excess demand for labour. Holmlund proposes the disequilibrium reaction function shown in Equation (2.9) to capture this adjustment towards equilibrium in the labour market
D) = _ u n(N ) +
Ns(2.9)
where rt is a stochastic error term whose presence reflects the failure of labour market participants to predict with certainty the consequences of their actions for labour demand and supply. The money wage path is derived by differentiating Equations (2.5) and (2.8), substituting into Equation (2.9) and solving for the logarithmic rate of wage change.
dl~nW-eDx - eD dlh,(l +S)+ e, dQn(l_T)_eD_~_e i~n(~.~)
eD-es ED-es ~’D - es
eD e5 n
(2.10)
+-- dQnP- d~nP +
eD_es q eD_es c eD-~s
Equation (2.10) implies certain restrictions on the coefficients which can be specified more easily if we re-write it as follows:
N d~nW = 71 + 72d£n(1 + S) + 7sdl~n(1 - T) + 74~n(~) +
75d~nPq + 76 d.~nPc
(2.11)
e D k - eD es /.1 y
where ’71 = eD-es 72-eD_es T3 eD_es, T4