Original Article
Association of EPHX1 Tyr113His
polymorphism with the susceptibility to lung cancer
Yang Chen
1*, Jiyuan Tian
2*, Feng Qin
3*, Ping Wang
11Department of Respiratory Medicine, 306th Hospital of PLA, Beijing 100101, China; 2Department of Respiratory Medicine, First People’s Hospital of Ji’nan, Ji’nan 250011, China; 3Outpatient Department of Xiaoxitian, 309 Hospital of The Chinese PLA, Beijing 100082, China. *Co-first authors.
Received October 26, 2015; Accepted August 15, 2016; Epub September 15, 2016; Published September 30, 2016
Abstract: Background and objectives: Many factors have been identified as the susceptible candidates for lung can -cer (LC), including EPHX1 genetic polymorphisms. Relevant researches have been carried out to explore the asso-ciation between EPHX1 Tyr113His polymorphism and LC risk, but their findings were controversial rather than con -clusive. Therefore, a meta-analysis was performed to systematically combine these inconsistent results. Methods: The databases of PubMed, EMBASE, BIOSIS and CNKI were searched for relevant articles. The intensity of the association between EPHX1 Tyr113His polymorphism and LC susceptibility was estimated by pooled odds ratios
(ORs) with the 95% confidence intervals (95% CIs). Inter-heterogeneity was examined with Q-test, and sensitivity
analysis was performed to detect whether there was any study possessing substantial impact on combined results. Publication bias among selected studies was inspected with Begg’s funnel plot and Egger’s test. Results: There was
no significant association between EPHX1 Tyr113His polymorphism and LC susceptibility in overall analysis, but a
positive relationship between them was found in Asian group after stratified analysis by ethnicity under CC vs. TT
(OR=1.55, 95% CI=1.26-1.90), CC vs. TT+TC (OR=1.43, 95% CI=1.19-1.71) and C vs. T (OR=1.27, 95% CI=1.13-1.41) genetic models. Conclusion: EPHX1 Tyr113His polymorphism may be related to enhanced risk of LC in Asian populations, and this association needs to be further discussed in later studies.
Keywords: Lung cancer, microsomal epoxide hydrolase, EPHX1, polymorphism
Introduction
Lung cancer (LC), one of the most common
malignancies in human, gravely jeopardizes
human health and lives, and ranks a leading
position among cancers in terms of its rising
incidence and morbidity rate globally [1].
According to International Agency for Research
on Cancer, in 2008, the number of new LC
cases was 1.6 million, accounting for 13% of
the total new cancer cases, and LC-related
deaths was 1.4 million, taking up 18% of the
total cancer-related deaths [2]. Although the
smoking rate of Chinese women is less than
4%, the incidence rate of LC in them is higher
than the world average, and shows an
increas-ing tendency each year [3]. Numerous data
have demonstrated that risk factors for LC
include smoking, air pollution and occupational
exposure to harmful substances such as
asbes-tos, chromium and nickel, among which the
smoking presents a major cause for LC onset
[4]. Among the total deaths caused by LC, 80%
of the male cases are induced by smoking while
in women the figure is at least 50% [5]. These
environmental factors including smoking,
how-ever, can not explain all LC cases, indicating
significant functions of genetic elements on the
initiation and progression of the carcinoma.
Microsomal epoxide hydrolase (mEH) is an
important metabolic enzyme involved in body
bioconversion of exogenous chemicals [6, 7].
As a key antioxidant enzyme, mEH offers
pro-tection against oxidation in lung and express-
es in bronchial epithelial cells [8, 9]. In
EPHX1
,
the encoding gene of mEH enzyme, common
single nucleotide polymorphism can affect
the activity of the enzyme. Researches have
been carried out on the association between
Tyr113His polymorphism in moderate smokers
[10]. Meanwhile, the research by Wang et al.
revealed that the variant genotype of
EPHX1
Tyr113His polymorphism enhanced individual
susceptibility to LC compared with the wild
homozygote [11].
Considering these controversial results from
previous reports about the association between
EPHX1
Tyr113His polymorphism and LC risk,
we conducted this meta-analysis to achieve a
more comprehensive conclusion.
Materials and methods
Literature sources
All relevant publications were identified from
the electronic databases of PubMed, EMBASE,
BIOSIS and CNKI with the combination of key
terms “lung cancer” or “primary bronchogenic
carcinoma”, “microsomal epoxide hydrolase” or
“mEH” or “EPHX1” or “EPOX” or “HYL1”, and
“polymorphism” or “mutation” or “variant”. The
references of relevant papers were manually
searched for additional articles.
Inclusion and exclusion criteria
[image:2.612.97.521.69.497.2]Every selected report had to satisfy the
follow-ing criteria: (1) with a case-control design; (2)
using validated genotyping methods; (3)
dem-onstrating sufficient data about genotype
dis-tribution in both case and control groups; and
(4) restricted to human beings. Articles were
eliminated if they belonged to letter, editorial,
conference abstract, review article or case-only
study.
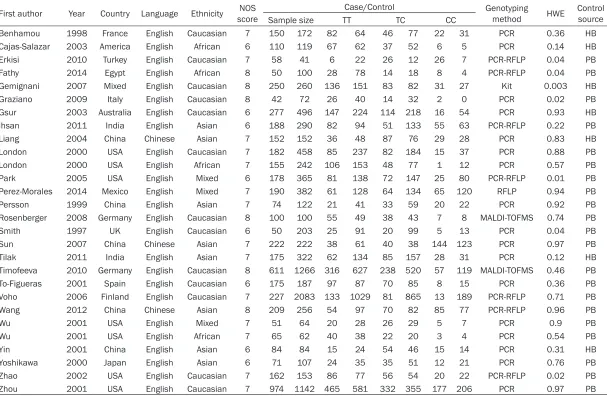
Table 1. Essential information of the included studies
First author Year Country Language Ethnicity scoreNOS Case/Control Genotyping method HWE Control source
Sample size TT TC CC
Benhamou 1998 France English Caucasian 7 150 172 82 64 46 77 22 31 PCR 0.36 HB
Cajas-Salazar 2003 America English African 6 110 119 67 62 37 52 6 5 PCR 0.14 HB
Erkisi 2010 Turkey English Caucasian 7 58 41 6 22 26 12 26 7 PCR-RFLP 0.04 PB
Fathy 2014 Egypt English African 8 50 100 28 78 14 18 8 4 PCR-RFLP 0.04 PB
Gemignani 2007 Mixed English Caucasian 8 250 260 136 151 83 82 31 27 Kit 0.003 HB
Graziano 2009 Italy English Caucasian 8 42 72 26 40 14 32 2 0 PCR 0.02 PB
Gsur 2003 Australia English Caucasian 6 277 496 147 224 114 218 16 54 PCR 0.93 HB
Ihsan 2011 India English Asian 6 188 290 82 94 51 133 55 63 PCR-RFLP 0.22 PB
Liang 2004 China Chinese Asian 7 152 152 36 48 87 76 29 28 PCR 0.83 HB
London 2000 USA English Caucasian 7 182 458 85 237 82 184 15 37 PCR 0.88 PB
London 2000 USA English African 7 155 242 106 153 48 77 1 12 PCR 0.57 PB
Park 2005 USA English Mixed 6 178 365 81 138 72 147 25 80 PCR-RFLP 0.01 PB
Perez-Morales 2014 Mexico English Mixed 7 190 382 61 128 64 134 65 120 RFLP 0.94 PB
Persson 1999 China English Asian 7 74 122 21 41 33 59 20 22 PCR 0.92 PB
Rosenberger 2008 Germany English Caucasian 8 100 100 55 49 38 43 7 8 MALDI-TOFMS 0.74 PB
Smith 1997 UK English Caucasian 6 50 203 25 91 20 99 5 13 PCR 0.04 PB
Sun 2007 China Chinese Asian 7 222 222 38 61 40 38 144 123 PCR 0.97 PB
Tilak 2011 India English Asian 7 175 322 62 134 85 157 28 31 PCR 0.12 HB
Timofeeva 2010 Germany English Caucasian 8 611 1266 316 627 238 520 57 119 MALDI-TOFMS 0.46 PB
To-Figueras 2001 Spain English Caucasian 6 175 187 97 87 70 85 8 15 PCR 0.36 PB
Voho 2006 Finland English Caucasian 7 227 2083 133 1029 81 865 13 189 PCR-RFLP 0.71 PB
Wang 2012 China Chinese Asian 8 209 256 54 97 70 82 85 77 PCR-RFLP 0.96 PB
Wu 2001 USA English Mixed 7 51 64 20 28 26 29 5 7 PCR 0.9 PB
Wu 2001 USA English African 7 65 62 40 38 22 20 3 4 PCR 0.54 PB
Yin 2001 China English Asian 6 84 84 15 24 54 46 15 14 PCR 0.31 HB
Yoshikawa 2000 Japan English Asian 6 71 107 24 35 35 51 12 21 PCR 0.76 PB
Zhao 2002 USA English Caucasian 7 162 153 86 77 56 54 20 22 PCR-RFLP 0.02 PB
Zhou 2001 USA English Caucasian 7 974 1142 465 581 332 355 177 206 PCR 0.97 PB
Quality assessment
We adopted the Newcastle-Ottawa Scale (NOS)
to evaluate the quality of all included studies.
NOS assesses study quality from 3 aspects:
selection, comparability and exposure, and has
a maximum score of 9. According to NOS score,
studies can be deemed as high-quality,
medi-um-quality and poor-quality when their scores
are more than 6, between 4 and 6, and less
than 4, respectively.
Data extraction
The essential information of included studies
were separately extracted by two reviewers
fol-lowing the same standard, and consisted of
first author’s name, publication year, original
country, ethnicity, source of control, genotyping
method, numbers of cases and controls as
well as genotype distribution in case and
con-trol groups. Any disagreement was resolved
through discussion between the two reviewers
in this extraction process. As for studies in-
cluded in one article, their information was
extracted separately.
Statistical analysis
The strength of the association of
EPHX1
Tyr113His polymorphism with LC susceptibility
was evaluated by combined odds ratios (ORs)
with their corresponding 95% confidence
inter-vals (95% CIs). Chi-square-based Q-test was
employed to investigate the heterogeneity be-
tween included studies, and its value of
P
<
0.05 or not meant the existence or absence of
significant heterogeneity, determining the use
of random- or fixed-effects model for ORs
calculation. Sensitivity analysis was operated
through deleting one single study each time to
observe alterations in pooled results. Begg’s
funnel plot and Egger’s linear regression test
detected inter-study publication bias visually
and statistically [12, 13].
Results
Characteristics of the included studies
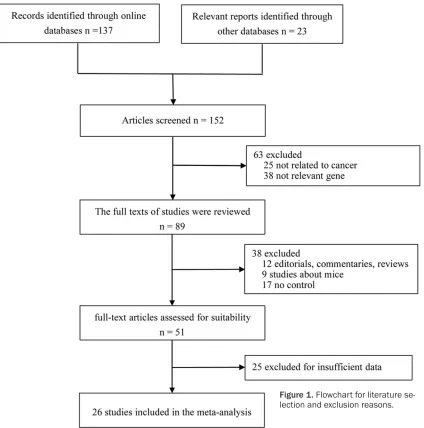
A total of 160 potentially relevant publications
were retrieved from the above databases, and
109 ones in them were excluded for duplicates
(8), editorials, commentaries and reviews (12),
about mice (9), no controls (17), not related to
LC (25) or the
EPHX1
gene (38). Finally, 26
eli-gible papers were included in this
meta-analy-sis after 25 more were eliminated for without
sufficient data in further screening [10, 11,
14-37]. The flowchart of
Figure 1 manifests
the detailed process of literature selection and
particular reasons for study exclusion. In
addi-tion, the main information of these eligible
articles is displayed in Table 1.
Besides, NOS scores for the eligible studies
are also displayed in Table 1. The analysis re-
sults showed that the included studies were
considered as high and medium quality.
Meta-analysis results
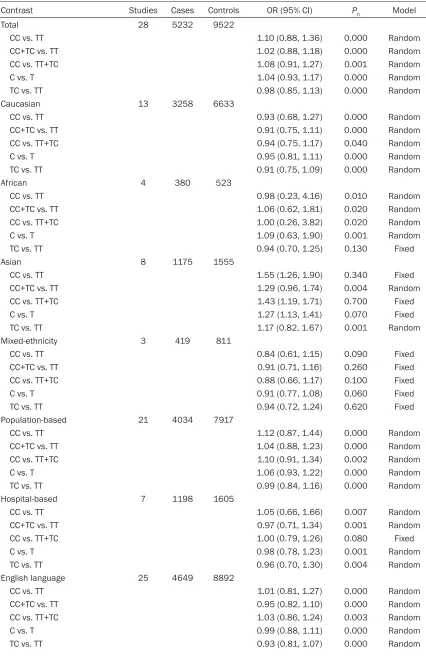
Table 2 contains the results from statistical
analyses in this study.
EPHX1
Tyr113His
poly-morphism, overall, expressed no significant
association with LC susceptibility, but in Asian
subgroup after stratification analysis by
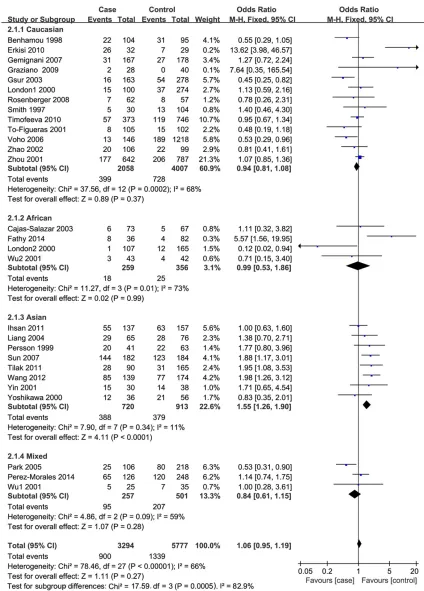
ethnic-ity, it was related to increased risk of LC under
CC vs. TT (OR=1.55, 95% CI=1.26-1.90) (Figure
2), CC vs. TT+TC (OR=1.43, 95% CI=1.19-1.71)
and C vs. T (OR=1.27, 95% CI=1.13-1.41) ge-
netic contrasts.
The subgroup analysis based on publication
languages was conducted in the present study.
The results demonstrated that in
Chinese-language studies,
EPHX1
Tyr113His
polymor-phism showed significant association with LC
risk under under all five comparisons after
stratification analysis by published language
(Table 2).
In addition, we also evaluate the association
between
EPHX1
Tyr113His polymorphism and
LC risk based on the quality scores, HWE,
geno-typing method and sample size. Analysis results
indicated that
EPHX1
Tyr113His polymorphism
did not show significant correlation with LC risk
based on the above factors (Table 2).
There was significant heterogeneity in overall
analysis of the association between
EPHX1
Table 2.
EPHX1
Tyr113His polymorphism and LC susceptibility
Contrast Studies Cases Controls OR (95% CI) Ph Model
Total 28 5232 9522
CC vs. TT 1.10 (0.88, 1.36) 0.000 Random
CC+TC vs. TT 1.02 (0.88, 1.18) 0.000 Random
CC vs. TT+TC 1.08 (0.91, 1.27) 0.001 Random
C vs. T 1.04 (0.93, 1.17) 0.000 Random
TC vs. TT 0.98 (0.85, 1.13) 0.000 Random
Caucasian 13 3258 6633
CC vs. TT 0.93 (0.68, 1.27) 0.000 Random
CC+TC vs. TT 0.91 (0.75, 1.11) 0.000 Random
CC vs. TT+TC 0.94 (0.75, 1.17) 0.040 Random
C vs. T 0.95 (0.81, 1.11) 0.000 Random
TC vs. TT 0.91 (0.75, 1.09) 0.000 Random
African 4 380 523
CC vs. TT 0.98 (0.23, 4.16) 0.010 Random
CC+TC vs. TT 1.06 (0.62, 1.81) 0.020 Random
CC vs. TT+TC 1.00 (0.26, 3.82) 0.020 Random
C vs. T 1.09 (0.63, 1.90) 0.001 Random
TC vs. TT 0.94 (0.70, 1.25) 0.130 Fixed
Asian 8 1175 1555
CC vs. TT 1.55 (1.26, 1.90) 0.340 Fixed
CC+TC vs. TT 1.29 (0.96, 1.74) 0.004 Random
CC vs. TT+TC 1.43 (1.19, 1.71) 0.700 Fixed
C vs. T 1.27 (1.13, 1.41) 0.070 Fixed
TC vs. TT 1.17 (0.82, 1.67) 0.001 Random
Mixed-ethnicity 3 419 811
CC vs. TT 0.84 (0.61, 1.15) 0.090 Fixed
CC+TC vs. TT 0.91 (0.71, 1.16) 0.260 Fixed
CC vs. TT+TC 0.88 (0.66, 1.17) 0.100 Fixed
C vs. T 0.91 (0.77, 1.08) 0.060 Fixed
TC vs. TT 0.94 (0.72, 1.24) 0.620 Fixed
Population-based 21 4034 7917
CC vs. TT 1.12 (0.87, 1.44) 0.000 Random
CC+TC vs. TT 1.04 (0.88, 1.23) 0.000 Random
CC vs. TT+TC 1.10 (0.91, 1.34) 0.002 Random
C vs. T 1.06 (0.93, 1.22) 0.000 Random
TC vs. TT 0.99 (0.84, 1.16) 0.000 Random
Hospital-based 7 1198 1605
CC vs. TT 1.05 (0.66, 1.66) 0.007 Random
CC+TC vs. TT 0.97 (0.71, 1.34) 0.001 Random
CC vs. TT+TC 1.00 (0.79, 1.26) 0.080 Fixed
C vs. T 0.98 (0.78, 1.23) 0.001 Random
TC vs. TT 0.96 (0.70, 1.30) 0.004 Random
English language 25 4649 8892
CC vs. TT 1.01 (0.81, 1.27) 0.000 Random
CC+TC vs. TT 0.95 (0.82, 1.10) 0.000 Random
CC vs. TT+TC 1.03 (0.86, 1.24) 0.003 Random
C vs. T 0.99 (0.88, 1.11) 0.000 Random
Chinese language 3 583 630
CC vs. TT 1.81 (1.35, 2.43) 0.672 Fixed
CC+TC vs. TT 1.70 (1.32, 2.21) 0.821 Fixed
CC vs. TT+TC 1.43 (1.12, 1.83) 0.475 Fixed
C vs. T 1.46 (1.23, 1.75) 0.319 Fixed
TC vs. TT 1.57 (1.16, 2.12) 0.962 Fixed
High quality 20 4099 7671
CC vs. TT 1.25 (0.97, 1.60) 0.000 Random
CC+TC vs. TT 1.13 (0.95, 1.34) 0.000 Random
CC vs. TT+TC 1.17 (0.97, 1.40) 0.011 Random
C vs. T 1.13 (0.98, 1.29) 0.000 Random
TC vs. TT 1.07 (0.92, 1.26) 0.000 Random
Medium quality 8 1133 1851
CC vs. TT 0.77 (0.55, 1.07) 0.128 Fixed
CC+TC vs. TT 0.70 (0.46, 1.06) 0.370 Fixed
CC vs. TT+TC 0.87 (0.60, 1.26) 0.031 Random
C vs. T 0.81 (0.53, 1.25) 0.337 Fixed
TC vs. TT 0.74 (0.48, 1.13) 0.079 Fixed
Not conforming HWE 7 790 1194
CC vs. TT 1.86 (0.84, 4.10) 0.000 Random
CC+TC vs. TT 1.28 (0.81, 2.04) 0.000 Random
CC vs. TT+TC 1.51 (0.82, 2.76) 0.002 Random
C vs. T 1.30 (0.87, 1.95) 0.000 Random
TC vs. TT 1.15 (0.77, 1.72) 0.004 Random
Conforming HWE 21 4442 8328
CC vs. TT 1.03 (0.84, 1.27) 0.001 Random
CC+TC vs. TT 0.98 (0.84, 1.13) 0.000 Random
CC vs. TT+TC 1.06 (0.90, 1.24) 0.028 Random
C vs. T 1.00 (0.89, 1.12) 0.000 Random
TC vs. TT 0.95 (0.82, 1.10) 0.000 Random
PCR-RFLP 7 1072 3288
CC vs. TT 1.41 (0.74, 2.69) 0.000 Random
CC+TC vs. TT 1.25 (0.78, 2.01) 0.000 Random
CC vs. TT+TC 1.27 (0.79, 2.05) 0.000 Random
C vs. T 1.27 (0.87, 1.86) 0.000 Random
TC vs. TT 1.11 (0.71, 1.75) 0.000 Random
PCR 17 3009 4226
CC vs. TT 1.05 (0.80, 1.38) 0.005 Random
CC+TC vs. TT 1.00 (0.84, 1.18) 0.001 Random
CC vs. TT+TC 1.03 (0.84, 1.28) 0.061 Fixed
C vs. T 1.00 (0.88, 1.14) 0.000 Random
TC vs. TT 0.99 (0.84, 1.16) 0.016 Random
Other method for genotyping 4 1151 2008
CC vs. TT 1.05 (0.83, 1.33) 0.754 Fixed
CC+TC vs. TT 0.97 (0.84, 1.12) 0.542 Fixed
CC vs. TT+TC 1.07 (0.86, 1.33) 0.878 Fixed
C vs. T 1.00 (0.89, 1.12) 0.458 Fixed
TC vs. TT 0.95 (0.81, 1.11) 0.710 Fixed
Samples no more than 200 9 595 752
CC+TC vs. TT 1.43 (0.93, 2.19) 0.001 Random
CC vs. TT+TC 1.46 (0.92, 2.32) 0.089 Fixed
C vs. T 1.34 (0.96, 1.87) 0.000 Random
TC vs. TT 1.31 (0.89, 1.92) 0.017 Random
Samples between 201-500 11 1748 2318
CC vs. TT 1.11 (0.79, 1.57) 0.002 Random
CC+TC vs. TT 0.95 (0.72, 1.24) 0.000 Random
CC vs. TT+TC 1.20 (0.94, 1.54) 0.069 Fixed
C vs. T 1.00 (0.82, 1.22) 0.000 Random
TC vs. TT 0.89 (0.68, 1.16) 0.000 Random
Samples more than 500 8 2889 6452
CC vs. TT 0.86 (0.66, 1.10) 0.016 Random
CC+TC vs. TT 0.93 (0.80, 1.09) 0.011 Random
CC vs. TT+TC 0.88 (0.72, 1.08) 0.078 Fixed
C vs. T 0.93 (0.81, 1.07) 0.002 Random
TC vs. TT 0.96 (0.83, 1.10) 0.088 Fixed
Notes: OR, Odds ratio; 95% CI, 95% confidence interval; Random, Random-effects model; Fixed, Fixed-effects model; Ph, P -value of heterogeneity test; HWE, Hardy-Weinberg equilibrium.
Sensitivity analysis
No study was detected to have pivotal influ-
ence on pooled results in sensitivity analysis
(Figure 3), showing statistical robustness of
the findings.
Publication bias investigation
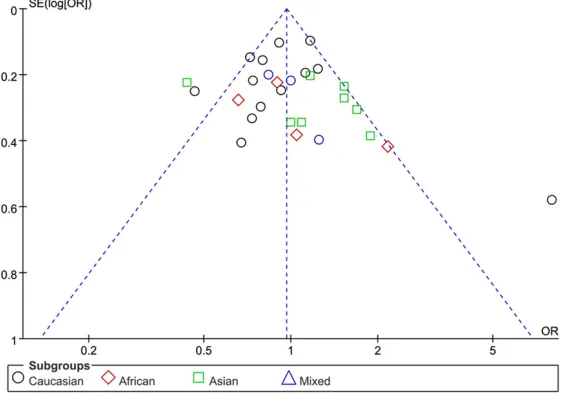
Symmetrical shapes of Begg’s funnel plots
for publication bias under all genetic models
implied the absence of significant bias (Figure
4), and Eggers’ test provided statistical
evi-dence for these results (data not shown).
Discussion
LC is a complicated disease involving various
factors and multiple stages in its incidence and
development. In the identification of LC risk
factors, the polymorphisms in
EPHX1
gene
have been proposed to be related to the
sus-ceptibility to the carcinoma. The enzyme mEH,
encoded by
EPHX1
gene, exists in
cytomicro-somes and lung tissues, and is widely involved
in the metabolism of multiple environmental
carcinogens [38, 39]. The mEH enzyme par-
ticipates in the metabolism of epoxides with
high reactivity, and its low activity may be a
susceptible factor for antiepileptic drug
syn-drome [40]. Considerable findings have
con-firmed the Tyr113His polymorphism in exon 3
of
EPHX1
gene can affect mEH activity. Speci-
fically, the variation of T→C in this
polymor-phism leads to the substitution of tyrosine (Tyr)
by histidine (His), which can reduce the activity
of its enzyme by 40%-50% compared with its
wild genotype [41, 42]. Moreover, the
polymor-phism has been suggested to be a risk factor
in individuals susceptible to hepatocellular
car-cinoma, and related to high incidence rate of
colorectal carcinoma [43]. Similarly, the variant
Tyr113His may change individual susceptibility
to carcinogen effects via its influence on
enzy-matic activity so as to affect LC risk in different
people.
Caucasian-Figure 2. Forest plot for the association between EPHX1 Tyr113His polymorphism and LC susceptibility after
strati-fied analysis by ethnicity under CC vs. TT contrast.
Americans with a decreased risk of LC [24].
[image:8.612.93.517.68.659.2]sample sizes, various selection criteria for
cases and controls as well as potential
influ-ences of other risk factors, gene-gene and
gene-environment interactions on LC. Besides,
mEH functions are bi-directional and overlap
with other metabolic enzymatic substrates,
which makes mEH exert different functions in
populations exposed to various environmental
factors.
Statistically combining these contradictory
find-ings, our study, containing 5232 cases and
9522 controls, observed no significant
associa-tion between
EPHX1
Tyr113His polymorphism
[image:9.612.93.371.76.264.2]results from sensitivity analysis and publica-
tion bias investigation. Still, it is advisable to
interpret these outcomes with prudence be-
cause of some restrictions in this
meta-analy-sis. Literature searching limitations in langu-
age and source might cause pertinent reports
missed which were published in other
languag-es or sourclanguag-es. Additionally, not all eligible
arti-cles stated adjusted ORs. Moreover, the
sam-ple size of African population was relatively
small. Furthermore, as mentioned before, LC
occurrence and progression present
polyfacto-rial courses, and one single aspect was
insuffi-cient to completely expound its exact etiology,
Figure 3. Sensitivity analysis for the stability of the results.Figure 4. Begg’s funnel plot for publication bias.
and LC susceptibility in over-
all analysis and in subgroup
analysis by source of control,
quality score, HWE,
genotyp-ing method and sample size,
but found a positive rela-
tionship in Asian group after
stratified analysis by ethni-
city under CC vs. TT, CC vs.
TT+TC and C vs. T genetic
models. Additionally, the
sig-nificant association was also
observed in Chinese-langu-
age studies after stratifica-
tion analysis by published
language under all five
con-trasts. These results
indicat-ed the
EPHX1
Tyr113His
poly-morphism might be asso-
ciated with increased risk of
LC in Asian populations and
Chinese-language studies. In
the overall analysis of the
association between
EPHX1
Tyr113His polymorphism and
LC risk, Q-test revealed sig-
nificant heterogeneity among
selected studies which might
originate from diverse
geno-type distributions among
eth-nic groups, various selection
criteria for samples, different
cancer types and genotyping
methods.
[image:9.612.93.374.314.511.2]so relevant risk factors should be incorporated
in such researches. But in this study, this
respect was not encompassed.
In conclusion, we found a remarkable effect of
EPHX1
Tyr113His polymorphism on increased
risk of LC in Asian populations. Due to the
above limitations and discrepancies with
previ-ous reports, our findings should be verified in
future through well-designed studies
possess-ing more samples as well as gene-gene and
gene-environment interactions.
Disclosure of conflict of interest
None.
Address corresponding to: Ping Wang, Department of Respiratory Medicine, 306th Hospital of PLA, Beijing 100101, China. E-mail: [email protected]
References
[1] Kurzepa-Hasan E, Hasan K and Adamek R. [Tobacco smoking among population in the
United Kingdom of Great Britain and Northern
Ireland between years: 1950 and 2003]. Przegl Lek 2008; 65: 740-741.
[2] Badrzadeh F, Rahmati-Yamchi M, Badrzadeh K, Valizadeh A, Zarghami N, Farkhani SM and Akbarzadeh A. Drug delivery and nanodetec-tion in lung cancer. Artif Cells Nanomed Biotechnol 2016; 44: 618-34.
[3] Jemal A, Bray F, Center MM, Ferlay J, Ward E
and Forman D. Global cancer statistics. CA
Cancer J Clin 2011; 61: 69-90.
[4] Khuder SA. Effect of cigarette smoking on ma-jor histological types of lung cancer: a meta-analysis. Lung Cancer 2001; 31: 139-148. [5] Hammond EC and Seidman H. Smoking and
cancer in the United States. Prev Med 1980; 9: 169-174.
[6] Morisseau C, Bernay M, Escaich A, Sanborn JR, Lango J and Hammock BD. Development of
fluorescent substrates for microsomal epoxide
hydrolase and application to inhibition studies. Anal Biochem 2011; 414: 154-162.
[7] Nguyen HL, Yang X and Omiecinski CJ. Ex- pression of a novel mRNA transcript for hu- man microsomal epoxide hydrolase (EPHX1) is regulated by short open reading frames within its 5’-untranslated region. RNA 2013; 19: 752-766.
[8] Lakhdar R, Denden S, Knani J, Leban N, Daimi
H, Hassine M, Lefranc G, Chibani JB and Khelil
AH. Microsomal epoxide hydrolase gene poly-morphisms and susceptibility to chronic ob-structive pulmonary disease in the Tunisian
population. Genet Test Mol Biomarkers 2010;
14: 857-863.
[9] Chappell S, Daly L, Morgan K, Guetta-Baranes
T, Roca J, Rabinovich R, Lotya J, Millar AB, Donnelly SC, Keatings V, MacNee W, Stolk J, Hiemstra PS, Miniati M, Monti S, O’Connor
CM and Kalsheker N. Genetic variants of mi -crosomal epoxide hydrolase and glutamate-cysteine ligase in COPD. Eur Respir J 2008; 32: 931-937.
[10] Rosenberger A, Illig T, Korb K, Klopp N,
Zietemann V, Wolke G, Meese E, Sybrecht G,
Kronenberg F, Cebulla M, Degen M, Drings P,
Groschel A, Konietzko N, Kreymborg KG, Haussinger K, Hoffken G, Jilge B, Ko YD, Morr
H, Schmidt C, Schmidt EW, Tauscher D, Bickeboller H and Wichmann HE. Do genetic factors protect for early onset lung cancer? A case control study before the age of 50 years. BMC Cancer 2008; 8: 60.
[11] Wang N, Wu Y and Zhou X. [Association be-tween genetic polymorphism of metabolizing enzymes and DNA repairing enzymes and the susceptibility of lung cancer in Henan popula-tion]. Wei Sheng Yan Jiu 2012; 41: 251-256. [12] Begg CB and Mazumdar M. Operating
charac-teristics of a rank correlation test for publica-tion bias. Biometrics 1994; 50: 1088-1101. [13] Egger M, Davey Smith G, Schneider M and
Minder C. Bias in meta-analysis detected by a simple, graphical test. BMJ 1997; 315: 629-634.
[14] Tilak AR, Kumar S, Jain M, Pant MC, Das BC,
Guleria R, Mittal B, Mathur N and Kumar A.
Association of functionally important polymor-phism of microsomal epoxide hydrolase gene (EPHX1) with lung cancer susceptibility. Cancer Invest 2011; 29: 411-418.
[15] Ihsan R, Chauhan PS, Mishra AK, Yadav DS, Kaushal M, Sharma JD, Zomawia E, Verma Y, Kapur S and Saxena S. Multiple analytical ap-proaches reveal distinct gene-environment in-teractions in smokers and non smokers in lung cancer. PLoS One 2011; 6: e29431.
[16] Timofeeva M, Kropp S, Sauter W, Beckmann L, Rosenberger A, Illig T, Jager B, Mittelstrass K, Dienemann H, Bartsch H, Bickeboller H, Chang-Claude J, Risch A and Wichmann HE.
Genetic polymorphisms of MPO, GSTT1, GSTM1, GSTP1, EPHX1 and NQO1 as risk fac -tors of early-onset lung cancer. Int J Cancer 2010; 127: 1547-1561.
[17] Voho A, Metsola K, Anttila S, Impivaara O, Jarvisalo J, Vainio H, Husgafvel-Pursiainen K and Hirvonen A. EPHX1 gene polymorphisms and individual susceptibility to lung cancer. Cancer Lett 2006; 237: 102-108.
[18] Liang GY, Pu YP and Yin LH. [Studies of the
Nanjing Han population, China]. Yi Chuan 2004; 26: 584-588.
[19] Gsur A, Zidek T, Schnattinger K, Feik E, Haidinger G, Hollaus P, Mohn-Staudner A, Armbruster C, Madersbacher S, Schatzl G,
Trieb K, Vutuc C and Micksche M. Association of microsomal epoxide hydrolase polymor-phisms and lung cancer risk. Br J Cancer 2003; 89: 702-706.
[20] Cajas-Salazar N, Au WW, Zwischenberger JB, Sierra-Torres CH, Salama SA, Alpard SK and Tyring SK. Effect of epoxide hydrolase poly- morphisms on chromosome aberrations and
risk for lung cancer. Cancer Genet Cytogenet
2003; 145: 97-102.
[21] Yin L, Pu Y, Liu TY, Tung YH, Chen KW and
Lin P. Genetic polymorphisms of NAD(P)H quinone oxidoreductase, CYP1A1 and micro -somal epoxide hydrolase and lung cancer risk in Nanjing, China. Lung Cancer 2001; 33: 133-141.
[22] Wu X, Gwyn K, Amos CI, Makan N, Hong WK
and Spitz MR. The association of microsomal epoxide hydrolase polymorphisms and lung cancer risk in African-Americans and Mexican-Americans. Carcinogenesis 2001; 22: 923-928.
[23] To-Figueras J, Gene M, Gomez-Catalan J, Pique
E, Borrego N and Corbella J. Lung cancer sus-ceptibility in relation to combined polymor-phisms of microsomal epoxide hydrolase and glutathione S-transferase P1. Cancer Lett 2001; 173: 155-162.
[24] London SJ, Smart J and Daly AK. Lung cancer risk in relation to genetic polymorphisms of mi-crosomal epoxide hydrolase among African-Americans and Caucasians in Los Angeles County. Lung Cancer 2000; 28: 147-155. [25] Persson I, Johansson I, Lou YC, Yue QY, Duan
LS, Bertilsson L and Ingelman-Sundberg M.
Genetic polymorphism of xenobiotic metaboliz -ing enzymes among Chinese lung cancer pa-tients. Int J Cancer 1999; 81: 325-329. [26] Benhamou S, Reinikainen M, Bouchardy C,
Dayer P and Hirvonen A. Association between lung cancer and microsomal epoxide hydro-lase genotypes. Cancer Res 1998; 58: 5291-5293.
[27] Sun XW, Ma YY and Wang B. [The interaction between microsomal epoxide hydrolase poly-morphisms and indoor pollution in non small cell lung cancer]. Zhonghua Yu Fang Yi Xue Za Zhi 2007; 41 Suppl: 30-34.
[28] Yoshikawa M, Hiyama K, Ishioka S, Maeda H, Maeda A and Yamakido M. Microsomal epox-ide hydrolase genotypes and chronic obstruc-tive pulmonary disease in Japanese. Int J Mol Med 2000; 5: 49-53.
[29] Erkisi Z, Yaylim-Eraltan I, Turna A, Gormus U,
Camlica H and Isbir T. Polymorphisms in the microsomal epoxide hydrolase gene: role in lung cancer susceptibility and prognosis. Tumori 2010; 96: 756-763.
[30] Graziano C, Comin CE, Crisci C, Novelli L, Politi L, Messerini L, Andreani M and Porfirio B.
Functional polymorphisms of the microsomal epoxide hydrolase gene: a reappraisal on a early-onset lung cancer patients series. Lung Cancer 2009; 63: 187-193.
[31] Gemignani F, Landi S, Szeszenia-Dabrowska
N, Zaridze D, Lissowska J, Rudnai P, Fabianova E, Mates D, Foretova L, Janout V, Bencko V,
Gaborieau V, Gioia-Patricola L, Bellini I, Barale
R, Canzian F, Hall J, Boffetta P, Hung RJ and Brennan P. Development of lung cancer be- fore the age of 50: the role of xenobiotic me-tabolizing genes. Carcinogenesis 2007; 28: 1287-1293.
[32] Park JY, Chen L, Elahi A, Lazarus P and
Tockman MS. Genetic analysis of microsomal
epoxide hydrolase gene and its association with lung cancer risk. Eur J Cancer Prev 2005; 14: 223-230.
[33] Zhao H, Spitz MR, Gwyn KM and Wu X.
Microsomal epoxide hydrolase polymorphisms and lung cancer risk in non-Hispanic whites. Mol Carcinog 2002; 33: 99-104.
[34] Zhou W, Thurston SW, Liu G, Xu LL, Miller
DP, Wain JC, Lynch TJ, Su L and Christiani DC. The interaction between microsomal epoxide hydrolase polymorphisms and cumulative ciga-rette smoking in different histological sub- types of lung cancer. Cancer Epidemiol Bio- markers Prev 2001; 10: 461-466.
[35] Smith CA and Harrison DJ. Association be-tween polymorphism in gene for microsomal epoxide hydrolase and susceptibility to emphy-sema. Lancet 1997; 350: 630-633.
[36] Fathy M, Hamed M, Youssif O, Fawzy N and Ashour W. Association between environmental tobacco smoke exposure and lung cancer
sus-ceptibility: modification by antioxidant enzyme
genetic polymorphisms. Mol Diagn Ther 2014; 18: 55-62.
[37] Perez-Morales R, Mendez-Ramirez I, Moreno-Macias H, Mendoza-Posadas AD,
Martinez-Ramirez OC, Castro-Hernandez C, Gonsebatt ME and Rubio J. Genetic susceptibility to lung
cancer based on candidate genes in a sample from the Mexican Mestizo population: a case-control study. Lung 2014; 192: 167-173. [38] Omiecinski CJ, Aicher L, Holubkov R and
[39] Seidegard J and Ekstrom G. The role of human
glutathione transferases and epoxide hydro-lases in the metabolism of xenobiotics. Environ Health Perspect 1997; 105 Suppl 4: 791-799. [40] Yang X, Liang SH, Weyant DM, Lazarus P,
Gallagher CJ and Omiecinski CJ. The expres -sion of human microsomal epoxide hydrolase is predominantly driven by a genetically poly-morphic far upstream promoter. J Pharmacol Exp Ther 2009; 330: 23-30.
[41] Omiecinski CJ, Hassett C and Hosagrahara V. Epoxide hydrolase--polymorphism and role in toxicology. Toxicol Lett 2000; 112-113: 365-370.
[42] Hassett C, Robinson KB, Beck NB and Omie- cinski CJ. The human microsomal epoxide hydrolase gene (EPHX1): complete nucleotide
sequence and structural characterization.
Ge-nomics 1994; 23: 433-442.
[43] McGlynn KA, Rosvold EA, Lustbader ED, Hu Y,
Clapper ML, Zhou T, Wild CP, Xia XL, Baffoe-Bonnie A, Ofori-Adjei D, et al. Susceptibility to hepatocellular carcinoma is associated with
genetic variation in the enzymatic detoxifica
-tion of aflatoxin B1. Proc Natl Acad Sci U S A