Output, Prices and Productivity in Irish Sheltered
and Exposed Transportable Goods Industries,
1953-1967
J. G. HUGHES*
IN a paper on price and income determination in the Norwegian economy, Aukrust [1] classifies industries as being either sheltered or exposed. He defines exposed industries as "those which market their products abroad, or on the domes tic market under strong foreign competition." The exposed group therefore consists o f export-oriented and import-competing industries. Sheltered industries are "those industries whose products are marketed at home under conditions such as to leave them relatively free o f foreign price competition". He assumes that prices o f output o f exposed industries are determined on the world market and therefore cost increases cannot be compensated for by price increases but must be absorbed by a reduction in profits (per unit, presumably). Sheltered industries on the other hand " w i l l tend to raise output prices when costs increase". Aukrust also notes that in Norway and Sweden labour productivity in the exposed industries has risen much quicker than labour productivity in the sheltered industries [1, pp. 5 2 - 5 3 ] . As the classification has been very useful in illuminating the process o f price and income determination in the Norwegian economy, it seemed worthwhile to employ this classification in an analysis o f industrial production in Ireland.
ALLOCATION OF INDUSTRIES
Aukrust includes building and service-type industries in his analysis and he allocates these to his sheltered group. These industries are excluded from the present analysis as being o f their nature sheltered from foreign competition. This study, therefore, deals only with transportable goods industries.
The criteria which Aukrust uses for allocating industries to the sheltered or exposed group are not explicitly stated in his paper. Some industries are singled out and allocated to one or other o f the groups because o f their special position in the Norwegian economy, e.g., shipping. For the other export-oriented indus-*While I am solely responsible for the contents of the paper I am indebted to my colleague Dr. R. C . Geary for suggesting the approach adopted in the paper and for the many helpful comments which he made on an earlier draft. I am also indebted to my colleagues Dr. K. Kennedy and Mr. D . McAleese for their comments and suggestions.
tries it appears that exports were approximately 60 per! cent of the total flow for the group as a whole, while for the import-competing industries imports were approximately 30 per cent of that groups' total flow. After calculating, from the Irish 92 sector input-output table for 1964 [3],' the percentage which exports and imports form of the domestic flow (i.e., domestic production) o f each sector, it was clear that under Aukrust's criterion only one or two sectors would be classified as export-oriented. Bearing in mind that the criterion adopted should be the same for both groups, it was decided that the criterion for allocating the sectors to the exposed group should be that any sector whose exports or competing imports were greater than one third of domestic flow would be classified as exposed. The cut-off point (33^ per cent) is somewhat arbitrary, though unavoidably so, as inclusion or exclusion of marginal cases is a matter of judgement based on knowledge of their particular situation. The remaining
industries were allocated to the sheltered group. j
The relevant input-output sectors were reconciled with the industrial classifica tion used in the Census of Industrial Production (CIP) and the classification o f sheltered and exposed industries which emerged is as follows:
EXPOSED
Slaughtering
Butter, cheese, edible milk products Brewing
Jute, canvas, rayon Hosiery
Wood, cork Linen, cotton
Woollen, worsted Shirtmaking
Women's and girls' clothing
INDUSTRIES j Fellmongery, tanning Paper and paper products Chemicals j' drugs Fertilisers j
Oils, paints, inks and polishes Metal trades
Electrical machinery Non-electrical machinery Ship and boat building
SHELTERED
Coal
Stone, slate, sand Other mining
Turf production and bog development Bacon factories
Grain milling and animal feeding stuffs Bread, biscuits and four confectionery Sugar, cocoa, sugar confectionery Canning of fruit and vegetables, Jams Margarine, butter blending
Other food preparations Malting
Distilling
Aerated and mineral waters Tobacco
INDUSTRIES
Furniture, brushes and brooms Made-up textile goods Men's and boys' clothing Other clothing
Leather and leather substitutes Boots and shoes
Printing, publishing Soap, detergents and candles Glassware, .pottery Structural clay, cement
The sectors o f the input-output table, from which this classification is derived, are given in the appendix, together with the percentage which exports, imports, and the sum o f the two, form o f the domestic flow o f each sector. Difficulties arose in the reconciliation o f the input-output sectors and the CIP industries, (e.g., the CIP industries, men's and boys' clothing, shirt-making, women's and girls' clothing, and other clothing, were grouped together to form the Clothing sector in the input-output table). It w i l l be seen in the appendix that exports for the Clothing sector as a percentage of domestic flow are 45-1 per cent. The problem therefore arises: which CIP clothing industries should be assigned to the exposed group > Fortunately, some further information on exports o f CIP industries is available i n the N I E C Report on the Economic Situation 1965 [9]; and it is possible, on the basis o f this information, to assign shirtmaking and women's and girls' clothing to the exposed group.
It may be thought that the criterion used to allocate an industry to the exposed group is too exclusive, since no allowance is made for industries which would appear exposed i f the sum o f their exports and imports were taken into account (e.g., the sum o f the exports and imports o f the Shoes and Leather Goods sector is 40-3 per cent o f the sector's domestic production; yet this sector is regarded as sheltered). It w i l l however be noted from the appendix that when the input-output sectors percentages exported and imported are added, the total for the exposed sectors is always greater than 47 per cent, with the exception o f Pig Slaughtering and Sheep/Horse Slaughtering. Thus i f we had adopted this criterion (i.e., the sum o f exports and imports greater than 47 per cent) only one industry (Slaughtering) which is classified as exposed under the 33! per cent rule would be excluded from the exposed group; and only one industry, (Glassware and Pottery) which is excluded under the 33^ per cent rule would be included in the exposed group. The criterion used (i.e., exports or competing imports greater than 3 3 \ per cent o f domestic production) therefore does not exclude industries which would appear to be exposed i f the sum o f their imports and exports were taken together.
EXPOSED AND SHELTERED INDUSTRIES
Volume Indexes
Volume indexes for each o f the two groups for the years 1953-1967 were calculated. The Ship and Boat Building industry was omitted from the calcula tions for the exposed group and for all transportable goods industries because, as Kennedy [7, p. 129] has pointed out, "the volume o f output is measured in terms o f man hours" in this industry, and "such a measure o f output seriously underestimates the true rise in volume o f output."
i
i
. J
The volume indexes for the divisions of industry (mining, manufacturing, etc.) for the major groups in manufacturing industry, and fori all industries combined, are obtained by weighting the index numbers for the individual industries within the division or group with their respective net outputs (a) in the previous year, and (b) in the current year. The geometric mean of these two indexes gives the volume index for the division or group to base previous year = 100. All the index numbers (for individual industries, divisions and groups) are transferred to base 1953 =
100. I
I *
The volume indexes for the sheltered and exposed groups resulting from these
calculations are shown in Table 1. j
TABLE
I :
Volume Indexes for Exposed, Sheltered and All Transportable Goods Industries1953-1967 j
Base 1953 = 100 *
Industry Group Year
Exposed* Sheltered i All Transpor
1953 100*0 1 oo-o ; ioo-o
1954. 106-5 ioi-o 103-3
1955 110-9 105-2 • 107-5
1956 "4-3 98-7 i 105-1
1957 113-1 98-1 104-2
1958 II8-2 97-7
j
106-01959 129-1 108-6 116-9
i960 143-5 "3-3 ! 125-4
1961 160-1 I2I-0 136-5
1962 169-1 I29-0 1 144-9
1963 179-1 135-4 I 152-7
1964 192-7 145-2
j
164-0
1965 205-7 149-2 I 7 I - 4
1966 214-3 157-1 179-6
1967 235-6 168-8 195-1
Basic Sources: September issues of Irish Trade Journal and Statistical Bulletin (now Irish
Statistical Bulletin), 1956-1967. j
*Excluding Shipbuilding j
It w i l l be noted that the volume index for all transportable goods is closer to the volume index for the sheltered group than to the volume index for the exposed group. The reason is that the net output (i.e., the weight) o f the sheltered group forms the greater portion o f total net output. In 1953 and 1967 the net output figures for each o f the groups were:
Exposed Sheltered All Transportable
Year (excluding Shipbuilding) £'000 (excluding Shipbuilding)
1953 36,989 51,882 88,871
1967 133,983 149,980 283,963
The difference o f almost 67 points in the level o f the volume indexes o f the sheltered and exposed industries is remarkable. Particularly noteworthy is the behaviour o f the two indexes since 1958. The increase in the volume o f output of exposed industries since 1958 is almost 100 per cent as against 73 per cent for sheltered industries and 84 per cent for all transportable goods industries. While the official policy o f promoting foreign firms with export potential dates from 1958 when the Industrial Development (Encouragement of External Investment) Act was passed, it is worth noting that the increase in volume o f output o f ex posed industries was i n evidence before this. The decline in the volume of output in the sheltered group in the years 1956-195 8 together w i t h the slow down in growth o f output in the year 1965 indicate that the sheltered group may be affected more by a recession in the economy than the exposed group. The em ployment figures for the two groups of industries tend to confirm this impression, as w i l l be evident from Table 2.
TABLE 2: Indexes of Average Numbers Engaged in Exposed, Sheltered and All Transportable Goods Industries, 1953-1967
Base 1953 = 100
Industry Group
Exposed* Sheltered All Transportable*
1953 ioo-o ioo-o ioo-o
1954 102-5 102-0 102-2
1955 105-0 103-3 104-0
1956 105-2 100-3 102-3
1957 103-5 96-7 99-4
1958 104-7 96-3 99.7
1959 107-1 97.9 101-6
i960 114-3 100-5 106-1
1961 119-7 104-7 110-7
1962 124-5 107-4 * "4-3
1963 129-0 n o - o 117-7
1964 132-4 112-4 120-5
1965 133-6 112-7 I 2 I - I
1966 I37-I 112-4 122-3
1967 140-6 I I 3 ' 2 124-2
Basic Sources: As for Table 1.
f
J I
I
196 ECONOMIC AND SOCIAL REVIEW
The main feature of this table is the very substantial increase in employment in the exposed industries. Again it is worth noting that, since 1958, employment in the exposed industries has increased almost twice as much as employment in the sheltered group. While employment in the exposed group dropped slightly below its 1955 level during the recession o f 1956-1957, the major effects o f the recession on employment were borne by the sheltered group. Employment in the sheltered group did not recover to the 1955 level until 1961, although the output o f this group, as w i l l be seen from Table 1, had surpassed the 1955 level by 1959. Similarly, in the recession o f 1965-1966 employment declined slightly in the sheltered group but increased in the exposed group.
Implicit Price Indexes j
Having calculated the volume indexes for each group and for all transportable goods industries, we derive the implicit price index for each group by dividing the index o f the value of net output for each group by the group volume index. The results are shown in Table 3. j
The indexes of value of net output are used in deriving the implicit price indexes for each group, as our interest is in the behaviour o f the price o f the work done in the two industrial groups. It has been noted by Kennedy [7, pp. 133-134] that:
i
this price indicator is equivalent to the true implicit price of net output in the individual industries and in total manufacturing only i f the volume indexes for the individual industries, which are gross output volume indexes, change in the same proportion as a net output volume index for the individual indexes.
This is a rather restrictive assumption, and the justification for making it is, as Geary and Pratschke state [6, p. 17], that "nothing less thaii a full double deflation process, applied industry-wise to CIP data would suffice."
From Table 3 it w i l l be seen that the price behaviour o f the two groups has been significantly different during the whole period. U p to 1963, the increase in the price o f exposed industries net output was always less than half that o f the increase in the price o f the sheltered group. The very large increase in prices for the exposed group which occurred between 1965 arid 1966 (9-5 as against 4-2 per cent for the sheltered group) has led to a narrowing o f the gap between the two price series in 1967. . j
Labour Productivity I
We have established that there are significant differences in the behaviour o f the volume o f output and implicit net output prices o f the two groups. Are there also differences in the behaviour o f labour productivity for the sheltered and exposed industries? f . „• . •
TABLE 3: Implicit Net Output Price Indexes for Exposed, Sheltered and All Transportable Goods Industries, 1953-1967
Base 1953 = 100
Industry Group Year . . — —
Exposed* Sheltered All Transportable*
1953 ioo-o ioo-o ioo-o
1954 99-4 100-2 99-8
1955 ioo-6 101-9 101-4
1956 102-6
III-O
107-31957 102-2 I I 2 - I 107-8
1958 107-4 119-0 113-9
1959 108-7 123-1 n 6 - 8
i960 107-5 123-8 116-5
1961 I I 0 - 5 133-7 123-1
1962 I I 7 - 9 138-8 129-5
1963 123-8 142-3 I34-I
1964 127-8 150-4 140-2
1965 I32-0 155-1 144-7
1966 144-6 161-6 154-3
1967 153-7 171-2 163-8
Basic Sources: As for Table 1.
•Excluding Shipbuilding.
engaged, for the two groups, we allow for structural change (i.e., a shift o f workers from industries with a low net output per head to industries with a high net output per head) by first calculating an employment index. This is done for each group by weighting the ratio of employment in each industry in the current year to employment in the previous year by the current and previous year's value o f net output and taking the geometric mean o f the two indexes. The resulting index for each group is an index o f the change in the volume o f output due to changes in the numbers employed, and to changes in the distribution between industries o f the numbers employed. The labour productivity index is derived by dividing the index of the volume of output by the employment index. The indexes for exposed, sheltered and all transportable goods industries are presented in Table 4.
TABLE 4: Indexes of Net Volume of Output Per Person Engaged inlExposed, Sheltered and All Transportable Goods Industries, ig^-ig^y
1 Base 1953 -—- 100 !:
Year
Industry Group •
Year Exposed* Sheltered j All Transportable*
1953 ioo-o ioo-o j ioo-o
1954 103-9 99-1 j I O I - I
1955 105-5 102-0 j 103-4
1956 108-5 98-8 I 102-8
1957 108-8 101-9 1 104-7
1958 112-4 102-3 ! 106-2
1959 119-9 108-9 114-6
i960 125-2 110-3 117-6
1961 133-2 113-2 122-7
1962 135-8 117-4 126-2
1963 139-2 120-0 I29-2
1964 146-0 I 2 5 - I I 3 5 ' i
1965 154-2 127-4 139-7
1966 155-6 134-0 144-3
1967 166-5 143-0 i 154-1
Basic Sources: As for Table 1.
*Excluding Shipbuilding.
The differences in productivity growth between sheltered and exposed indus tries can be almost entirely explained by differences i n output growth i.e., by the "Verdoorn Law". This "Law", as Kennedy notes [7,:p. 122] in his analysis of its applicability to Irish experience, states that : j
over the longer term, the growth rates of labour productivity and output will be highly and positively correlated, and that a' one percentage point increase in the output growth rate will be accompanied by slightly less than an 0-5 percentage point increase in the growth rate of labour productivity and slightly more than an 0-5 percentage point increase in the employment growth rate.
i
The appropriate regression equation for the period 1953-1967 is:
P = 0-84 + 0-438 Q* I
where P and Q are'average annual rates o f growth o f output per head and o f output. Using this equation, the following results emerge:
Actual Output Growth (per cent) Predicted Productivity Growth
(per cent)
Actual Productivity Growth (per cent)
Exposed (excluding Shipbuilding)
Sheltered All Transportable Goods (excluding
Shipbuilding)
6-3 3-8 4-9
3-6 2-5 3-o
3-7 2-6 3-i
,The Verdoorn relationship therefore explains most o f the differences in produc tivity growth between the two groups. Aukrust [ i , p. 53] found similar differ ences in the increase in labour productivity between sheltered and exposed Norwegian industries and while commenting that "presumably, the reasons for the differences were largely technological" noted that:
we cannot rule out the possibility that the exposed industries in part had a better productivity record precisely because they were exposed and therefore had to attend more to efficiency in order to stay competitive.
Profits and Costs per Unit of Output
A n approximate indication o f the relative efficiency o f the two groups o f industries can be obtained by dividing indexes o f the cost o f materials, salaries and wages, total costs and remainder of net output, by the indexes o f volume o f output for the groups. The resulting indexes are measures of changes in costs and profits per unit o f output. Results are given in Table 5.
TABLE 5: Indexes of Cost of Materials, Salaries and Wages, Total Costs and Remainder of Net Output Per Unit of Output, in Exposed, Sheltered and All Transportable Goods Industries,
1953-67 j
I
Base 1953 = 100 'j
, j
' Remainder of Net Cost of Materials Salaries and Wages Total Costs ! Output Year
Exposed* Sheltered Exposed* Sheltered ' Exposed* Sheltered i
Exposed* Sheltered
1953 ioo-o ioo-o ioo-o IOO-O ioo-o i
ioo-o ioo-o ioo-o 1954 96-6 97-1 100-4 103-5 97-3 98-2 98-5 96-0 1955 93-6 95-9 102-5 105-2 95-o 97-4 98-8 97-5 1956 947 93-8 106-1 115-5 966 97-4 99-5 105-2 1957 99-1 IOI-8 108-8 117-1 100-7 104-4 96-1 105-7 1958 98-5 107-8 I I I - 2 123-3 1006 110-3 103-8 113-4 1959 97-1 105-8 109-5 II8-2 99-1 107-8 107-7 1295 i960 ioo-i 107-6 111-7 122-6 102-7 i i d - i 103-6 125-4 1961 101-9 106-3 113-0 125-8 103-7 109-4 111-9 139-9 1962 102-4 105-0 I2I-2 132-2 105-5 109-5 118-9 142-9 1963 102-8 108-1 I23-6 I37-I 106-2 n i ' 9 124-0 149-0 1964 104-7 109-4 130-8 145-9 I09-0 l l i - 4 125-1 156-1 1965 105-0 113-3 I 3 I - 3 148-0 109-3 119-0 132-8 164-2 1966 107-6 109-1 I40-2 152-8 113-0 II6-2 148-6 172-9 1967 114-0 110-5 142-4 154-0 118-7 117-6 164-2 193-4
i
Basic Sources: As for Table 1. | *Excluding Shipbuilding. j
i
as we have seen earlier, did not increase their prices as much as the sheltered group, bore the increase in costs through a much slower rate o f growth o f profits per unit o f output. The sheltered group (which were not subject to the same sort o f price restraint as the exposed group) increased their pricesjmore than the exposed group in order to compensate for cost increases. 1
TABLE 6: Remainder of Net Output as a Percentage of Net Output in Exposed, Sheltered and All Transportable Goods Industries, 1953-1967
Industry Group Year
Exposed* Sheltered All Transportable*
1953 52-1 43-8 47-2
1954 51*7 41-9 46-1
1955 51-2 41-9 45-9
1956 50-5 41-5 45-4
1957 49-0 41-3 44-6
1958 50-4 41-7 45-5
1959 5i'7 46-0 48-4
i960 50-2 44-3 46-9
1961 52-8 45-8 48-8
1962 52-6 45-1 48-4
1963 52-2 45-8 48-7
1964 Si-o 45-4 47'9
1965 52-4 46-3 49-1
1966 53-6 46-8 50-0
1967 5 5 7 49-4 52-4
Basic Sources: As for Table 1. *Exclud.ing Shipbuilding.
Chart 1 : Remainder of Net Output as a Percentage of Net Output of
Exposed", Sheltered and All Transportable Goods Industries*
1953-1967.
53 54 55 56 57 58 59 60 61 62 63 64 65 66 67
202 ECONOMIC AND SOCIAL KEVIEW (
j
group between 1958 and 1959. The new level was maintained until 1967, when there was another strong increase. There has been, therefore, a substantial increase in the share o f profits in the net output o f transportable goods between 1953 and 1967—the increase in the sheltered group's share being almost twice as great as the increase in the exposed group's share. These increases are susprising in the light o f Geary and Pratschke's [6, p. 30] finding o f quasi-constancy o f factor shares in the non-agricultural sector o f the economy. Aukrust [2, p. 199] also found relative constancy in his analysis o f income shares in Norway, noting that "this relative constancy is the net effect o f strong, *but opposite trends in home market industries and export industries". Both these studies, however, covered a wider area of the economy than the present one;' and the <pdst'-constancy that they observed may have been the result o f countervailing tendencies in different sectors o f the economy. I t should also be noted that the figures for remainder o f net output o f transportable goods industries include, as well as gross profit (including depreciation), other expenses such as advertising and rent and rates. Some o f the increase in profits share may, therefore, be due to increases in these expenses proportionately larger than the increases in profits.
EXPOSED INDUSTRIES: EXPORT-ORIENTED |AND IMPORT-COMPETING I
i
It was noted at the beginning o f the paper that the exposed group consists o f two groups o f industries one o f which is subject to foreign competition on the home market while the other is competing by exporting to foreign markets. The industries in these export-oriented and import-competing groups are:
j
EXPORT-ORIENTED IMPORT-COMPETING I
t
Slaughtering Wood, cork i
Brewing Linen, cotton ;
Jute, canvas, rayon Woollen, worsted
Hosiery Paper and paper products
Butter, cheese, edible milk products Chemicals, drugs
Shirtmaking Fertilisers
Women's and girls' clothing Oils, paints, inks and polishes
Fellmongery, tanning Metal Trades '
Non-electrical machinery Electrical machinery
Ship and boat building I
others, e.g., Grain milling and animal feeding stuffs, are characterised, as McAleese* [8] points out, by
(a) dependence on domestic agricultural output as raw materials, (b) extremely low (on average eight per cent) net value added share in total output, reflecting the small amount of conversion carried out by these industries and, consequently (c) the output price heavily determined by the price of agriculture.
In the calculations in this section for the export-oriented and exposed industries as a whole the Ship and boat building industry is again excluded for reasons given above.
Using the same procedure as for the sheltered and exposed groups, volume indexes for export-oriented and import-competing industries were calculated. These indexes (see Table 7) show that, by 1967, the volume o f output in import-competing industries had increased remarkably more than the volume o f output o f export-oriented industries—the difference in 1967 between the two indexes being more than 110 points.
TABLE 7: Volume Indexes for Export-Oriented, Import-Competing and Exposed Industries 19531967
-Base 1953 = 100
Industry Group
Export-Oriented* Import-Competing Exposed*
1953 ioo-o ioo-o ioo-o
1954 101-3 " 3 - 4 106-5
1955 102-3 I 2 2 - I 110-9
1956 108-1 122-6 114-3
1957 105-5 123-0 113-1
1958 110-4 128-6 I I 8 - 2
1959 117-3 144-8 129-1
i960 127-8 164-3 143-5
1961 144-0 181-6 160-1
1962 148-2 196-9 169-1
1963 152-9 214-0 179-1
1964 159-8 236-9 192-7
1965 163-8 262-4 205-7
1966 169-5 275-1 214-3
1967 ' 188-3 299-7 235-6
Basic Sources: As for Table 1. *Excluding Shipbuilding.
204 ECONOMIC AND SOCIAL REVIEW'
IThe very large increase in the volume o f output o f the import-competing group started in 1959. In that year and i n every other year thereafter except .1961 and 1967 the growth i n the output o f the import-competing group was
almost always twice as great as the growth in output o f the export-oriented group. The very large growth i n the output o f the import-competing group was accompanied by a change i n the contribution which this group made to the net output of the exposed group. In 1953 tbe net output of the import-competing group as a percentage o f the net output o f the exposed group was 43-7 per cent while in 1967 it had risen to 53-6 per cent.
j
TABLE 8: Implicit Net Output Price Indexes for Export Oriented, Import Competing and Exposed Industries 1953-1967 [
Base 1953 = 100
Industry Group
Year j :
Export Oriented* Import Competing Exposed*
1953 ioo-o ioo-o ioo-o 1954 i o i ' i 97-3 J .99-4
1955 101-9 99-1 ioo-6
1956 I O I - 8 103-4! 102-6 1957 103-3 IOI-Oj 102-2 1958 108-6 105-7! 107-4
1959 n i - 2 105-51 108-7
1960 110-9 103-7! 107-5 1961 H 2 - 8 107-61 110-5 1962 119-0 116-4! 117-9
1963 129-9 i.i7-6! 123-8
1964 133-3 122-0 j 127-8
1965 137-5 126-2} 132-0
1966 151-1 137-8
j
144-61967 , 158-7 148-01 153-7
Basic Sources: As for Table 1.
•Excluding Shipbuilding. j
The level o f the implicit net output price index o f the import-competing group was lower over the whole period, w i t h the exception o f 1956, than the corresponding index for the export-oriented group; as Table 8 shows. However, the differences between the two indexes were not very substantial at any time.
As one would expect from the behaviour o f the volume indexes o f the export-oriented and import-competing groups the productivity indexes for the two groups show large differences in their levels over the whole period, see Table 9.
t
TABLE 9: Indexes of Volume of Output per Person Engaged in Export-Oriented, Import-Competing and Exposed Industries, 1953-1967
Base 1953 = 100
Industry Group Year '
Export-Oriented* Import-Competing Exposed*
1953 • ioo-o ioo-o . . ioo-o
1954 I O I - I 107-6 103-9 ::
1955 ioo-8 111-3 105-5
1956 106-7 III-2 108-5
1957 106-4 I I 2 - 0 108-8
1958 109-3 u 6 - 6 112-4
1959 114-1 127-3 119-9'
i960 119-0 I33-Q 125-2
1961 128-7 139-3 133-2 ;
1962 128-6 145-0 135-8
1963 130-1 150-3 139-2
1964 134-4 160-1 • 146-0
1965 135-6 176-3 154-2
1966 137-0 177-8 155-6
1967 146-9 189-9 166-5 •
Basic Sources: As for Table 1. *Excluding Shipbuilding.
Using Kennedy's equation to predict productivity growth from output growth, the following results emerge:
Exported Oriented Import- Exposed (excluding Competing (excluding
"' Shipbuilding) Shipbuilding)
Actual Output Growth . '
(per cent) 4-6 8-1 6-3 Predicted Productivity
Growth (per cent) 2-8 4-4 3-6 Actual Productivity
Growth (per cent) 2-8 4-7 3-7
Given the tariff situation, this is not surprising: a considerable bias against exports is created by our tariff structure. McAleese [8], notes that:
export incentives. . . are still small relative to the incentives to import substitution. As tariffs fall and assuming export incentives remain the balance will, of course,
begin to be righted. j
CONCLUSION \
"The approach used in the paper of allocating industries to sheltered and exposed groups can be criticised on the ground that the paper has not shown any connec tion between protection and exports. McAleese [8] has shown that, in fact, in the Irish case there is no relationship between them. A possible explanation, supported by information from the CIO reports, is that only a few firms in an industry are engaged in the export market. For these few firms the degree of protection is not important; but it is very important for the remainder. It would have been prefereable, therefore, to have examined the behaviour jof firms in the export-oriented industries. The necessary basic data are not available to us. It would be a task well worth undertaking, perhaps on a sample basis.
The classification o f industries into sheltered and exposed groups is useful in shedding light on the different performance o f Irish industries with regard to output, productivity and prices. Industries which have been exposed to foreign competition, whether in the home or export markets, have increased their volume of output and their productivity at a faster rate than sheltered industries, while prices o f the products o f exposed industries have increased at a slower rate than prices o f sheltered industries products. Within the exposed group there has been a larger increase in the output and productivity o f import-competing industries than for the export-oriented group, while price increases for the import-competing group have been smaller than for the export-oriented group.
I f Ireland joins the EEC there w i l l be a great increase in the number of industries exposed to foreign competition. The performance o f exposed industries up to 1967 has been satisfactory, exposure to competition on the whole having led to greater efficiency. While there is justifiable concern as to the probable effects o f free trade conditions on Irish industry, the results presented in this study are
not discouraging. J
Economic and Social Research Institute, Dublin \
REFERENCES ;
[1] Aukrust, Odd, "PRIM 1: A Model of the Price and Income Distribution Mechanism of an Open Economy," Reveiw of Income and Wealth. Series 16, No. 1, 1970.
[3] Central Statistics Office, Input-Output Tables for 1964. Prl. 985. Dublin: Stationery Office, 1970.
[4] Central Statistics Office, Irish Statistical Bulletin, September 1966. Dublin: Stationery Office, 1967.
[5] Geary, R. C , "Productivity Aspects of Accounts Deflation," in Income and Wealth, Series DC, edited by Phyllis Deane. London: Bowes and Bowes, 1961.
[6] Geary, R. C , and Pratschke, J. L . , "Some Aspects of Price Inflation in Ireland," ESRI Paper No. 40. Dublin: ESRI, 1968.
[7] Kennedy, Kieran A., "Growth of Labour Productivity in Irish Manufacturing 1953-1967," Journal of the Statistical and Social Inquiry Society of Ireland, Vol. X X I I . Part I.
[8] McAleese, Dermot, "Nominal and Effective Rates of Protection in Irish Industry." ESRI Draft. Dublin: ESRI, 1970. To be published in 1971.
[9] National Industrial Economic Council, Report on Economic Situation, 1965. Pr. 8552. Dublin: Stationery Office, 1965.
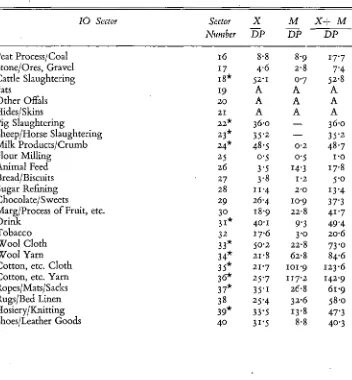
APPENDIX
Exports, Competing Imports and the Sum of Exports and Competing Imports as a Percentage of the Domestic Production of the Transportable Goods Sectors of the 1964 Input-Output Table
IO Sector Sector X M X + M
Number D~P DP DP
Peat Process/Coal 16 8-8 8-9 17-7
Stone/Ores, Gravel 17 4-6 2-8 7"4
Cattle Slaughtering 18* 52-1 0-7 52-8
Fats 19 A A A
Other Offals 20 A A A
Hides/Skins 21 A A A
Pig Slaughtering 22* 36-0 — 36-0
Sheep/Horse Slaughtering 23* 35-2 — 35-2
Milk Products/Crumb 24* 48-5 0-2 48-7
Flour Milling 25 o-5 0-5 1-0
Animal Feed 26 3-5 14-3 17-8
Bread/Biscuits 27 3-8 1-2 5-0
Sugar Refining 28 n-4 2-0 13-4
Chocolate/Sweets 29 26-4 10-9 37-3
Marg/Process of Fruit, etc. 30 18-9 22-8 41-7
Drink 31* 40-1 9-3 49'4
Tobacco 32 17-6 3-o 20-6
Wool Cloth 33* 50-2 22-8 73 -o
Wool Yarn 34* 21-8 62-8 84-6
Cotton, etc. Cloth 35* 21-7 101-9 123-6
Cotton, etc. Yarn 36* 25-7 I J"7'2 142-9
Ropes/Mats/Sacks 37* 35-i 26-8 61-9
Rugs/Bed Linen 38 25-4 32-6 58-0
Hosiery/Knitting 39* 33-5 13-8 47-3
[image:17.494.64.416.285.665.2]IO Sector Sector i x M X + M
Number 'DP DP DP
Clothing 41* (45-1 8-9 54-0
Lumber/Building Wood 42* J 2 I - I 140-8 161-9 Wood Products/Furniture 43 I 2 - I ' 18-2 30-3
Paper and Products 44* 2 I - I 56-9 78-0
Printing/Publishing 45 jlQ-0 24-3 43-3
Fellmongery/Tanning 46* J49-5 21-9 71-4
Fertilisers 47* ! 0-2 67-0 67-2
Paints, etc. 48* 8-3 33-9 42-2
Med/Soap, etc. 49* |3i-5 58-2 89-7
Glass/Pottery 50 i25'5 29-3 54-8
Clay Products/Cement 51 S14-6 7 7 22-3
Metal Products 52* 121-7 47-5 69-2
Non Electrical Machinery 53* | 55-6 I I 6 - 7
Cables, 'etc/Plastics 54* 39-3 89-8 I 2 9 - I
Other Electrical Equipment 55* \3T6 27-1 64-7
Ships, New/Repair 56* U5-4 —. 115-4
Road Vehicles, New 57 i o-6 o-i 0-7
Rail Vehicles/Vehicle Repairs 58 » o-i 0-9 i-o
Petrol/Rubber/Bit. 59 ;i4'2 23-3 37-5
i Basic Source: [3].
A = Artificial sector; X = Exports; M production; * = Exposed Sector.