Value-added as a performance indicator of teaching in
higher education in the UK.
WANG, Li
Available from Sheffield Hallam University Research Archive (SHURA) at: http://shura.shu.ac.uk/5444/
This document is the author deposited version. You are advised to consult the publisher's version if you wish to cite from it.
Published version
WANG, Li (2000). Value-added as a performance indicator of teaching in higher education in the UK. Doctoral, Sheffield Hallam University.
Copyright and re-use policy
ProQuest N um ber: 10701141
All rights reserved
INFORMATION TO ALL USERS
The quality of this reproduction is dependent upon the quality of the copy submitted.
In the unlikely event that the author did not send a com plete manuscript and there are missing pages, these will be noted. Also, if material had to be removed,
a note will indicate the deletion.
uest
ProQuest 10701141
Published by ProQuest LLC(2017). Copyright of the Dissertation is held by the Author.
All rights reserved.
This work is protected against unauthorized copying under Title 17, United States C ode Microform Edition © ProQuest LLC.
ProQuest LLC.
789 East Eisenhower Parkway P.O. Box 1346
Value-added as a Performance Indicator of Teaching
in Higher Education in the UK
Li Wang
A thesis submitted in partial fulfilment of the requirements of Sheffield Hallam University
for the degree of Doctor of Philosophy
ABSTRACT
This research explores the issue of the development of a value-added performance indicator of teaching in higher education in the UK. The empirical work of this research is based on the data on university student entry qualifications and degree results from two new universities and the interviews with 18 members of academic staff from a new university.
This research contains two main parts both aimed at the question of the feasibility of constructing and using value-added as a performance indicator. The first part of this research developed a method of calculating value-added in higher education in the UK, and this method was used to measure value- added at the two institutions at course, school / departmental, and institutional (cohort) level. This was intended to discover the feasibility of developing a method to quantify the relationship between entry qualifications and degree results. The second part of the study used the value-added results obtained from the first part of the study to interview (semi-structured interview) academic staff to investigate their views on whether these value-added results can be used to indicate quality of teaching. In this case the question addressed was the perceived utility of the measure and its acceptability.
The first part of the study found that the method of calculating value-added developed can be used to identify variations in value-added at course (course with large number of students), school / departmental, and institutional (cohort) level, and this method has advantages over the main existing value- added measurements, Index methods and the Comparative method. The second part of the study suggested that academics found it acceptable if the value-added results were used to identify problems, nevertheless, they argued that the value-added results can not directly indicate quality of teaching. The difficulties with directly using value-added results to indicate quality of teaching are summarised into the following aspects: the concept of value-added, comparability, factors which have impact on student academic achievements, factors which have impact on how accurately degree results can reflect students’ true achievements.
PREFACE
ACKNOWLEDGMENTS
Thanks are due to:Professor Peter Ashworth - for providing continual guidance and
encouragement throughout the whole project. And to whom I am deeply indebted
Mr. Mike Grimsley - for all his guidance, particularly in statistics. Without his
guidance, this project would not have been possible.
Dr. Neil Chaliis - for all his guidance and also for giving me many kinds of
support, polishing my English was an obvious one. And to whom I am most grateful.
Mr. John Brennan and Dr. Philip McGeevor - for their interest in the project,
and their valuable comments on the project and the thesis. I deeply appreciate it.
The registrars at two institutions who allowed me to use their data and the administrative staff at the two institutions who downloaded the data from their database for me. To the members of the staff who so generously gave their valuable time to be interviewed and so openly shared their experiences. Without their help, this project will not be completed.
The members of staff in LTI, particularly David Mowthorpe, Maurice
Teasdale, Meg Handscombe, and Hazel Oliver. To other research students in
LTI: Theresa, Mark, Ian, Shauna, and Rachel - for all help they have given me.
My family and my friend, Miss Elizabeth Adams - for their great support and
CONTENTS
Chapter One: Introduction
Chapter Two: Literature Review
2.1 Background
2.1.1 Introduction of performance indicators (Pis) in higher education (HE) in the UK
2.1.2 The development of Pis in HE in the UK 2.1.3 The framework of Pis in HE
2.1.4 Measuring output and input of universities 2.1.5 Definition of performance indicators 2.1.6 The intended use of Pis in HE
2.2 Context
2.2.1 The role of teaching in HE and the need for developing Pis of teaching
2.2.2 Main Pis of teaching in HE in the UK
2.3 Value-added as a PI in HE in the UK
2.3.1 The introduction of value-added as a PI 2.3.2 Main methods of calculating value-added 2.3.3 Main arguments and difficulties concerned
with using a value-added PI 2.3.4 A call for research
Chapter Three: Methodology
3.1 Research design
3.1.1 Methodologies of research in the social sciences 3.1.2 Research design
3.2 Methodology of the quantitative study 3.2.1 Objectives of the quantitative study 3.2.2 Development of an alternative method
of calculating value-added
3.2.3 The data used to test the proposed method and constraint of the study
3.3 Methodology of the qualitative study
3.3.1 The objectives of the qualitative study 3.3.2 The research method chosen
Chapter Four: Measuring Value-added at Course Level
4.1 Introduction
4.2 Characteristics of the population of the courses 4.3 Value-added based on direct comparisons
between individual cohorts
4.4 Value-added based on comparisons between average of previous cohorts and current cohort 4.5 Conclusions
Chapter Five: Measuring Value-added at School and Institutional Level
5.1 Introduction
5.2 Pattern of entry qualifications
5.3 Measuring value-added at school level
5.3.1 Value-added based on direct comparisons between different schools
5.3.2 Value-added based on comparison between university average and individual schools 5.3.3 Comparison between the proposed method
and the Comparative method
5.4 Measuring value-added at institutional level 5.4.1 Value-added based on direct comparisons
between different cohorts
5.4.2 Value-added based on comparison between average previous cohorts and current cohort 5.4.3 Comparison between the method proposed
and the Comparative method
5.5 Conclusions
Chapter Six: Value-added Results and Quality of Teaching
6.1 Introduction
6.2 Concept of value-added
6.3 Value-added and comparability
6.4 Value-added, progress, and level of achievement
Chapter Seven: Conclusion
7.1 Conclusions 187
7.2 Implications 191
7.3 Limitations 195
7.4 Value of value-added 197
References: 1
Appendices:
Appendix 1 The distributions of A level points
of the courses 1
Appendix 2 The distributions of A level points
and degree results of the schools 6 Appendix 3 The distributions of A level points
and degree results of the cohorts 12 Appendix 4 The information sent to the
interviewees before the interview 18
Appendix 5 The interview schedule 22
CHAPTER ONE INTRODUCTION
The national economic crisis of 1974/75 led to the imposition of financial constraints on higher education. The British Government determined to make the higher education sector more accountable to the taxpayers. Thus, performance indicators were externally imposed into higher education policy in the UK.
The framework of performance indicators is based on production theory in economics. Degree results as a most obvious outcome of teaching activity are proposed as a performance indicator of teaching. However, critics quickly recognized the limitations of comparison of degree results that failed to take entry qualifications into account. It was argued that some institutions consistently attract better-qualified entrants, therefore some institutions had higher achievement ‘because of what happens in the admission office rather than what happens in the classroom.' Thus the concept of value added was introduced as a possible performance indicator in higher education.
The idea of value added is attractive. However, to quantify the relationship between inputs and outputs is a formidable problem. The measurements proposed to measure value added (e.g. the index methods and the comparative method discussed below) and the suggestions of using value added results as a performance indicator of teaching have met with considerable criticism. As a result, value added was dropped off the list of performance indicators published by the Joint Performance Indicator Working Group (JPIWG) in 1995 on the grounds that there is a need to do more research on them. Cave et al (1997, p135) concluded that
The present research attempts to make contributions towards this debate.
The aim of the thesis is to explore the feasibility of constructing and using a value-added performance indicator of teaching. The study has explored this issue from two different aspects. The first part of the study has explored the issue from the aspect of technique and has focused on measuring value added. The second part has stepped back to critically assess problems with using the value added results obtained from the first part of the study to indicate quality of teaching.
The remainder of the thesis is presented as follows.
Chapter 2 Literature review
The literature review is divided into three sections. The first section discusses why and how performance indicators were introduced into higher education policy in the UK. Next it introduces that the framework of performance indicators in higher education is based on production theory in economics. However, when this production theory is applied to higher education sector, it meets the difficulties with measuring input and output of higher education. It is revealed that because of these difficulties, measuring the output of universities is therefore an extremely complex problem. The arguments about definition of performance indicators and the intended use of performance indicators in higher education are also discussed in this section.
The second section focuses on discussing teaching performance indicators. Universities are essentially funded as teaching and research institutions, yet research is given much more status and priority. Therefore there is an increased pressure for evaluating teaching in UK and elsewhere. The development of main teaching performance indicators is discussed.
value added program in higher education in USA and methods of calculating value added in school education are also reviewed. Main arguments and difficulties concerned with developing a value added performance indicator in higher education in the UK are summarized. Literature reveals that research in this area is still in its infancy and there is a call for more research. A feature of this research project emerges that this research is an exploratory study, tackling issues of measurement, acceptability, and limitations in the claims about teaching quality that can be made.
Chapter 3 Methodology
This thesis contains two main parts. The first part of the study has designed a method of calculating value added which is based on entry qualifications and degree results. This method is then used to measure value added at course, school and institutional level with actual data in order to examine the feasibility of the method in actual use. The second part of this research has used the value added results obtained from the first part of the study to interview (semi structured interview) the academic staff, who have taught on these courses or in these schools measured, in orcu - to assess acceptability and perceived legitimacy of the value added method developed as a performance indicator of teaching.
The main feature of this research is that unlike most of the research on performance indicators in higher education most of which were carried out at highly aggregated level (e.g. between institutions), this research is conducted at the lower levels of aggregation (e.g. within an institution), and is a very specific study. Therefore the empirical work of this research provides some insights about developing a value added performance indicator of teaching.
Chapter 4 Measuring value-added at course level
qualifications, there is a pattern and that students can be placed into groups in such a way as to represent the majority of the population of the institution. Therefore the value added analysis can be based on these major groups rather than the whole population. Another main finding is that the model is only applicable to courses with a large number of students.
Chapter 5 Measuring value-added at school and institutional level
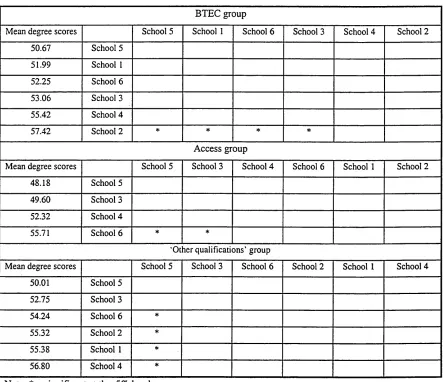
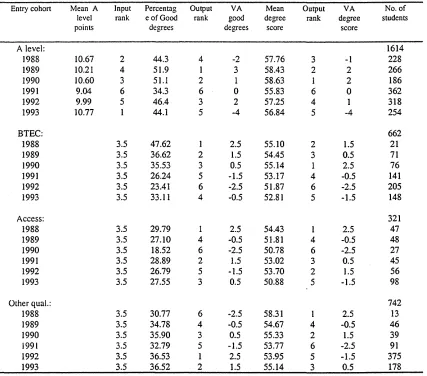
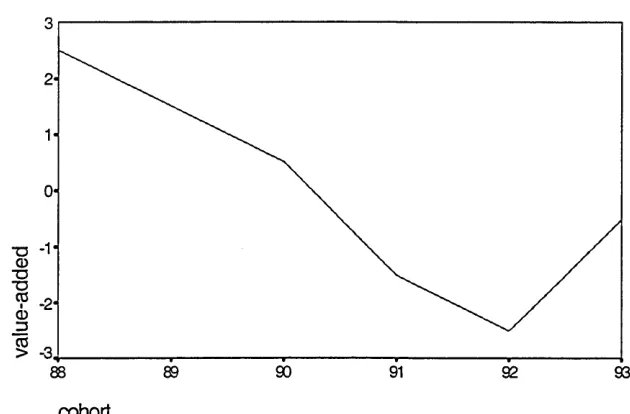
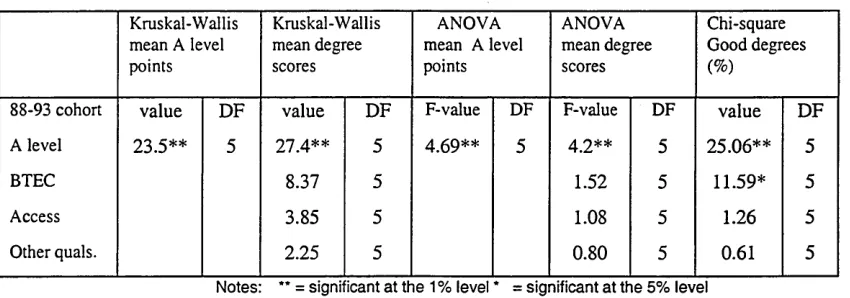
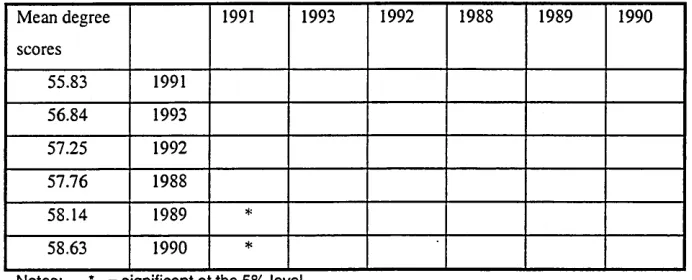
On the basis of the findings of chapter 4, Chapter 5 reports on the use of the model to measure variations in the value added in an institution over the period 1988 - 1993. The measurements are made both at school / departmental level and institutional level. The variations in value added between schools / departments and variations in value added in the institution between different cohorts are identified. These variations in value added raise a series of questions about quality of teaching in the institution during 1988 - 1993. At school level, for example, the A level students from School 2 entered the university with an average A level points 9.24 and about half of them achieved a good degree, while the A level students from school 6 started with an average of 13.61 A level points, but only 39.2 per cent of them obtained a good degree. Why is this so? Does this result indicate that the quality of teaching in school 2 is better than that in school 6?
Comparisons between the model developed in this study and main existing method, the comparative method, are also made. It is found that although the two methods are different, the value added results generated from the two methods are similar. However, conversely, working with the same value added method (i.e. the model developed in this study), but using different methods to measure degree quality (per cent of good degrees as opposed to degree scores) can lead to different value added results.
Chapter 6 Value-added results and quality of teaching
teaching. The qualitative research technique of semi-structured interviewing is used. This study emphasizes the value of academic staff views in assessing a performance indicator of teaching, because it is academic staff who deliver the teaching and who are ultimately responsible for degree classification decisions, and therefore they are most knowledgeable about whether a performance indicator can reflect the reality of performance of teaching. It also indicates whether such a performance indicator would be regarded favourably by teaching staff.
The academic staff concerns about using the value added measurement as a performance indicator of teaching may be summarized into the following aspects:
Firstly, the academic staff argued that degree results could not reflect all the qualities gained by the students through teaching, and there is some value which can not be classified into an upper second or lower second (degree class).
Secondly, they were concerned that the diversity and flexibility which exist under the current higher system in the UK, make it seem impossible to ‘compare like with like’ even at course level. They argued that even students who have the same entry qualifications and study on the same degree course should not be treated the same when we measure value added, because they may take different routes to study.
Fourthly, the academic staff suggested that degree classifications did not necessarily indicate how good the students were or how good the teaching was. There are factors that interact to influence degree classifications. The factors they suggested are summarized into following categories: ‘academic community’, ‘the way the examination boards behaved’, ‘attitudes of external examiners’, ‘how we assessed students’, ‘standard of marking’, and ‘coaching students for examinations’. Therefore when a figure / score shows the improvement of degree results, it could be a product of the improvement of teaching or a combination of the improvement of teaching with these factors.
Chapter 7 Conclusion
There is evidence that indicates that the method of calculating value added developed in this research can be used to identify problems of teaching and the value added results should be treated as a symptom which needs to be further investigated. However, it would not be acceptable using the value-added results to directly indicate quality of teaching.
CHAPTER TWO: LITERATURE REVIEW
This chapter reviews literature on performance indicators in higher education and in particular, literature on value-added as a performance indicator in higher education. The aim of the survey of literature is to define the research problem.
The first section, Background, discusses general issues about performance indicators in higher education. The second section then focuses on discussing teaching performance indicators. Finally, the literature on value-added as a performance indicator of teaching is extensively reviewed in the third section.
The literature reveals that research in the area of value-added as a performance indicator of teaching in higher education is still in its infancy and there is a call for more research. The research reported in this thesis is an exploratory study, aimed at clarifying, and suggesting solutions (where these exist), and the matters which threaten the feasibility of this performance indicator.
2.1 Background
2.1.1 Introduction of performance indicators into higher education in UK
Performance indicators were externally imposed into higher education in the UK by government over a decade ago. This section will briefly review why and how performance indicators were introduced. It will discuss the social and economic background of the introduction of performance indicators, the link between the university funding system and introduction of performance indicators, and link between the binary system of higher education and introduction of performance indicators.
2.1.1.1 The social and economic background
politicians of self-governing professional groups (such as university teachers) and a desire to increase the control exercised over them. Thus the British government determined to make the public sector more accountable to the taxpayer and emphasise efficiency, effectiveness, value for money, and accountability.
Government policy towards higher education has changed rapidly. Higher education has been expected to make a greater contribution to national economic development. Institutions can no longer expect a continuation of funding regardless of past performance.
The pressure for fundamental improvements in the contribution of the higher education sector to national economic development led directly to the setting up of the Jarratt Committee by the Committee of Vice-Chancellors and Principals (CVCP). The work of the Committee involved an investigation of the efficiency and effectiveness of universities. The Jarratt report made some far-reaching recommendations about the governance and management of universities. One of the recommendations was that
A range of performance indicators should be developed, covering both inputs and outputs and designed for use both within individual institutions and for making comparisons between institutions. (Jarratt,
1985, p36)
The Department of Education and Science (DES) warmly welcomed the Jarratt Report’s suggestions that a range of performance indicators should be constructed:
The Government believes there would be advantage in the regular publication of a range of unit cost and other performance indicators by institution and by department It therefore welcomes the Jarratt Report's suggestions for developing reliable and consistent performance indicators designed for use both within individual universities and for
The DES also discussed how the performance of institutions should be measured. The Green Paper suggested that the Government would be interested in three main outcomes of higher education - highly qualified manpower; research; and other social benefits - and that it would wish these to be produced with proper regard for value for money. The performance indicators discussed in the Green Paper included: student numbers and participation rates; unit costs; recurrent costs; the number and costs of successful students.
To respond to the recommendation of the Jarratt report, the University Grants Committee (UGC) and CVCP set up a joint Working Group. The Working Group produced three broad types of indicators: input indicator, process indicators and output indicators. It also suggested that it should publish a range of quantitative indicators to ‘assist universities in the running of their affairs’.
2.1.1. 2 The university funding and introduction of performance indicators
In the UK the university sector has been publicly funded since 1889. However, as noted earlier, because of the economic crisis of 1974/5, financial constraints were imposed on universities. The exchequer funding of universities fell dramatically. The university sector lessened its dependence on government funding; more emphasis was given to overseas student fees, industry, and research foundations. The system of funding was changed from student-led, in which student numbers determined the total amount required by the universities, to finance-constrained, in which this income was regarded as insufficient.
for the best distribution of resources to the universities there is no substitute for judgement based on experience and repeated review of relevant information.
Therefore the entire evaluation exercise was viewed as inadequate. Many academics felt the criteria used by the UGC needed to be more transparent. It should be ensured that ‘future judgements, while certainly selective, would be carried out on the basis of criteria as far as possible known in advance to the university community’ (Harris 1986). In response to the criticisms, the UGC promised (UGC, 1984, p43)
We intend to be more open about decision and advice than in the past. In particular we aim to give a rather more detailed explanation of the grants to individual institutions.
The pressures for more detailed explanation made the UGC turn its attention to more systematic performance measurement.
The introduction of performance indicators was also linked to allocation of research funding. In 1984, the UGC stated its intention to move towards a more selective funding of research in order to ensure that resources for research were used to the best advantage. A selectivity exercise was then launched in 1986. The research rankings were taken into account when the total grant was allocated to universities. The total grant for each institution was based on student numbers in each cost centre and each cost centre’s research record. However, the ways by which the UGC used to produce the research ranking were not clear and highly subjective. Therefore there was a demand to search for more explicit and objective decision aids (Rogers and Scratcherd, 1986 and Evans and Clift 1987).
During the period of introduction of performance indicators, there was a binary line between the universities, and polytechnics and colleges. There were some main differences between the university sector and polytechnic and college sector.
Although the universities receive government grants, the universities in the UK are legally autonomous institutions (DES, 1987a). The university grants are allocated to individual institutions through the University Grants Committee (UGC, which was replaced by the University Funding Council in 1988/89, UFC). Nevertheless, the universities retained their autonomy. How the public money is to be used within the sector is based on the negotiation between the universities and the UGC. The universities can validate their degrees without referring to any outside body. The UGC distributed the financial allocations by using largely informal evaluations, which were carried out by its expert sub committees, in terms of ’peer review’.
The polytechnics and colleges had substantially less autonomy (Taylor, 1987). They were funded publicly since foundation. Local education authorities were given the duty to allocate their resources (Pratt, 1982). The degrees and qualifications awarded in the polytechnics and colleges needed to be validated by the Council for National Academic Awards (CNAA). The Polytechnics and Colleges Funding Council (PCFC) was created as a parallel body to the UFC in the 1987, and The Polytechnics became gradually more autonomous of the CNAA.
In general, the introduction of performance indicators in UK higher education has been perceived as a threat to entrenched values of autonomy of the institution, the department and the individual. Many academics’ attitude towards the usefulness of performance indicators is one of scepticism. Despite this, the widespread and growing use of performance indicators in the public sector in the UK has made it difficult for university authorities to resist for long the introduction of performance indicators.
On the other hand, the pressure of financial constraint also forced individual institutions to accept or develop performance indicators in order to gain a bigger allocation. For the same reason, the higher education system has had to adopt performance indicators: ‘If universities wish to receive increased sums of public money- and they must receive more- they must exhibit evidence that what has been received has been well applied’ (Page 1987).
2.1.2 The development of performance indicators in higher education in the UK
It is over a decade since performance indicators were externally imposed into higher education in the UK. Here we briefly review their development. A series of working groups have been set up to develop performance indicators in higher education. The review will use major working groups as a line to present development of performance indicators and focus on presenting the establishment of these working groups, their statements, and some comments to their statements. The review shows that development of performance indicators in higher education has been under political pressure, and that there has been a tendency that development of performance indicators places prime emphasis on economy and efficiency. It also reveals the difficulties concerned with developing performance indicators in higher education in the UK.
2.1.2.1 Joint CVCP/UGC Working Group on Performance Indicators
The joint CVCP/UGC Working Group was established in July 1985 in response to the recommendation of the Jarratt Committee. In its Statement, Performance
performance indicators which could be used for the internal management of individual institutions and the evaluation of university performance. The list of performance indictors includes those for which the information was already available and those for which the information needed to be collected.
The Statement claimed that teaching and research were the major focus, but it did not specify performance indicators related to teaching outcome apart from cost and wastage rate which indicate cost saving. As Elton (1987) argued, performance indicators should relate to stated objectives and the objectives for universities are primarily teaching. Nevertheless, the actual focus of the Statement was the expenditure of money, efficiency. This type of managerialist scheme may actually reduce the chances of achieving other kinds of objectives, particularly those concerned with effectiveness, professional development and collegiality (Pollitt, 1987).
The Statement provided the lists of caveats attached to each performance indicator. The lists were useful, but the Statement did not provide additional measures to prevent uncritical use of performance indicators. Therefore the lists will help those of good intent, but they may well have the opposite effect on others (Elton, 1987). In fact, until now, such additional and specific measures to prevent uncritical use of performance indicators have not been developed.
In a second Statement (CVCP/UGC 1987), 39 performance indicators were proposed to be published in the autumn of 1987. The statistics were indeed published under the title University Management Statistics and Performance Indicators , an interesting change of emphasis from Performance Indicators in Universities.
Page (1987), a member of the working group’s technical committee, accepted that the second Statement was primarily concerned with the data that would be published soon. Therefore emphasis may have been given to certain performance indicators simply because the data were readily available. This was open to the criticism that most performance indicator systems in the public sector are ‘data driven’ (Carter, 1989). However, Page argued that universities need to demonstrate that they were properly spending the money they had received and should therefore receive increased funding. Therefore ‘of course, there was an imperative to publish some useful figures by the end of 1987’
(Page 1987).
Performance indicators should be developed on the basis of the specification of objectives. They can only derive their significance when they are deployed within a context where the overall objectives of the system are defined (Pollitt, 1990). However, the second Statement failed to discuss objectives at all.
Nevertheless, the second Statement contained some sound analysis. The stress on trends rather than on a ‘snapshot’ was important and such analysis was in line with general conceptualisations about the role of performance indicators in public service (Cave et al, 1997).
The warning in the second statement that ‘uncritical use of these indicators may seriously damage the health of your university’ was welcomed by the academic community and has been frequently quoted.
- Non completion rates - Degree results
- First destinations of new graduates - Research quality rating.
The 1990 edition (CVCP/UGC 1990) continued to warn that users of the volume need to consider carefully the inferences that can be properly and usefully drawn from the figures. The various editions included an illustrative commentary on the interpretation of some of the indicators along with the usual list of caveats.
The main problem with the performance indicators system developed by those working groups was that it failed to take consumers into account (Pollitt, 1990). The university system has a variety of ‘stakeholders’: payers, management, academic researchers and teachers, students, and employers, but few performance indicators developed address their interests. This issue was not directly addressed in the development of performance indicators until 1999.
2.1.2.2 The Morris Committee
Performance indicators for UK higher education were mostly developed initially in the university sector. The development of performance indicators in the former polytechnic sector was also under political pressure. The Secretary of State sent a letter of guidance to the chairman of the Polytechnics and Colleges Funding Council (PCFC) and stated: 7 look to the Council to develop further indicators of both quality and quantity of institutions’ teaching and would be grateful if it could consider how these might be used as an input to its funding policies and decisions’ (Morris, 1990, para. 1.2). The Morris Committee was subsequently set up by the PCFC .
the PCFC ’to illustrate that the sector is well managed, accountable, performance conscious, a good investment and that its claims for resources are credible’ .Thirteen macro indicators relating to scale and effectiveness, level of resourcing, efficiency and source of funds were suggested. The PCFC endorsed and refined ten of them. The remaining three, which need further development work, were: value-added, quality profiles, and employer / client satisfaction.
On the other hand, the Morris Committee recognised the limitations of performance indicators, and emphasised that institutional performance indicators should be chosen by and relate to the missions, aims and objectives
of each individual college or polytechnic and reflect their differing priorities.
2.1.2.3 The Joint Performance Indicators Working Group (JPIWG)
With the end of the binary line in UK higher education, the Joint Performance Indicators Working Group (JPIWG) was created in order to conform to the letters of guidance from the Secretaries of State.
The Group stated that the main purpose of performance indicators was ‘ to inform institutional managers about the performance of their institution in its various aspects, and particularly in relation to other institutions’ (CVCP, 1995 para1.15). This seems different from the main purpose of performance indicators stated in the White Paper of 1991 where it is stated that ‘the Funding
Councils will be responsible for the development and monitoring of
performance indicators in higher education’(DES, 1991).
The JPIWG recognised the importance of developing performance indicators based on the objectives, and also considered the issue of feasibility of developing performance indicators. The JPIWG suggested that the proposed statistics ‘should be sufficiently flexible in their construction and application to reflect the wide diversity of institutional missions and objectives’ and that the data ‘should wherever possible, be available from existing sources’ (CVCP,
In 1994, the JPIWG issued a consultative document in which it listed 88 proposed indicators in five categories: 10 teaching; 14 research; 23 financial health; 4 estate; and 37 macro. This received a generally favourable response from institutions. This explicitness about the various categories of indicators was something never achieved in University Management Statistics and Performance Indicators and reflects the considerable level of technical development work undertaken by the JPIWG’ (Cave, 1997, p64).
It is worth noting that value-added was not included in the list of teaching performance indicators proposed. It is stated that
Comparison of inputs and outputs flowing from indicators of students progression / achievement could allow a relative crude value-added measure to be calculated, using entry and exit qualifications. However, we appreciate that this is a complex and potentially awkward area and we recommend that further work should be undertaken to develop a more sophisticated value-added indicator... (JPI WG, 1995, p17).
Student progression rates were introduced. “Standardised comparators” was proposed to be used to calculate progression rates in order to take into account the factors: entry qualifications, subject mix and gender mix. Nevertheless, it is also noted that
In some cases differences may reflect teaching quality. In other cases differences may reflect other factors, including students’ individual characteristics and circumstances (JPIWG, 1995, p13)
can take some factors into account.
2.1.2.4 Higher Education Management Statistics Group (HEMS)
To take the work forward and publish the data, HEMS was created and took over responsibility in this field from the JPIWG. It took the JPIWG’s report as its starting point and reviewed and refined some of the macro statistics. However, it did not intend to produce a successor to the University
Management Statistics and Performance Indicators volume. Institutional
statistics and macro statistics were planned to be published separately.
The HEMS Group (1995) developed the JPIWG indicators, added a few specific measures and proposed the four sets of management statistics for publication in 1996. The four sets of management statistics were macro statistics for teaching; macro finance statistics; institutional statistics for teaching; and institutional financial profiles. The statistics listed are narrower than had been initially proposed by the CVCP/UGC Working Group in 1986.
2.1.2.5 Performance Indicators Steering Group (PISG)
In November 1997, the Secretary of State for Education and Employment asked the HEFCE to develop suitable indicators and benchmarks of performance in the higher education sector. The Performance Indicators Steering Group was established.
The terms of reference of the working group were
... to develop appropriate performance indicators and benchmarks which
recognise the diversity of the sector and
It can be seen, from their terms of reference, that this working group places the emphasis on ‘the diversity of the sector5 and ‘different stakeholders5 which is different from previous working groups.
The working group was able to take account of the work of HEMS. Publishing institutional-level indicators for teaching and research is a priority of the working group, and the progress has been made in measuring : participation of under represented groups, student progression, learning outcomes (including non completion), efficiency of learning and teaching, student employment, and research output.
It should noted that the indicator, ‘participation of under-represented groups’ may address the objective of ‘widening access5 to higher education, but it can only indicate achievement of the objective in terms of quantity, and does not measure the achievement in widening access to higher education in terms of quality. A value -added performance indicator would be a good indicator to measure such an achievement.
As far as technique is concerned, the ‘adjusted sector5 benchmark approach, which takes some factors into account, has been adopted in preference to more sophisticated modelling techniques. The Group suggested that sophisticated models should not be used directly in constructing performance indicators. Three reasons were given for this suggestion:
Steering Group, 1999, p35)
The above reasons indicate that the development of performance indicators in the UK places more emphasis on the feasibility of use of performance indicators in practice than before. This is consistent with experience in the USA. Ewell and Jones (1994) noted that many promising indicator systems fail simply because they are too expensive, too complex, too time-consuming, or too politically costly to implement. Often the simplest is the best, even if it initially seems less technically attractive.
In December 1999, the higher education sector’s first performance indicators were published (HEFCE, 1999). The publication was generally welcomed by the university community such as the Committee of Vice-Chancellors and Principals, and the Association of University Teachers. The performance indicators are seen as a way of demonstrating some of the major achievements of the sector. The Higher Education Funding Council suggested that universities have the autonomy to decide what to do about their relative performance, and the role of the funding council is to provide support to identify those which are performing the best and how they are getting it right. The performance indicators published, reflecting the work of the PISG, include participation of under-represented groups in higher education, drop-out rate, share of research output, and learning outcomes and efficiencies. Indicators of employability are absent (HEFCE, 1999). It is criticised that the calculation of the benchmark figure does not condemn universities with higher entry qualifications and certain subject mixes for recruiting fewer students from lower socio-economic groups (Goddard, Thomson and Wojtas, 1999). A certain bias is implied which value-added might reduce.
2.1.3 The framework of performance indicators in higher education
‘inputs - outputs - outcomes’ approach (see Richardson, 1994). According to a conceptual production theory, the process of higher education is a production process which transforms inputs (e.g. students, academic and non academic staff, building, equipment, heating, and telephone etc.) into outputs (e.g. graduates, research publications, patents...etc.) and higher education itself is a part of a wider economic and social process.
The production function indicates the maximum possible output which can be obtained by a production unit (e.g. a firm) from a given set of inputs (e.g. raw material, labour input, capital input, technical knowledge, and consumables etc.). Therefore when production theory is applied to the university sector, it would allow an assessment of the efficiency of universities.
However the university sector is not like other industries. There are some problems which arise when this production theory is used in the university sector. We will discuss this in next section.
2.1.4 Measuring output and input of universities
2.1.4.1 Difficulties with measuring output and input of universities
In most commercial activities, output can be measured in monetary units, but this is difficult or impossible in the university sector. Johnes and Taylor (1990) suggested that universities aim to produce four main categories of output: output derived from teaching activities, output derived from research activities, output derived from consultancy and related activities, and cultural and social outputs. However, these outputs are very different and can not be added together in any meaningful ways. Therefore it is necessary to specify the individual outputs a university produces and inputs which these individual outputs are dependent upon. Nevertheless, in the university sector, inputs are often used to produce more than one output, therefore it is very difficult to attribute a specific input to a specific output.
research degrees. Research output can affect teaching output by affecting the inputs which determine teaching output. For example, good research records usually attract students with high academic ability (see Johnes and Taylor, 1990 and Cave, 1997).
A further difficulty is that many outputs and inputs are not quantifiable. For example, the quantity of research publications produced by a university may be a measure of the amount of research output, but it ignores the quality of research output. As far as teaching output is concerned, we can measure the number of graduates, the degree classifications, and the first destination of graduates, but how should all this information be added together to produce a measure of the teaching output of an institution?
Johnes and Taylor (1990) concluded that ‘measuring the output of universities is therefore an extremely complex problem.’ Nevertheless, higher education can not give up the attempt to measure its output because of the demand for evaluation of universities.
2.1.4.2 The techniques of measurement used for the evaluation of efficiency
Historically, a number of techniques have been used to evaluate efficiency in the public sector. These techniques are regression analysis, cost - benefit analysis, and cost-effectiveness (Cave, et al 1997). All these techniques involve establishing some relationship between inputs and output.
points. The closer the fit of points to the line, the greater the variation in proportion of good degrees ‘explained’ by the factor, staff - student ratios.
Regression analysis can be used to evaluate the performance of individual departments or institutions by comparing the actual output with expected outputs for a given level of inputs. This may be explained by using the above example. If the above hypothesis is proved to be true, given a level of staff - student ratio of a department, we will be able to predict the expected proportion of students with a good degree. Thus, the differences between actual and expected proportion of students with a good degree can be used as a measure of performance of the department.
The technique of cost - benefit analysis (see Layard and Glaister, 1994, or Weale, 1992) attempts to ’evaluate the efficiency of higher education by measuring the rate of return on investment in higher education either for the economy as a whole (the social return), or for the individual students. It is seen as one of the most ambitious techniques which has been used to appraise the efficiency of higher education. However, in practice, there are some difficulties with using this approach. For example, it would be difficult to establish the economic benefits associated with research output.
Cost - effectiveness analysis is another technique in which inputs are measured in cost terms and output in physical units (e.g. number of graduates), or both output and input are measured in physical units and are combined to produce productivity measures (e.g. staff - student ratio). In many cases, the cost- effectiveness measure itself is a form of performance indicator. The disadvantage of this approach is that when it uses physical units to measure output, quality of output can not be reflected.
spent on libraries or computers are both teaching and research costs. As noted earlier, it is also difficult to separate output of research and output of teaching.
2.1.5 Definition of performance indicators
Despite the introduction of performance indicators into higher education in the UK for over a decade, there is no single authoritative definition or interpretation of their nature (Cave, 1997).
Laurillard (1980) defined performance indicators in the broadest sense and suggested that the very properties of performance indicators, which make them useful, are that ‘they reduce a complexity of subjective judgements to a single objective measure’ and ‘they are context - free.’ Nevertheless, she went on ‘these very properties also call into the question the validity of the indicators themselves’. The property of performance indicators, that they reduce complexity, was also pointed out by Frackmann (1987): ‘ The more complex the reality, the more a need to ‘abstract’ prevails, if manageability is felt as at all a necessity’, therefore ‘ performance indicators stand for simplified information that is needed for management and organisation.’
In the survey carried out in the mid 1980s under the Organisation for Economic Co-operation and Development (OECD)’s Institutional Management in Higher Education (IMHE) programme, performance indicators were defined as:
‘numerical values which provide a measurement for assessing the quantitative or qualitative performance of a system and which can be derived in different ways’ (Cuenin, 1987, p6).
Cuenin explained that this definition was deliberately very broad since the international survey covered seventy institutions in fifteen countries in which the concepts of performance indicators used were not identical.
expressed in the form of absolute figures, and are intended to provide a relatively unbiased description of a situation or process. For example, the number of graduates would be a simple indicator. Compared with performance indicators, simple indicators are more neutral, but a simple indicator may become a performance indicator if a value judgement is involved.
Performance indicators differ from simple indicators in that they imply a point of reference, for example a standard, an objective, an assessment, or a comparator, and are relative rather then absolute in character. Cuenin pointed out that there is ambiguity in some cases, therefore he proposed a general rule to avoid such ambiguity. He suggested that performance indicators should have the following property:
when the indicator shows a difference in one direction this means that the situation is better; whereas, if it shows a difference in the opposite direction, then this means that the situation is less favourable. The way in which the data are to be interpreted ought to be obvious (Cuenin, 1987, p10)
General indicators are those which in the main are derived from outside the situation and are not indicators in the strict sense- they are frequently opinions, survey findings or general statistics. Although they may not conform exactly to the definition of an indicator they are used in decision making (Cuenin, 1987).
The CVCP/UGC (1986) Working Group in their first statement defined performance indicators as ‘ statements, usually quantified, on resources employed and achievements secured in areas relevant to the particular objectives of the enterprise’. They emphasised that indicators are signals or guides rather than absolute measures and indicators do not necessarily provide direct measurements of inputs, processes and outputs, but they can offer valuable information in relation to them.
statistics under the title University Management Statistics and Performance indicators. Page (1987) claimed that the term performance indicators ‘are an abbreviated way of referring to all those numerical data which are useful in managing a university, assessing its operations, costs and performance’ therefore this title, 'University Management Statistics’ is better than
Performance indicators.
Yorke (1991) and Sizer (1992) noted that there was something of a distinction to be drawn between performance indicators and management statistics. Sizer (1992) suggested the relationship between indicators and statistics is that
While indicators which are more or less valid expression of objectives formulated by one of the parties involved, statistics merely have to meet the standard of reliability. Statistics must be organised in such a way that a number of indicators can be constructed on their basis, since objectives vary and will therefore produce a variety of indicators. The reliability of the statistical records will ‘reflect’ on the indicators and without reliable basic information, we are unable to produce reliable indicators.
Yorke (1991) also pointed out that a management statistic at one level can become a performance indicator at another. The Joint Performance Indicators Working Group (JPIWG, 1995, para. 1.8) then, in their statement, suggested that
...proposed indicators might be better described as management statistics rather than performance indicators. Institutions could, if they so wished, convert these statistics into performance indicators...
a measure - usually in quantitative form - of an aspect of the activity of a higher education institution. The measure may be either ordinal or cardinal, absolute or comparative. It thus includes the mechanical applications of formulae... and can inform, and be derived from, such informal and subjective procedures as peer evaluations or reputational rankings (Cave et al, 1997, p24)
This definition looks very ambitious, but ‘it seems to run out of steam as it is elaborated’ (Yorke, 1996, p1). It mentions that the measure may be ordinal or cardinal, but fails to mention that the measure may also be interval or categorical. Yorke points out that a performance indicator becomes such only where there is a criterion explicitly or implicitly applicable to the activity concerned, and that criteria themselves reflect value-positions regarding activities.
Yorke suggested that it is perhaps wise not to be too ambitious in attempting a definition, and that for the purpose of a particular text, programme quality, in his research.
a performance indicator is taken to be a marker of the extent to which a particular purpose is being achieved: the purpose may, of course, be articulated at any of a number of levels ranging from the sectoral to the personal (Yorke, 1996, p1)
He then explained that it is necessary to be able to state what the various purposes are, to articulate the values underlying these purposes, and to know what evidence will be taken as indicative of good and poor performance.
performance indicators.
1 also think that Cuenin's distinction between simple indicators and performance indicators is very important in defining performance indicators. I believe that performance indicators are made of simple indicators. A simple indicator or a number of simple indicators becomes a performance indicator or performance indicators when one chooses to use it or them as a measure of achievement of an objective. For example, the proportion of good degrees is a simple indicator, but when one chooses it as a measure of quality of teaching, it becomes a performance indicator. Performance indicators always consist of simple indicators. So in this sense, performance indicators are those simple indicators which are chosen to be used as a measure or measures of achievement of an objective.
Therefore performance indicators are both objective and subjective. The objective property is from simple indicators. As Cuenin noted, simple indicators are neutral and more objective. The decision about which simple indicators are used as a measure of achievement is subjective.
2.1.6 The intended use of performance indicators in higher education
Performance indicators may be used at different levels of the higher education system. They can be used to indicate performance of the system as whole, performance of sectors, or performance of individual institutions, departments, programmes, subjects and individuals.
Performance indicators may be used for different purposes. Size, Spee and Bormans (1992) summarise five core uses of performance indicators:
i) Monitoring: the ability to register developments in the system.
ii) Evaluation: the ability to comment on the degree of goal attainment iii) Dialogue: the improvement of mutual administrative relationships.
v) Resource allocation: performance indicators can be used as parameters in the resource allocation model.
Nedwek and Neal (1994) suggest six types of use of performance indicators some of which overlap with the above categories of use. For example, monitoring condition, measuring progress toward specific goals, and allocation decision making. Nevertheless, they also suggest that performance indicators can be used to forecast problems, and diagnose problems and can be used as political symbolism by those politicians who are concerned that they are ‘doing something’ about post-secondary education.
However, in practice, performance indicator schemes have placed a heavy emphasis on the purpose of resource allocation (purpose v). They were mainly developed to indicate areas of potential cost saving or raise questions about the organisation of resources. The dominant concern appeared to be efficiency. In contrast, those purposes about effectiveness (e.g. purposes ii and iii) appeared in some schemes, but less commonly. This can be seen from ‘the development of performance indicators in higher education in the UK’, discussed in section 2.1.2.
However, Cave et al (1997) noted that in the UK a prime concern with the potential of performance indicators to aid funding bodies to allocate resources or to call institutions to account for the efficient use of resources, seems to have given way to concern that individual institutions can effectively assess their own performance and act upon that assessment.
Nevertheless, on the whole, as Banta and Borden (1994) noted, many external agencies responsible for funding higher education seem more interested in performance indicators as a means of demonstrating that colleges and universities are using their resources wisely, whereas faculty and campus administrators are most supportive of outcomes assessment that will help them improve teaching and learning, the overall student experience, and administrative processes. The quality improvement literature suggests that performance indicator systems must move from certifying competence to improving institutional quality (Nedwek and Neal, 1994).
As we noted earlier, in the UK, recently, the higher education sector’s first performance indicators were published ( HEFCE, 1999). Three reasons were given for publishing these performance indicators: to give information to the public about the performance of universities and colleges; to give managers data to help them manage their institutions; and to ensure public accountability (Bekhradnia, 1999). The reasons may indicate that performance indicators are intended to be used for the purposes of both accountability and improvement.
How should performance indicators be used? Several researchers (e.g. Moravcik, 1986, Jesson and Mayston, 1990, Banta and Borden,1994 and Cave et a l, 1997) suggest their standards for the use or development of performance indicators. The most significant one is suggested by Banta and Borden. Drawing on their own experience, Banta and Borden (1994) suggest five standards for developing performance indicators for use within institutions:
b) Aligning performance indicators throughout the organisation or system.
Within an institution, constituent colleges or schools should have goals that contribute to the institutional mission, and departments or other units that make up each college or school should likewise have goals that complement those of their schools and of the institution (vertical alignment).
c) Aligning performance indicators across inputs, processes, and outcomes
we should give more attention to the intervening processes that use resources to produce outcomes. We need to examine carefully the processes that lead to outcomes if we hope to improve them.
d) Co-ordinating a variety of methods. Performance indicators should be derived from a variety of co-ordinated methods.
e) Using performance indicators in decision making. Performance indicators should be used to inform decision making. They should be used to provide evidence of accountability or direction for improvement, preferably both.
2.2 Context
2.2.1 The role of teaching in higher education and the need for developing performance indicators of teaching in higher education
Universities were essentially funded as teaching and research institutions, yet research was given much more status and priority. The main reasons for this phenomenon may be summarised into two aspects. The first aspect is
The best research advances knowledge (Aitken, 1991). All these created the risk that teaching would receive less attention than research. This would possibly lead to teaching quality decline (Elton, 1987). Therefore there is an increasing pressure to evaluate teaching performance in the UK. In fact, such a pressure exists not only in the UK but also in other countries such as the USA, Australia and New Zealand (Miller, 1986; Boyer, 1989; Moses 1989; Clift eta!
1989).
Additionally, as noted earlier, in UK and before 1992, there was binary line in higher education. On the one side of the binary line, old universities see teaching as induction of students into disciplinary knowledge and the concepts. They emphasised research and scholarship. On the other side of the binary line, the polytechnics, new universities have a strong teaching culture, and ‘research is not a primary concern for the majority of academic staff’(Sizer, 1989). Nevertheless, the abolition of the binary line has made new universities compete for research funding. Their traditional educational culture seems to be undermined. Therefore, there is a need to give more attention to teaching and a need for evaluating teaching in UK.
The 1987 White Paper (DES 1987) suggested that the quality of teaching should be appraised. This White Paper suggested the list of performance indicators which include: non-completion rates; the subsequent employment patterns of students; and students' achievement compared with their entry standards. Nevertheless, as Sizer (1989) pointed out that to date, publicly available Pis of comparative teaching quality are little more than a desirable objective. Despite this, some potential performance indicators of teaching have been developed. The next section will discuss main performance indicators of teaching.
2.2.2 Main performance indicators of teaching in higher education in the UK
indicator, it may be worth briefly sketching research on the development of other performance indicators of teaching in higher education in the UK. By doing so, we can see the general technical and practical difficulties with the development of performance indicators of teaching in higher education. Cost measures, student progression rates and exit qualifications, and employment and first destinations are those indicators which are widely discussed and appear regularly in the lists of potential performance indicators of teaching in higher education (e.g. Johnes and Taylor, 1990, Cave et al, 1997, Jarratt ,1985, CVCP, 1987, and CVCP, 1995).
Unit costs / Cost measures
Unit costs are a measure of cost per unit of output. In the university sector, it should be the cost per graduate (output). Nevertheless, in practice, cost per student (input) is more widely used. The two are different when not all students become graduates. Naturally, in principle, a comparison of the average cost per student or graduate between institutions would indicate performance of institutions in terms of efficiency.
giving arbitrary weights to staff and students.
Activity based cost (ABC) is a new approach to measuring costs. The basic idea of the ABC method (Rimson 1991) is first, establishing what activities are required to produce particular outputs ; second, establishing what inputs are required for each activity; third, calculating cost of these inputs. Although, the ABC method has been used by some UK universities (Mitchell, 1996), it is still in its infancy (Dehayes and Lovrinic 1994 ).
Cave et al (1997) point out some difficulties with the interpretation of high cost per student when average cost is used as a measure of comparative efficiency. By one interpretation high unit cost (a high staff-student ratio) may be taken as an indicator of a high quality education process, because high staff-student ratio may be associated with more time allocated to students, and there may be a direct relationship between teaching time and student quality. By the second interpretation high unit cost leads to opposite conclusions. ‘If degrees of the same grade are of the same quality, irrespective of the awarding institution, and if the value-added to an individual of obtaining a degree of the same class is the same for all institutions, then average cost may, in certain conditions, be used as an index of efficiency. However, the conditions required for such a conclusion to be valid for inter-institution comparisons are fairly restrictive.’
However, although there are difficulties with using unit cost as a performance indicator, some unit cost data are still included in the list of Higher Education Management Statistics for publication in 1996.
Student progression rates and exit qualifications
The report by the JPIWG in 1995 suggests using student progression rates and exit qualifications as one of the performance indicators of teaching instead of non-completion rates or wastage rates (CVCP, 1995).
the one hand, may indicate poor quality of teaching, but on the other hand, maintenance of a high academic standard may mean that a certain level of wastage is unavoidable (Cave 1997). Another factor is associated with the policy of widening access to higher education. The policy of widening access to higher education encourages institutions to lower their admission standards (Baker 1987). Nevertheless, ‘...as a result of taking more ‘higher risk’ students, institutions had a higher wastage rate for which they are penalised’ (Cave et al
1997). The third factor, as the JPIWG stated, the change from wastage rates to students' progression had been strongly influenced by a profile framework. The profile model (Williams 1994) is a student centred approach which suggests a comprehensive measure of student progression from the moment entry is being contemplated to the point at which the student moves on from the completed programme of study to further study or employment. Therefore the approach measures not only output, but also input and process.
Three indicators for student progression and exit qualifications recommended by JPIWG are:
Inability to progress: measures the proportion of students assessed as being unable to progress.
Leave in good standing: measures the proportion of students who are assessed as being able to progress but who chose to leave the institution or switch the subject of their qualification aim
Proportion who qualify: means the proportion of students at each institution who qualified in the particular qualification aim. (CVCP, 1995, p13)
pathway A: choose to leave HE pathway C: retake the course
pathway D: take another course at the original level
pathway E: go to another institution at original level (CVCP, 1995, p45)
Nevertheless, these 12 pathways still have not solved the problem. The JPIWG consultation exercise in 1994 found that
‘one set of critiques drew attention to the huge variety in patterns of enrolment for study and options for progression that now exist in higher education. This makes it increasingly difficult to decide whether or not students can be said to have left a programme or succeeded in a qualification aim. The growth in numbers and types of off-campus learners also makes it more difficult to define what is meant by a student.’(JP\V\IG 1994, quoting from (Cave et al 1997).
Above all these made it very difficult to calculate progression rates in practice.