METHOD DEVELOPMENT AND VALIDATION OF SIROLIMUS IN
HUMAN WHOLE-BLOOD SAMPLES BY LC-MS/MS
Srinivas Ankanagari1, 2 Tamilselvi Manickam2* and Tharuvai Subramanyam
Jaishankar 2
1
University College of Science, Department of Genetics, Osmania University, Hyderabad, India.
2
Quest Life Sciences Pvt. Ltd., Chennai, India.
ABSTRACT
Sirolimus is an immunosuppressive agent. It is a macrocyclic lactone produced by Streptomyces hygroscopicus and used in organ transplantation. Our aim was to develop a robust sensitive and selective liquid chromatography-tandem mass spectrometry (LC-MS/MS) method for determination of sirolimus in human whole-blood samples. We used LC-MS/MS system and atmospheric pressure ionization tandem mass spectrometry in the multiple reaction monitoring (MRM) detection mode. The whole blood was collected in the K3EDTA vacutainer taken from healthy human volunteers. Chromatographic conditions and other parameters were suitable for using this method. Total analytical run time was 1.6min, and retention times of analyte and internal standard were 0.88 and 0.86 minutes respectively. This LC-MS/MS method can be preferable for quantification of sirolimus in whole blood sample. Sample preparation was short and simple. It determined sirolimus drug selectively in human whole blood samples.
KEYWORDS: Method development, validation, sirolimus and human whole blood.
Abbreviations: LC-MS/MS: Liquid chromatography-tandem mass spectrometry IS: Internal standard.
1. INTRODUCTION
Sirolimus is an immunosuppressive drug with a molecular mass of 913.6 Da [1] used in organ transplantation. [2] especially useful in kidney transplants. It was approved by the US Food
Volume 3, Issue 10, 583-589. Research Article ISSN 2277– 7105
Article Received on 16 September 2014,
Revised on 10 Oct 2014, Accepted on 03 Nov 2014
*Correspondence for
Author
Dr. Tamilselvi
Manickam
Quest Life Sciences Pvt.
and Drugs Administration (FDA) in the year of 1999, for renal transplants and also known as Rapamycin® (RAPA). In cells, sirolimus binds to the immunophilin, FK binding protein-12 (FKBP-12), to generate a complex, the SRL-FKBP-12 complex does not affect calcineurin activity and inhibits a protein kinase, designated mammalian target of rapamycin (mTOR), which is a key enzyme in cell cycle progression. Inhibition of mTOR blocks cell-cycle progression at the G1 → S phase transition [3, 4]
. Sirolimus inhibits T-cell cycle progression by blocking interleukin-2 production [5]. In general immunosuppressive drugs have narrow therapeutic ranges. They may cause numerous side effects including immunological, renal, hepatic, and neurological complications, requiring dose adjustment or discontinuation in a significant percentage of patients [6, 7]. Traditionally most of the laboratories use immunological methods for quantification of immunosuppressive drugs. Due to cross-reactions with metabolites, overestimation of the concentrations is a major problem in this drug by using immunological techniques [8, 9]. LC-MS/MS was used for its high sensitivity and exclusively specific for the parent compound. Relatively the cost of the method also decreased when it compared to other methods. This method is more specific and sensitive than other immunological methods for sirolimus drug. LC-MS/MS is generally accepted as the technique of choice to study and quantify sirolimus in whole-blood samples. The validation was performed in compliance with Good Laboratory Practice and regulatory guidelines [10, 11].
2. METHOD
EDTA-treated sirolimus blood samples of healthy human volunteers were analyzed by using the LC-MS/MS in the laboratory.
2.1. Chemicals
2.2 Sample Preparation
Spiked whole human blood samples were withdrawn from the deep freezer and thawed at room temperature. 500μL of aliquot of blood sample and 50 μL of internal standard
Tacrolimus (60 ng/mL) were added into 5 mL RIA vial and vortexed for 10 seconds. 500 uL Milli Q water was added in it and vortexed for 10 seconds. After which 50 uL of 0.1M zinc sulphate was added and vortexed for 10 seconds. Sodium bicarbonate 100μL of 0.1M was added in the same RIA vial and vortexed for 10 seconds. 3mL of TBME was added in it and vortexed by using vibromax shaker at 2500 rpm for 10 minutes. Later the sample mixture was centrifuged at 4500 rpm for 10 minutes at 4°C and 2.7 mL of supernatant organic layer was separated and evaporated at 40°C for 10 minutes. The residue was reconstituted with 250 μL of mobile phase and 10 μL of reconstituted sample was injected in to the LC/MS-MS. The
temperature of auto sampler was adjusted at 10°C during the analysis for providing standard experimental conditions.
2.3. Instrumentation
A Thermo TSQ quantum ultra (Thermo Finnegan) equipped with a temperature controlled autosampler and HPLC pumps (Finnegan) was used. Waters XTerra RP 18 column was used for the analysis.
2.4. LC-MS/MS
At the beginning of chromatography, 10μL sample was injected into the system. The flow
rate was 0.8mL per minute. Multiple reactions monitoring (MRM) mode was used. The total run time was 1.6 minutes by LC-MS/MS detection, including internal standard. Mass spectrometric detection with a Turbo Ion Spray interface was used for detection of the Sirolimus drug. The capillary temperature was set at 275°C, and the ion spray voltage was adjusted to 5000V. Auxillary and sheath gas pressure was kept as 40 and 60 psi respectively.
3. RESULTS AND DISCUSSION
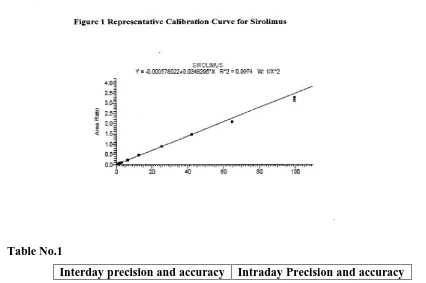
The matrix used for preparation of calibration curve standards and QC samples were screened for interfering endogenous substances and were found to be free from interfering substances. No endogenous peaks were noticed at the retention time of sirolimus and the internal standard [IS], tacrolimus. The calibration curve was established by using 1/x2 weighing method and the r2 value of calibration curve was 0.98. The appropriateness of validated method during subject sample analysis was ensured by organizing the analytical batch comprising of subject samples along with appropriate number of quality control samples. The data on precision and accuracy for the quality control samples of within batch coefficients of variation ranged between 3.67 to 15.10% and the percentage of nominal concentration ranged from 93.29 to 105.19% for sirolimus. The data on precision and accuracy for the quality control samples of between batch coefficients of variation ranged between 6.42 to 10.95% and the percentage of nominal concentration ranged from 95.87 to 101.73% for sirolimus as shown in Table No. 1.
LC-MS/MS assay permits sensitive and selective quantification of sirolimus in human whole-blood samples. We used mobile phase containing methanol:10 mM ammonium acetate (95:5) v/v, and the total analysis time was 1.6 min for analyte and internal standard. The representative calibration curve of sirolimus is shown in Figure 1. Acquired chromatogram was obtained by using the computer based software supplied by Thermo LC Quan 2.5.6. For system performance evaluation, we determined the limits of detection (LOD), the lower limits of quantification (LOQ), the squared correlation coefficients (r2) the recovery rates, the standard deviation values, and the accuracy values. LOD and LOQ were estimated by injecting whole blood samples spiked with the analytes at low concentrations. The LOQ of sirolimus was 0.805 ng/mL, the assay was linear over the range of 0.790 to 99.739 ng/mL and r2 was 0.98.
unextracted appropriately diluted standard solutions. Total mean recovery of sirolimus and internal standard were 36.35 and 46.36% respectively. We compared the stabilities of sirolimus and internal standard tacrolimus in whole-blood samples by measuring, in six replicate assays, of stored samples over a different time periods along with freshly prepared the stock dilutions of same concentrations and found to be stable for five days (Table No.2).
[image:5.595.65.491.481.764.2]Validation of analytical method is an important criterion to optimize the analysis of drugs in the developed method and to assure the quality and reproducibility of it. A wide variety of analytical methods have been reported in the recent and past for the determination of sirolimus in biological fluids. The methods used different internal standards, reversed phase columns with different particle size, different internal diameters and different mobile phase compositions for the quantification of sirolimus by using HPLC [12]. Here we used LC-MS/MS for determination of sirolimus drug in human whole blood. In this method of study, the total procedure of LC-MS/MS method is very simple and has high specificity for determining drug concentrations. Interfering effects of the sample matrix are an important problem in quantification of immunosuppressive drug. In this study, better matrix component elimination was achieved by using LC-MS/MS.
Table No.1
%CV 3.67-15.10 6.42-10.95 % Accuracy 93.29-105.19 95.87-101.73
Table No.2
Stock solution stability of analyte Stock solution Stability of IS
Area of analyte 0 day Area of analyte
5 days Area of IS 0 day Area of IS 5 days
Mean 1626255 1543742 Mean 5467517 5290438
% Stability 94.93 % Stability 96.76
4. CONCLUSION
Here, we present a LC-MS/MS method for determination of sirolimus in whole blood samples. This method had shown consistent reproducible recovery of both analyte and internal standard. In this method the sample preparation procedure was very simple, the cost of total analyses was very low, and the time needed to do the analysis was very short.
Conflict of Interests: Authors report no conflict of interests. The authors alone are responsible for the content and writing of the paper.
5. REFERENCES
1. Sehgal SN. Rapamune (Sirolimus, rapamycin): An overview and mechanism of action. Ther Drug Monit, 1995; 17(6): 660-665.
2. Kaufman DB, Shapiro R, Lucey MR, Cherikh WS, Bustami RT, and Dyke DB, Immunosuppression: practice and trends, American Journal of Transplantation, 2004; 4(9): 38–53.
3. Harvey RA, Champe PC. Immunosupressants. In: Lippincott’s Illustrated reviews in Pharmacology. Fourth Edition, New Delhi: published by Wolters Kluwer Pvt. Ltd; 2009; 492-493.
4. Krensky AM, Vincenti F, Bennelt WM. Immunosupressants, Tolerogens and Immunostimulants. In: Brunton LL. Goodman and Gilman’s, The Pharmacological basis
of Therapeutics. Eleventh edition: Medical publishing division, 2006; 1413-1414.
6. Nashan B, Maximizing the clinical outcome with mTOR inhibitors in the renal transplant recipient: defining the role of calcineurin inhibitors, Transplant International, 2004; 17(6): 279–285.
7. Rezzani R, Cyclosporine A and adverse effects on organs: histochemical studies, Progress in Histochemistry and Cytochemistry, 2004; 39(2): 85–128.
8. Ansermot N, Fathi M, Veuthey JL, Desmeules J, Rudaz S, and Hochstrasser D, Simultaneous quantification of cyclosporine, tacrolimus,sirolimus and everolimus in whole blood by liquid chromatography-electrospray mass spectrometry, Clinical Biochemistry, 2008; 41 (9): 728–735.
9. Good Laboratory Practice regulations. London: The Stationery Office, 1999:1–26.
10.US Department of Health and Services Food and Drug Administration. Guidance for industry Bioanalytical methods validation for human studies, 2001.