ENVIRONMENTAL IMPACT OF GROUND WATER QUALITY
PARAMETERS IN DINDIGUL DISTRICT, TAMIL NADU, INDIA
P. Pavatharini1, R. Umamaheshwari1* and S. Krishnamoorthy2
1
PG and Research Department of Zoology, A.P.A College for Women, Palani, Dindigul
District.
2
Department of Biotechnology, The Madura College, Madurai.
ABSTRACT
In this present study, Tannery effluent and four ground water samples
were randomly collected from the observation wells and analyzed for
various physiochemical constituents by APHA methods. Water
samples were collected in sterilized clean high density polythene
bottles from Dindigul district. Water sampling areas mentioned as
GW1 to GW4 (GW1-Nagal Nagar; GW2- Angu Nagar; GW3-
Begampur; GW4- Palani road). The study report shows that pH of
Dindigul district ground water is ranges from 6.6 to 8.1. Total
dissolved solids and Electrical conductivity were found moderate in
GW1 to GW3 but in GW4 is slightly increase the conductivity were
recorded maximum. The Calcium, Mg, and Fe were recorded maximum in GW4 site rest of
others were permissible limit. Free NH3 was found maximum in GW4 (0.6 mg/L), in tannery
effluent water (3.45mg/L). The calcium values were recorded between 220 and 320 mg/l. The
magnesium values are recorded between 118 and 135 mg/l for the groundwater samples.
Nitrite was observed high in Tannery effluent (1.0mg/L). The value of chloride for all the
ground water samples is ranged from 100 - 340 mg/l. Phosphate was found objectable limit in
GW 4 (1.4mg/L) and Tannery effluent (1.4mg/L).The fluoride values for all the ground water
samples are well exceeding the permissible limit. The sulphate values for the ground water
samples are exhibited between 20 and 38 mg/l. Finally, the result was concluded that the
Tannery effluent water discharges impact on the ground water quality and makes
contaminated at few sampling sites namely GW4 (Palani Road) > GW3 (Begampur) >
GW1(Nagal Nagar) > GW2 (Angu Nagar). These ground water samples are not advisable to
take as drinking purpose.
Volume 6, Issue 14, 1165-1174. Research Article ISSN 2277– 7105
Article Received on 20 Sept. 2017,
Revised on 10 October 2017, Accepted on 31 October 2017
DOI: 10.20959/wjpr201714-10055
*Corresponding Author
R. Umamaheshwari
PG and Research
Department of Zoology,
A.P.A College for Women,
KEYWORDS:Tannery effluent, Ground water, Water pollution, Dindigul district.
INTRODUCTION
Pollution is an undesirable change in physical, chemical and biological characteristics of our
environment that may or will destructively affect the human life and living conditions
(Yadhav, 2012). Industrialization is generally thought to be the universal remedy for
economic backwardness. Mounting pressure on industrialization to withstand, in the context
of advancement towards economic stability is constantly degrading the environment through
air, water and soil pollution (Rao et al., 1995). Pollution by industrial effluents is a global
phenomena. The acidic and alkaline impurities, heavy metals, toxic substances and solids
from electroplating, textile, fertilizers, pulp and paper mills, sugar mills cause damage to
metal and concrete structures by their corrosive activity and destroy micro organisms
affecting the aquatic life. If the effluent is let on land for solar evaporation, or used for
irrigation of agricultural crops, the pollutants may reach ground water table and thus
contaminate ground water (Manivasakam, 2008).
Ground water was once considered to be free from pollution. But the rapid industrialization
made a paradigm shift to this concept. The various uses include industrial, agricultural, and
human needs. The arbitrary disposal of industrial wastes on mother earth slowly makes the
groundwater vulnerable to pollution. Groundwater when once get polluted, its cleansing is
hopelessly difficult. Many researchers had reported that a large number of monitoring studies
have been carried out in the last 3-4 decades to evaluate the underground water pollution and
its impact on human health, animals and agricultural crops (Shrinivasa Rao and
Venkatashwaralu, 2000; Jain, 2002;Shyamala et al., 2008; Patil and Patil 2010 and
Gopalakrishna, 2011). These studies have reported the presence of hazardous chemical
species due to natural as well as anthropogenic sources in the underground water.
The tanning industry is one of the oldest and fastest growing industries in south and
south-east Asia. The states of Tamil Nadu, West Bengal and Uttar Pradesh together have 88% of
the tannery units of the country. About 55% of total leather processed in the county is from
Tamil Nadu and tannery units mainly spreads over Pallavaram and Chrompet in Chennai,
Ranipet, Ambur, Vaniyambadi, Pernambut of Vellore, Begambur of Dindigul, parts of Erode
Dindigul is the second important trading centers now a day in India. Tanneries use a large
number of chemicals during the process, discharging toxic wastes (effluents) into the streams,
which drain into ponds, thereby polluting the groundwater. Over the years the groundwater in
the areas where tanneries are located, has become intolerably polluted.
In order to understand better the water quality, nature of the source and pollutant migration
and distribution, the present study investigates the several aspects of ground water of
Dindigul city.
MATERIALS AND METHODS
Tannery effluent and four ground water samples were randomly collected from the
observation wells and analyzed for various physiochemical constituents by APHA methods.
Water samples were collected in sterilized clean high density polythene bottles from Dindigul
district. Acidifying the water samples after every collection and take to the samples at
laboratory within a day. The samples were analyzed at TWAD BOARD, Madurai,
TamilNadu (Physical and Chemical parameters) by BIS, (2012) and APHA, (1998) method.
The following parameters were analyzed such as Color, Odour, Turbidity, TDS, Electrical
conductivity, pH, Total Alkalinity, Total Hardness, Ca, Mg, Fe, Manganese, Free NH3, NO2,
NO3, Cl, F, SO4 and PO4 . Water sampling areas mentioned as GW1 to GW4 (GW1-Nagal
Nagar; GW2- Angu Nagar; GW3- Begampur; GW4- Palani road).
RESULTS AND DISCUSSION
In this present study, analysis of tannery effluent water and ground water quality in four
locations was carried out to determine the physical and chemical characteristics of water. pH
is determined by using pH meter; Dissolved Solid is determined by using TDS meter. The
other parameters are measured by using different standard methods. (APHA, 1998). Total
alkalinity was determined by visual titration method using methyl orange and
phenolphthalein as indicator. Total hardness and calcium were measured by EDTA titrimetric
method using EBT indicator respectively. Chloride is determined by Argentometric method
using potassium chromate indicator.
In present study results indicates that the quality of water varies from location to location.
The pH value of a water source is a measure of its acidity or alkalinity. For most reaction as
well as for human beings, pH value 7.0 is considered as best and ideal. The pH is range from
5.20 is acidic condition.The permissible limit of pH for drinkingwater is 7.0 - 8.5 (WHO).
The groundwater sample s found tobe within the acceptable limit of WHO. There is no
abnormalchange of pH in the groundwater samples. If the pH is foundbeyond the permissible
limit, it affects the mucous membrane ofcells. Mohamed and Zhair (2013), reported that pH
of dindigul district ground water is ranges from 6.6 to 8.1 (Fig.2).
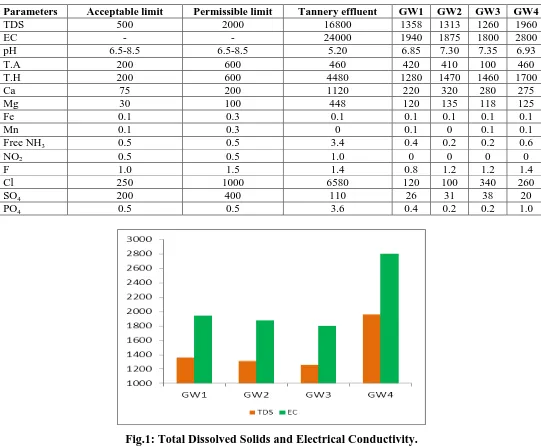
Total dissolved solids and Electrical conductivity were found moderate in GW1 to GW3 but
in GW4 is slightly increase the conductivity were recorded maximum. In tannery water
samples electrical conductivity was found in beyond the tolerate level.The electrical
conductance is a good indicationof total dissolved solids which is a measure of salinity that
affectsthe taste of potable water. Several factors like temperature, ionicmobility and ionic
valences also influence the conductivity.The high conductivity in some of the samples is
likely due to the prolonged and extensive agricultural practices such as irrigation coupled
with the inherent geological conditions acquiring high concentrations of the dissolved
minerals (Sathiskumaret al., 2011).
The total dissolved solids inwater are due to the presence of sodium, potassium, calcium,
magnesium, manganese, carbonates, bicarbonates, chlorides,phosphate, organic matter, and
other particles (Patil et al., 2012). The values ofthe total dissolved solids for all the
groundwater samples vary between 1260 and 1960 mg/l. The maximum allowable limit
oftotal dissolved solids in groundwater for domestic purpose is 2000 mg/l (WHO). The
maximum value (1960 mg/l) is recordedat station GW4 and minimum value (1260 mg/l) is
recorded atstation GW1. According to classification of drinking water on thebasis of TDS
values, all the groundwater samples are found tobe non-saline. In this study, the TDS value
for all thegroundwater samples are well within the permissible limit of1500 mg/l (Fig.1).
Water hardness has no known adverse effects; however, it causes more consumption of
detergents at the time of cleaning and some evidence indicates its role in heart disease (Patil
et al., 2012). Excess hardness is undesirable mostly for economic and aesthetic reasons
(Gopalakrishna, 2011). Total hardness is due to industrial effluent mixed directly on river
basin (Sankaret al., 2011). In present study indicates the total hardness and alkalinity also
recorded maximum in Tannery water sample and GW4 site than that remains.
Mohamed and Zahir (2013) reported that the calcium level in beyond the permissible limit in
recorded maximum in GW4 site rest of others were permissible limit. Free NH3 was found
maximum in GW4 (0.6 mg/L), in tannery effluent water (3.45mg/L) (Fig.4).
Calcium may dissolve readily from carbonaterocks and lime stones or be leached from soils.
But calcium isan essential nutritional element for human being and aids in themaintaining the
structure of plant cells and soils (Shyamala et al., 2008). In this investigation, the estimated
calcium values are recordedbetween 220 and 320 mg/l. For most of the groundwater samples,
the calcium values are found within the maximum permissiblelimit (200 mg/l). The calcium
value is slightly higher thanpermissible limit at all stations, this may be due to the cationicion
exchanges with sodium (Fig.3).
The magnesium values are recorded between 118 and 135 mg/l for the groundwater samples.
The highest value of magnesium is observed at station GW2 and thelowest value of
magnesium is observed at station GW3. Oncomparison with the WHO standard value of
magnesium, in thisstudy it is confirmed that the magnesium value for all thegroundwater
sample is within the maximum permissible limit(100 mg/l). Magnesium generally occurs in
lesser concentrationthan calcium because of dissolution of magnesium rich mineralsis slow
process and calcium is more abundant in earth crust (Jain, 2002) (Fig.3).
The high concentration of nitrate in drinking water is toxic and causes blue baby
disease/methaemoglobinaemia in children and gastric carcinomas (Subramani et al., 2012).
Most of the locations the source of nitrate in groundwater occurs by direct anthropogenic
pollution (septic tanks etc). In urban areas urbanization is leaching of fertilizers in
agricultural area is the source for the high concentration of nitrate in all locations. The result
indicates that nitrate concentrations exceed the standards and are not fit for drinking
purposes. Nitrite was observed high in Tannery effluent (1.0mg/L).
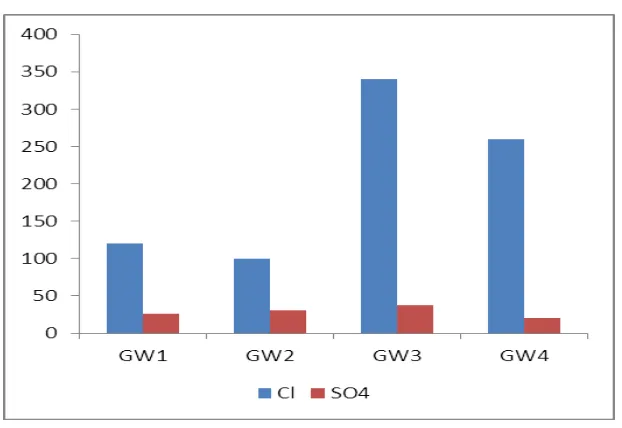
The value of chloride for all the groundwatersamples is ranged from 100 - 340 mg/l. Most of
the groundwatersamples show chloride values within the acceptable limit (250mg/l) of WHO.
The groundwater sample at station GW3 has slightly excess chloride (258 mg/l). Excess
chloride (>250 mg/l) imparts a salty taste to water. Excessive chloride in potablewater is
particularly not harmful but the criteria set for chloridevalue is based on its potentially high
corrosiveness. Soilporosity and permeability also play an important role in buildingup the
chloride value. Increase of chlorine level in water isinjurious to people suffering due to heart
The fluoride ion content should be within 0.5 to 1.0 ppm as suggested by WHO
(2011).Subramani et al.,(2012) showed his study on fluoride contamination more than
acceptable limit in Coonor Nilgiri district. In present study Fluoride contents were found
permissible limit in all sampling sites. Phosphate was found objectable limit in GW 4
(1.4mg/L) and Tannery effluent (1.4mg/L).The fluoride values for all the groundwater
samples arewell exceeding the permissible limit. High concentration offluoride in
groundwater may be due to breakdown of rocks andsoils or infiltration of chemical fertilizers
from agriculturalland. The high concentration of fluoride in the study areaposes a sign of
water quality problem. Skeletal fluorosis is animportant disease due to presence of high
fluoride content ingroundwater.
The sulphate values for the groundwatersamples are exhibited between 20 and 38 mg/l. The
maximumvalue (38 mg/l) is noted at station GW3 and minimum valuesulphate (20mg/l) is
noted at GW4. The sulphate values for allthe groundwater samples are well within the
permissible limit(200 mg/l) of WHO. High concentration of sulphate may causegastro –
intestinal irritation particularly when magnesium andsodium ions are also present in drinking
water resources (Fig.4).
The value of phosphate in the groundwater samples lie between 0.2 to 1.0mg/l. Highest value
(1.0 mg/l) is recorded at station GW4 and minimum value (0.2 mg/l) is recorded at station
GW2 and Gw3. In this present study, the phosphatevalues are found within the permissible
limit (0.1 mg/l) ofWHO. Normally groundwater contains only a minimumphosphorus level
because of the low solubility of nativephosphate minerals and the ability of soils to
retainphosphate (Yadav, 2012). The phosphate values of all the groundwatersamples do not
pose any water quality problem (Fig.4).
In the present study water is very hard and crossed the permissible limits. It is well known
that hardness is not caused by a single substance but by a variety of dissolved polyvalent
metallic ions, predominantly calcium and magnesium cation, although other cation likes
barium, iron, manganese, strontium and zinc also contribute. The high concentration of total
hardness in water samples may be due to dissolution of polyvalent metallic ions from
sedimentary rocks, seepage and run off from soil. As we know calcium and magnesium, are
the two principal ions. The concentration of total hardness in drinking water sources ranged
between 75 and 1110 mg/l (Gopala Krishna, 2011), the obtained value of many of the
(2011) standards. In the present study it is observed that several parameters were notwithin
the permissible limit of the International Standards.Water quality standards vary significantly
due to different parameters like environmental conditions and ecosystem. The variation
observed is probably due to various factors such as trace metal contents, environmental
pollutions due to organic pollutant, domestic usage etc.,
Table 1: Showing results of physico-chemical parameters in Ground water of tannery
effluent water nearby surroundings of Dindigul city.
Parameters Acceptable limit Permissible limit Tannery effluent GW1 GW2 GW3 GW4
TDS 500 2000 16800 1358 1313 1260 1960
EC - - 24000 1940 1875 1800 2800
pH 6.5-8.5 6.5-8.5 5.20 6.85 7.30 7.35 6.93
T.A 200 600 460 420 410 100 460
T.H 200 600 4480 1280 1470 1460 1700
Ca 75 200 1120 220 320 280 275
Mg 30 100 448 120 135 118 125
Fe 0.1 0.3 0.1 0.1 0.1 0.1 0.1
Mn 0.1 0.3 0 0.1 0 0.1 0.1
Free NH3 0.5 0.5 3.4 0.4 0.2 0.2 0.6
NO2 0.5 0.5 1.0 0 0 0 0
F 1.0 1.5 1.4 0.8 1.2 1.2 1.4
Cl 250 1000 6580 120 100 340 260
SO4 200 400 110 26 31 38 20
[image:7.595.22.570.224.684.2]PO4 0.5 0.5 3.6 0.4 0.2 0.2 1.0
[image:7.595.26.567.226.673.2]Fig.2: pH.
Fig.3: Total alkalinity, Calcium and Magnesium.
Fig. 5: Chloride and Sulphate.
CONCLUSION
We conclude that all the water samples GW1 to GW4 have common chemical parameters
such as hardness, total dissolved solids, and electrical conductivity, calcium, sulphate, and
chloride alarmingly above the prescribed limit. The parameterslike copper and fluoride are in
the acceptable limit, if changes occurs it will cause some harmful effect. Almost in other
station water samples are influenced in the large amount due to the improper management of
waste water, over exploitation of water sources and rapid growth of industrialization in these
areas. An attempt has been made to study about the impact of tannery effluent containing the
inorganic, heavy metals and organic pollutants in Dindigul district. The effluents includes
suspended solids, phenols, toxins, acids, salts and dyes.The sustainability of groundwater for
drinking purpose in Dindigul block is assessed by its physiochemical constituents present in
the groundwater samples. Finally, the result was concluded that the Tannery effluent water
discharges impact on the ground water quality and makes contaminated at few sampling sites
namely GW4 (Palani Road) > GW3 (Begampur) > GW1(Nagal Nagar) > GW2 (Angu
Nagar). These ground water samples are not advisable to take as potable water.
REFERENCE
1. APHA, APHA, American Public Health Association, Standard Methods for stimation of
water and Wastewater, AWWA, Water Pollution Control Federation, New York, 1998;
19.
2. BIS, and Bureau of Indian Standards (BIS): Indian Standard Drinking Water
3. Gopalkrishna, H.M. Assessment of physico-chemical status of ground water samples in
Akot city, Res. J. Chem. Sci., 2011; 1(4): 117-124.
4. Jain C.K. A hydro-chemical study of a mountainous watershed: the Ganga, India. Water
Res., 2002;3: 1262-1274.
5. Manivaskam N. Physico-chemical examination of water sewage and industrial effluent.
PragatiPrakashan, Meerut, 2008; 34–57.
6. Mohamed Hanipha M. and Zahir Hussain A. Study of Groundwater Quality arDindigul
Town, Tamil Nadu, India., International Research Journal of Environmental Sciences,
2013; 2(1): 68–73.
7. Patil P.N. Sawant D.V. and R.N. Deshmukh. Physico-chemical parameters for testing of
water: A review, Int. J. Env. Sci., 2012; 3: 1194-1207.
8. Patil V.T. and R.R. Patil. Physicochemical analysis of selected groundwater samples of
Amalner Town in Jalgaon District, Maharashtra, India. E J. Chem., 2010; 7: 111-116.
9. Rao , A.B., Gopal, V., Karthikeyan, V., Pius, G.A. and Meenakshi, S. Ground water
pollution due to tannery effluent in certain areas of Dindigul town of TamilNadu. India.,
Ind. J.Environ. Prot., 1995; 11: 568-571.
10.Sankar K., Aravindan S and Rajendran S. Assessment of Groundwater Quality in
Paravanar River Sub-basin, Cuddalore District, Tamil Nadu, India, Pelagia Research
Library, 2011; 2(5): 92-103.
11.Sathish Kumar S. and Ravichandran S. Groundwater Quality Assessment in Cheyyar
Region, International Journal of ChemTech Research, 2011; 3(3): 1060-1062.
12.Shrinivasa Rao B and P. Venkateswaralu. Physicochemical analysis of selected
groundwater samples, Indian J. Environ. Prot., 2000; 20: 161-164.
13.Shyamala R., M. Shanthi, P. Lalitha. Physicochemical analysis of borewell water samples
of Telungupalayam area in Coimbatore District, Tamilnadu, India, E-J. Chem., 2008; 5:
924-929.
14.Subramani T., Krishna S and Kumaresan P.K. Study of Groundwater Quality with GIS
applications for Coonoor Taluk in Nilgiri District, International Journal of Modern
Engineering, 2012; 2(3): 586–592.
15.WHO. Guidelines for Drinking-Water Quality, World Health Organization, Geneva,
Switzerland, 4th edition, 2011; 224-334.
16.Yadav K.K. Physicochemical analysis of selected ground water samples of Agra city,