Orientational and phase-coexistence behaviour of hard
rod-sphere mixtures
ANTYPOV, D. and CLEAVER, D. J. <http://orcid.org/0000-0002-4278-0098>
Available from Sheffield Hallam University Research Archive (SHURA) at:
http://shura.shu.ac.uk/894/
This document is the author deposited version. You are advised to consult the publisher's version if you wish to cite from it.
Published version
ANTYPOV, D. and CLEAVER, D. J. (2003). Orientational and phase-coexistence behaviour of hard rod-sphere mixtures. Chemical physics letters, 377 (3-4), 311-316.
Copyright and re-use policy
Orientational and phase-coexistence behaviour
of hard rod-sphere mixtures
Dmytro Antypov
1, Douglas J. Cleaver
∗
Materials Research Institute, Sheffield Hallam University, Pond Street, Sheffield S1 1WB, UK
Abstract
Results are presented from Monte Carlo simulations of bulk mixtures of Hard Gaus-sian Overlap particles with an aspect ratio of 3:1 and hard spheres with diameters equal to the breadths of the rods. For sphere number-concentrations of 50% and lower, compression of the isotropic fluid results in formation of a homogeneous (i.e. compositionally mixed) nematic phase. The volume fraction of this isotropic-nematic transition is found to increase approximately linearly with sphere concen-tration. On compression to higher volume fractions, however, this homogeneous nematic phase separates out into coexisting nematic and isotropic phases.
1 Introduction
When simulating or performing a theoretical study on a particular system, it is often informative initially to consider its behaviour in the hard-particle ap-proximation. In this limit, in the canonical ensemble at least, the equilibrium state is determined by the entropy alone [1]. A particular issue that arises when treating mixtures of hard particles is that it is not always straightfor-ward to determine (by theory) or establish (by simulation) whether a given mixture undergoes phase separation. The possibility of fluid-fluid coexistence in binary mixtures of hard spheres with different diameters, for example, has been the focus of several recent studies (see ref. [2] for the current picture). In addition to this system, the competing demixing and ordering behaviours of numerous other binary hard particle mixtures have been studied using both
∗ Corresponding author. Fax: +44-114-225-3501
Email address: [email protected] (Douglas J. Cleaver).
1 Present address: Max-Planck-Institut f¨ur Polymerforschung, Ackermannweg 10,
theory and computer simulation [3–12]. Mixtures of different types of rods [3– 5], rods and disks [6,7], and rods and spheres [8–12] have all been investigated. These studies show that, even in the hard-core approximation, binary mixtures can exhibit macroscopic and microscopic demixing as well as orientationally ordered phases.
To date, most theoretical studies of hard rod-sphere mixtures have been re-stricted to one of two approximations: the rods have been taken either to be thin and noninteracting or to be parallel (i.e.perfectly aligned). Experimental studies of the former situation [8] reveal that small thin rods are very efficient depletion agents and readily induce an effective sphere-sphere attraction. A density functional treatment (DFT) of such systems [9], which was restricted to state points where orientational transitions of the rods were not relevant, found only mixed and demixed regions. Another DFT of hard spheres and hard ellipsoids of arbitrary sizes has predicted the coexistence of nematic rod-rich and isotropic sphere-rod-rich phases at high packing fractions [10]. However, the approach adopted in ref.[10] utilised a number of approximations to the rod direct correlation function, which lead to an inadequate description for the behaviour of the nematic order parameter. More recently, the geometrical approximation approach has been used to study entropy driven demixing for the general case of isotropic binary mixtures of convex bodies [5]. Whilst here it was shown that, in general, prolate and oblate particles demix more eas-ily than spherical ones, fluid-fluid demixing of rod-sphere mixtures was found to be explicitly forbidden when the breadths of the rods were made equal to the diameters of the spheres. Like its predecessors, however, this theory did not consider the way in which demixing might be affected by being either pre-empted or accompanied by an orientational transition of the rods. In contrast, if the rods are kept parallel [11,12], only perfectly ordered liquid crystalline behaviour can be studied. In this limit, mixtures of hard spheres and parallel spherocylinders have been shown to form a lamellar phase in which there is microphase separation of the two components. This type of lamellar phase has also been observed for some experimental rod-sphere systems based on suspensions of rod-like viruses and polystyrene spheres [13,14].
2 Simulation model and results
In this Letter, we present results from MC simulations of mixtures of Hard Gaussian Overlap (HGO) particles with an aspect ratio of 3:1 and hard spheres (HS) with diameters equal to the breadths of the rods. For aspect ratios of 3 and higher, the undiluted HGO model is known to exhibit a density-driven N-I transition; a phase diagram has recently been calculated [15]. In our mixed systems, the interaction between two particlesiandj, separated by a distance
rij, is given by
Uij =
0 (rij > σij),
∞ (rij ≤σij),
(1)
where σij is the appropriate range parameter function for the particle-type
combination, ij. For two hard spheres, σij is simply the sphere diameter σ0. The range parameter function for two HGO particles depends on their orien-tations, denoted by the unit vectors uˆi and uˆj, and is given by [16]
σ(ˆrij,ˆui,ˆuj) = σ0
"
1− χ
2
(
(ˆrij·ˆui+ˆrij·uˆj)2 1 +χ(uˆi·uˆj)
+ (ˆrij·ˆui−ˆrij·uˆj) 2
1−χ(ˆui·ˆuj)
)#−1/2
,(2)
where ˆrij = rij/rij is the unit vector along the intermolecular vector rij and
χ= (k2−1)/(k2+ 1), k being the particle aspect ratio. For un-like particles, for example, if particleiis a sphere and particlej is a rod,σij is given by [16]
σ(ˆrij,ˆuj) =σ0
h
1−χ(ˆrij·ˆuj)2
i
.−1/2 (3)
All simulations were performed in the constant N V T ensemble using a stan-dard MC algorithm. For each trial move, a particle was selected at random and subjected to a random trial displacement within a cube centred on the parti-cle’s original position. Where the selected particle was a rod, this displacement was combined with a random rotation implemented using the Barker-Watts method [17]. N such random MC moves made up one MC cycle, so that, on average, each particle experienced one trial move per cycle.
calculated as the ensemble average of the largest eigenvalue of theQ tensor:
Qαβ =
1 Nrod Nrod X i=1 1
2(3uiαuiβ −δαβ), (4)
where Nrod is the number of rods in the system, uiα is the α component
(α=x, y, z) of the vectoruˆi, andδαβ is the Kronecker delta. The mean square
particle displacement was also monitored routinely to ensure that, within each run, the particles travelled distances comparable with the simulation box side; had the runs been significantly shorter than this, it would have been impossible to assess any possible demixing occurring in the system. This requirement lead to run-lengths of between 6×10⁵ and 1.5×10⁷ MC cycles, depending on the
system density.
Fig. 1 shows the nematic order parameter as a function of occupied volume fraction at various sphere concentrations. Here, we follow theoretical treat-ments of HGO systems [18,19] in equating the volume of an HGO particle with that of an ellipsoid of the same elongation. The occupied volume fraction can then be expressed in terms of the total number density ρ = NV and the sphere number-concentration ratio 0≤csph ≤1 using
f = Voccupied
V ≈
Vsph(Nsph+ 3Nrod)
V =ρVsph(3−2csph), (5)
whereNsph is the number of spheres in the system, andVsph and 3Vsph are the sphere and rod volumes, respectively. The data shown in Fig. 1 indicate that an N-I transition occurred during each compression sequence. The data also show a clear tendency for the volume fraction at the transition,fN−I, to increase with increasing sphere concentration. At the highest sphere concentration studied, 50%, the volume fraction at which the N-I transition occurred was so great that the mobility of the particles was very low: 1.5× 10⁷ MC cycles were required to equilibrate the last configuration in this compression sequence. Sphere concentrations above 50% were not studied because of this dramatic increase in the required computational time.
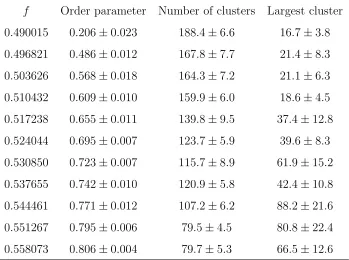
For the 50% system, it is not clear whether a brief window of homogeneous nematic stability preceded this phase-separation; the latter appears to have taken place at a slightly higher volume fraction than the rise seen in the nematic order parameter, but the volume-fraction difference is similar to the density increments used. In order to assess this more fully, the 20% mixture was compressed to similarly high volume fractions to investigate its phase-separation behaviour. The resulting gss(r) curves, shown in Fig. 4, indicate a weak but growing tendency for the spheres to cluster with increase in system density, but approach unity at larger for all volume fractions considered. This suggests a random distribution of small clusters of spheres. A number and size distribution analysis of clusters of spheres separated by distances greater than 1.5σ0 was performed at each density and averaged over at least 105 MC cycles. The resulting data, which are shown in Tab. I, indicate that macroscopic phase separation was not seen: about a hundred clusters of spheres (half of which were just single spheres) were found even at the highest density. That said, the largest cluster contained about 20% of the total number of spheres at high densities.
Since the runs performed here were sufficiently long to give an average net sphere displacement greater than the simulation box side, these systems were certainly not glassy. Also, the clusters of spheres were found to change dy-namically during the runs. When compared with the results from the 50:50 system simulations, phase separation would have been expected at about the same volume fraction, i.e.f = 0.53. This is consistent with the point at which the size of the largest cluster started to increase significantly (Tab. I). We also note a possible anomaly in the gradient of the order parameter curve of the 20% mixture at this volume fraction. These observations both suggest that the 20% mixture may have a weak tendency to phase separate. Our inabil-ity directly to observe macroscopic phase coexistence here is not surprising, however; finite size effects, particularly the relatively high surface to volume ratio of a sphere-rich droplet at low overall sphere concentrations, would be expected to inhibit such an observation in a constant N V T simulation. Fi-nally, we note that the order parameter values shown in Tab. I increase at a volume fraction of about 0.50, indicating that a compositionally homogeneous nematic phase was present in the range 0.50 < f < 0.53. This supports the possibility of there being a similar but much narrower window of homogeneous nematic stability in the 50% mixture.
3 Discussion and Conclusion
A partial phase diagram for the system is shown in Fig. 5, diamonds repre-senting the simulation points. Here, the dashed line connects points at which the increase of the nematic order parameter indicates a N-I phase transition. It was not possible to resolve the individual isotropic and nematic coexis-tence densities from our exploratory N V T simulations. However, the weakly first-order nature of the N-I transition dictates that the dashed line in Fig. 5 actually represents a narrow region of N+I coexistence. We also indicate, with a solid line, the approximate location of the much wider, re-entrant N+I co-existence region identified from our simulations at high volume fractions. We note that an equivalent wide N+I coexistence region has been seen at low T
in the temperature-concentration phase diagram of a liquid crystal-silicone oil mixture [20]. It has also been seen in lattice model simulations of thermotropic liquid crystal-isotropic fluid mixtures [21,22].
In discussing these results further, there are two useful reference points to consider: the random close packing volume fraction fHSF ≃ 0.64 (the short dashed line in Fig. 5) and the freezing point of a monodisperse hard sphere system [23], fHSF ≃0.494 (the dot-dashed line). In rod-sphere mixtures with low sphere concentrations, an N-I transition occurs at volume fractions below
fHSF. At these sphere concentrations, the ordered phase is simply a nematic containing randomly dispersed spheres,i.e.the mixing entropy is high. As the concentration of spheres is increased, the N-I transition shifts towards pro-gressively higher volume fractions before, at a sphere concentration slightly over 50%, the narrow coexistence region associated with the homogeneous N-I transition opens up into a very broad N+I coexistence envelope which dom-inates for volume fractions above f ≈ 0.53. The simulation method we have used is not able either to access the (presumably glassy and crystalline) struc-tures pertaining at very high volume fractions or determine the boundaries of the N+I coexistence envelope at low and high sphere concentrations. We do not, therefore, speculate on these areas of the phase diagram.
entropy in order to reduce the weight given to the rod-sphere excluded volume term and increase those given to the more efficient rod-rod and sphere-sphere contributions.
In conclusion, our simulation results have shown that this simple hard-particle mixture exhibits both an orientational ordering transition and a re-entrant N+I phase-coexistence region which occupies a significant concentration range at high volume fractions. Having established the generic behaviour of rod-sphere mixtures in the hard particle approximation, our future work will ex-plore the changes brought to this base phase diagram by the introduction of attractive interactions with various symmetries.
Acknowledgements
This work has benefitted greatly from numerous discussions with Chris Care. We also gratefully acknowledge the financial support of the MRI in providing a studentship for D.A., and EPSRC for providing computational hardware under grant GR/L86135.
References
[1] D. Frenkel, Physica A 263 (1999) 26
[2] M. Dijkstra, R. van Roij, R. Evans, Phys. Rev. E, 59 (1999) 5744
[3] A. Stroobants, Phys. Rev. Letts. 69 (1992) 2388
[4] R. van Roij, B. Mulder, Phys. Rev. E 54 (1996) 6430
[5] H. Bosetti and A. Perera, Phys. Rev. E 63 (2001) 021206
[6] A. Galindo, G. Jackson, and D.J. Photinos, Chem. Phys. Letts. 325 (2000) 631
[7] P.J. Camp, M.P. Allen, Physica A 229 (1996) 410
[8] K. Lin, J.C. Crocker, A.C. Zeri, A.G.Yodh, Phys. Rev. Letts. 87 (2001) 088301
[9] M. Schmidt, Phys. Rev. E 63 (2001) 050201
[10] A. Samborski and G. T. Evans, J. Chem. Phys. 107 (1994) 6005
[11] T. Koda, M. Numajiri, and S. Ikeda, J. Phys. Soc. Jpn. 65 (1996) 3551
[12] Z. Dogic, D. Frenkel and S. Fraden, Phys. Rev. E 62 (2000) 3925
[14] M. Adams, Z. Dogic, S.L. Keller, and S. Fraden, Nature 393 (1998) 349 [15] E. de Miguel and E. Mart´ın del R´ıo, J. Chem. Phys. 115 (2001) 9072
[16] B.J. Berne and P. Pechukas, J. Chem. Phys. 64 (1972) 4213
[17] J.A. Barker and R.O. Watts, Chem. Phys. Letts. 3 (1969) 144 [18] M. Rigby, Mol. Phys. 68 (1989) 687
[19] P. Padilla and E. Velasco, J. Chem. Phys. 106 (1997) 10299 [20] J.C. Loudet, P. Barois and P. Poulin, Nature 407 (2000) 611
[21] R. Hashim, G.R. Luckhurst and S. Romano, Proc. Roy. Soc Lond A 429 (1990) 323
[22] M.A. Bates, Phys. Rev. E 64 (2001) 051702
Table I. Order parameter and cluster distribution measured for the 80/20 mixture at different volume fractions f.
f Order parameter Number of clusters Largest cluster
0.490015 0.206±0.023 188.4±6.6 16.7±3.8
0.496821 0.486±0.012 167.8±7.7 21.4±8.3
0.503626 0.568±0.018 164.3±7.2 21.1±6.3
0.510432 0.609±0.010 159.9±6.0 18.6±4.5
0.517238 0.655±0.011 139.8±9.5 37.4±12.8
0.524044 0.695±0.007 123.7±5.9 39.6±8.3
0.530850 0.723±0.007 115.7±8.9 61.9±15.2
0.537655 0.742±0.010 120.9±5.8 42.4±10.8
0.544461 0.771±0.012 107.2±6.2 88.2±21.6
0.551267 0.795±0.006 79.5±4.5 80.8±22.4
Figure 1. Order parameter dependence on volume fraction for various mixtures. Figure 2. Sphere-sphere radial distribution functions measured in 50% mixture at
different volume fractions.
Figure 3. Configuration snapshot of 50/50 mixture taken at volume fraction f = 0.534071.
Figure 4. Sphere-sphere radial distribution functions measured in 20% mixture at different volume fractions.
Figure. 1
0 0.1 0.2 0.3 0.4 0.5 0.6 0.7 0.8 0.9
0.42 0.44 0.46 0.48 0.50 0.52 0.54 0.56
Order Parameter
Volume Fraction
Figure. 2
0.6 0.8 1.0 1.2 1.4 1.6 1.8
0 1 2 3 4 5 6 7 8
g (r)ss
r / σ0
Figure. 4
0.8 1.0 1.2 1.4 1.6 1.8
0 1 2 3 4 5 6 7 8 9
g (r)ss
r / σ0
Figure. 5
0.40 0.45 0.50 0.55 0.60 0.65
0 20 40 60 80 100
Volume Fraction
Sphere Concentration