Automatically generating computer simulation models
from business process models.
BRADSHAW, Mark.
Available from Sheffield Hallam University Research Archive (SHURA) at:
http://shura.shu.ac.uk/19389/
This document is the author deposited version. You are advised to consult the publisher's version if you wish to cite from it.
Published version
BRADSHAW, Mark. (2003). Automatically generating computer simulation models from business process models. Masters, Sheffield Hallam University (United Kingdom)..
Copyright and re-use policy
See http://shura.shu.ac.uk/information.html
CITY CAft
SB E f
» U $ , HOWARD STREET I
>HcH*iELDS; W li1 0 1 7 5 5 6 0 9 1
Fines are charged at 50p per hour
_ i» OCT 2007
.4 - 3 0 fW I
ProQuest Number: 10694270
All rights reserved INFORMATION TO ALL USERS
The quality of this reproduction is dependent upon the quality of the copy submitted. In the unlikely event that the author did not send a com plete manuscript and there are missing pages, these will be noted. Also, if material had to be removed,
a note will indicate the deletion.
uest
ProQuest 10694270
Published by ProQuest LLC(2017). Copyright of the Dissertation is held by the Author.
All rights reserved.
This work is protected against unauthorized copying under Title 17, United States C ode Microform Edition © ProQuest LLC.
ProQuest LLC.
789 East Eisenhower Parkway P.O. Box 1346
Automatically Generating Computer
Simulation models from Business Process
models
.
By
Mark Bradshaw
A thesis submitted in fulfilment of the requirements of
Sheffield Hallam University for the degree of Master of
Abstract
Automatically Generating Computer Simulation Models from Business Process Models
In a modern business environment it is common place for organisations to use both Business Process Modelling and Simulation tools for a variety of business operations. Although these tools are used for different purposes, they are often used on the same projects, but at a different point in its lifecycle.
Business Process Modelling is a static modelling tool, which is process
orientated and models current business processes. Whilst Simulation is a
dynamic modelling tool, which is system orientated, testing current and future
operations. Although the modelling tools are different the process definition within both methods contain the same data. Currently that data is not reused and simulation modellers will often reproduce that information from scratch. Therefore a successful integration of the modelling methods would extend the capacity of Business Process Modelling tools and make Simulation more acceptable among reengineering practitioners.
A literature review was carried out to identify the capacity of different modelling methodologies, identifying the variances between the modelling procedures and substantiate the need for an integrated solution. Based on the structured research programme, experimentation was undertaken evaluating the proposed method of integration. The results of the research were then documented, evaluating its advantages, disadvantages, limitations and the requirements for any future research.
Acknowledgements
The author would like to take the opportunity to express his gratitude to all parties that have donated their time and support during the many hours of
research for the completion of this thesis. In particular his Fam ily, Professor
Terrence Perera and David Clegg for their time, interest and guidance
throughout the development of the research project.
Finally the author would like to thank the companies and software vendors that have provided valuable resources and opinion for the completion of the investigation.
List of
Contents
Page No Abstract
List of Contents
List of Tables & Figures List of Appendices
Introduction 1
1.1 introduction 1
1.2 Project Objectives 2
1.3 Evaluate the dynamic features of BMP business environment 3
1.4 Benchmark the built in simulation capability of BMP tools 3
1.5 Develop a Methodology for Integration 3
1.6 Construct a prototype for integration, validating and refining tool 4
1.7 Chapter Review 4
1.7.1 Literature Review 4
1.7.2 Benchmarking 5
1.7.3 Methodology 5
1.7.4 Practical Experiment 5
1.7.5 Validation and Verification 5
1.7.6 Conclusion 5
Literature Survey 7
2.1 Business Process Modelling 7
2.2 Tools for Process Modelling 10
2.3 Approach to Modelling 12
2.31 Identify 13
2.32 Document and Understand 13
2.33 Analyse 14
2.34 Re-Design 14
2.35 Implement 15
2.36 Manage 15
2.37 Communicate 15
2.42 Disadvantages of Simulation 18
2.5 Types of Simulations 19
2.6 Research into the integration of Process Mapping 21
and Simulation tools
2.61 Case Study: Integration of Design/IDEF and 24
ProModel Simulation
2.62 Integrated ABC Flowchart and ProModel 24
2.7 Summary 25
Benchmarking 27
3.1 Benchmarking 27
3.2 Software review 31
3.2.1 Integration Capabilities 33
3.2.2 Simulation 35
3.3. Comparison of BMP Simulation Capabilities 41
3.3.1 Package Type & Simulation Type 42
3.3.2 Method 42
3.3.3 Analysis & Reporting 42
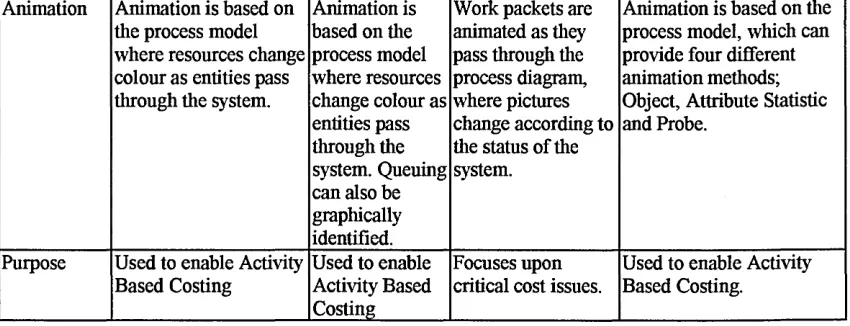
3.3.4 Animation 43
3.3.5 Purpose 43
3.4 Organisational Use 46
3.5 Benchmarking 47
Identification of Integration Methods 49
4.1 Modelling Methodologies 49
4.1.1 ARIS Methodology 49
4.1.2 ARENA Methodology 52
4.2 ARENA and ARIS Simulation Comparison 54
4.2.1 ATM Machine 54
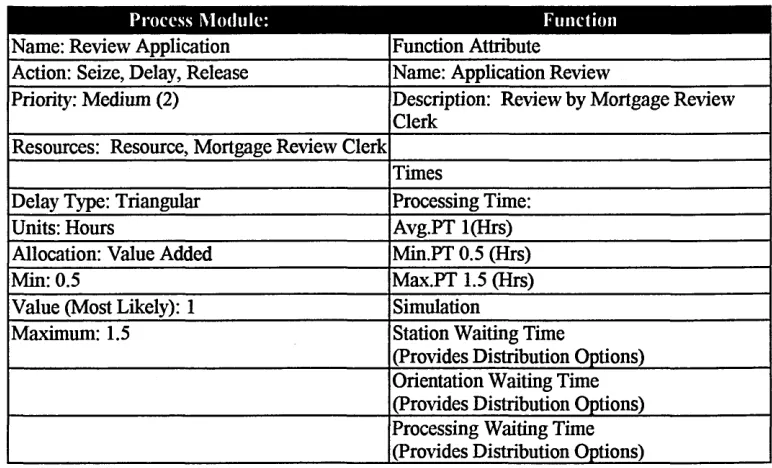
4.2.2 Mortgage Application Example 56
4.3 Available Data Transfer Methods 59
4.3.1 Interfacing through ARIS Simulation 59
4.3.2 Interfacing through ARENA Simulation 61
4.4 Transfer Method 63
Practical Experimentation 65
5.1 Creating an ARIS Export File 66
5. 2 Produce Data Transfer from Excel 68
5.2.1 Identifying the ARIS Data 68
5.2.2 Matching XML values with the ARENA import method 68
5.2.3 Open the Notepad file and identify the Data within the XML 69
Structure
5.2.4 Write Data to the Excel Worksheet 70
5.3 Input the ARIS data into the ARENA import file 71
5.3.1 ARENA Import File: 71
5.3.2 Code to Transfer the Modelling Data 73
5.4 The Method to Match Building Blocks 73
5.4.1 The Code used for Matching and Selecting Modules 74
5.5 Results of the Practical Experimentation 74
Validation and Verification 78
6.1 Exporting ARIS data in the XML/AML format 78
6.2 Opening the XML Output file to be read from Excel 79
6.3 ARENA import file 80
6.4 Summary 82
Conclusion 83
7.1 Literature Survey 83
7.2 Benchmarking 84
7.3 Methodology 86
7.4 Practical Experimentation, Validation and Verification 87
7.5 Research Value 88
List of
Tables and Figures
Tables
Table 1: Modelling Tools 11
Table 2: BMP Market Trends 28
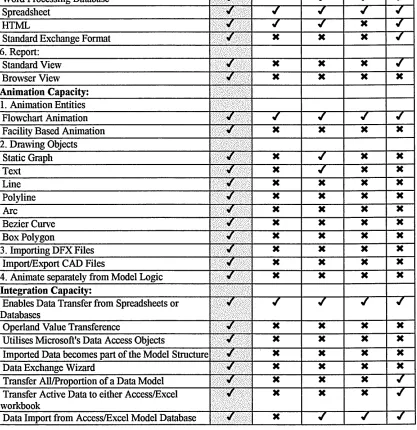
Table 3: Proform’s Integration Capacity 33
Table 4: Simulation Breakdown 42
Table 5: Simulation Benchmark 44
Table 6: Benchmarking Results 47
Table 7: Corresponding Input Data for Initiating a Mortgage 57
Application
Table 8: Corresponding Input Data fot the Application Review 58
Table 9: Corresponding building blocks for completing the review 58
Table 10: Corresponding building blocks for ending Application 59
Table 11: Mortgage Application Export table 62
Table 12: ARIS Export File Sections 67
Table 13: Location of the required ARIS data 70
Table 14: Example of the exported XML Data 70
Table 15: ARENA Import file section 71
Table 16: Module Table defining the ARENA PANELS 72
Table 17: ARENA Import file section 72
Table 18: Basic Process Create Module 73
Table 19: Company Ranking 86
Figures
Fig 1: Process Modelling Tools 10
Fig 2: BMP Project Lifestyle 12
Fig 3: IDEF Methodology 23
Fig 4: Leading BPM Software Providers 27
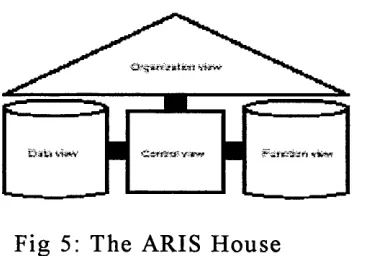
Fig 5: The ARIS House 32
Fig 6: Proforms' Simulation Process 36
Fig 7: Input Data Windows 36
Fig 8: Cast Grid & Resource Utilisation Chart 37
Fig 9: Popkins Simulation Process 38
Fig 10: Casewise Simulation Process 39
Fig 11: ARIS Animation 40
Fig 12: ARIS House and Integrated Method 50
Fig 13: ARIS Object Attribute Display 52
Fig 14: ARENA Template Structure 53
Fig 15: ARIS/ARENA ATM Machine diagrams 55
Fig 16: Customer Arrival at ATM Machine 55
Fig 17: Production of Transactions 56
Fig 18: ARIS/ARENA Mortgage Application 56
Fig 19: Project Transfer method 63
Fig 20: Operational Model Transfer 65
Fig 21: Example of the simple ARIS Process 66
Fig 22: ARIS Export Process 66
Fig 23: Connection Definition, defining Connections 67
Fig 24: Mapping Process 74
Fig 25: Integrated Project 75
Fig 26: ARIS/ARENA ATM Machine Comparison 76
Fig 27: ARIS/ARENA Mortgage Applications 77
Fig 28:: ARIS Simulation Attributes 79
Fig 29: Complex ARIS eEPC model and its connection details. 79
Fig 30: X & Y Co-ordinates of ARENA Simulation 80
Chapter 1: Introduction
1.1 Introduction
In many organisations Business Process Modelling (BPM) and Simulation tools provide valuable process analysis capabilities. Organisations use BPM techniques to gain knowledge of their business operations, using that knowledge within business process re-engineering projects to optimise their operations. The techniques also provide a valuable tool for manages, enabling understanding and interoperability of their processes, which often support decision-making activities (Dennis et al. 2000). Simulation techniques are used to plan operational resource requirements, improve performance of processes and test new ideas. As a consequence simulation is often used to evaluate improvement plans and match resources to workloads
Currently both modelling techniques are often used within the same project, but at different points of its lifecycle. BPM tools are used to document current business processes, analysing structures and relationships from a static perspective. Simulation is system orientated, modelling processes in a dynamic environment that enables complex analysis, testing processes under operational environment.
Although both methods are often used on the same projects, process-mapping information is created separately and project data is rarely shared. Among many managers and engineers Simulation is regarded as complex and sophisticated modelling tool. As a result its use is often limited to specialists and outside consultants. Whilst BPM has become popular within many organisations as a consequence of its comprehensibility and ease of use. Due to its popularity BPM vendors have significantly enhanced their products, creating industry specific solutions and features that extend its main objectives to increase its popularity.
Therefore integration of the modelling methods could greatly reduce man-hours, resources and the budget required to complete a project. The successful integration of the modelling methods may increase the popularity of Simulation among a variety of industries, extending the capacity of BPM software and increase the effectiveness of reengineering projects.
1.2 Project Objectives
The aim of the dissertation was to examine the feasibility of Automatically Generating Computer Simulation models from Business Process Models. To achieve the ultimate goal of producing a simulation model directly from a business process model, the project follows a structured approach that extensively researches the components involved, their potential suitability and options available for integration. The structure of the project is based on the following objectives:
1. Evaluate the dynamic features o f Business Process Modelling (BPM) within the business environment.
2. Benchmark the built-in Simulation capability o f BPM tools. 3. Develop a methodology fo r integration.
4. Construct a prototype fo r integration, validating and refining the tool.
It has become apparent through various discussions with industrial representatives and software vendors that the integration of Business Process Modelling and Simulation packages is an issue of great interest. Potentially expanding their use, providing consistency within an organisation’s operations. Currently organisations are producing models within each format, reproducing the same information within each model, presumably creating inconsistency between the different formats. Therefore integration will provide the capability for information sharing, reducing the information reproduction and potential errors.
1.3 Evaluate the Dynamic Features of BPM within the Business Environment
In order to understand the issue’s involved in the integration of business process modelling and simulation tools, a literature survey will be conducted, investigating the current tools available within each discipline, any previous developments and possible issues which will require consideration within the research. The investigation will include company and vendor visit’s which will be used to extensively evaluate varying perspectives. Through investigation it is apparent that there are many circumstances that could effect integration. (E.g. the structure of the package would determine the approach for the problem.). There are currently structured and unstructured BPM packages available on today’s market, which provide different issues. Therefore the selected packages would require extensive analysis to identify key issues, which may influence the specific approach taken. From initial discussions with industrial representatives it is apparent that there has been preliminary investigations concerning the integration of the products and they have indicated that they would be very interested in future research on the topic.
1.4 Benchmark the Built-in Simulation capability of BPM tools
To develop an effective integrated solution it is essential that the products available within each discipline are evaluated to assess their current capabilities and specific issues that could effect integration. Therefore it is essential that an extensive benchmarking study is undertaken, investigating the capacity of current BPM packages and their present/future simulation capabilities. Identifying parameters for benchmarking, to construct an effective study. This study will focus the project's attention on quality and planning improvement activities, clarifying the perimeters for further research activity.
1.5 Develop a Methodology for Integration
At this stage the tools that will be integrated will have been selected based on their suitability for the problem, and the most appropriate method of integration will have been identified. The project will aim to develop a methodology for integration identifying the method for the transfer of data/logic, which will allow models built within each medium to be transferred from one package to another. Enabling data to be shared within differing organisational requirements, potentially increasing consistency of the information produced for process and physical flows within the organisation.
1.6 Construct a prototype for Integration, Validating and Refining the tool
The final object of the research is to develop an integrated prototype from the defined methodology, using VBA/XML to achieve physical connection between the different packages. Once solutions have been developed it is then essential that the solutions are validated and refined to ensure the transference of data is accurately implemented for the intended purpose. After evaluation the next step would be to assess future possibilities, identifying possible improvements to the solutions developed, or changes that could be made for varying circumstances.
1.7 Chapter Review
Objectives of the research will be achieved through a series of Chapters, which will be constructed in a methodological manner that will ultimately answer the
question "is a fully automated integration process between a Computer
Simulation model and a Business Process Model possible?” The project will include the following Chapters:
• Literature Survey • Benchmarking • Methodology
• Practical Experimentation • Validation and Verification • Conclusion
1.7.1 Literature Survey
Research will also evaluate the opinions of industrial representatives, software vendors and academics to substantiate the investigation. Providing a valuable insight into understanding the preceding objectives and approaches to be taken.
1.7.2 Benchmarking
The Benchmarking study will evaluate five leading Business Process Modelling tools through common benchmarking practices, which will be used to define their true Simulation and Integration capabilities. Product assessment will identify the most suitable tool for the integration experimentation, through evaluation using predefined categories that will compare the tools via a detailed scoring system.
1.7.3 Methodology
The main objective of the methodology section of the research is to identify a suitable integration method, which will achieve successful integration. This Chapter will introduce the two modelling tools, their methods and available data transfer capabilities. Once the respective methodologies have been evaluated a mapping process will be undertaken to identify the correlating modules. Through the accumulation of methodological data the final stage will be the proposal of the integrated method, which will be used within the practical experimentation.
1.7.4 Practical Experimentation
Within the Practical Experimentation the proposed method will be tested, developing an automated integration process, evaluating its potential and developing the solution to increase the efficiency of the process.
1.7.5 Validation and Verification
The Validation and Verification Chapter will analyse the practical experimentation, evaluating its level of success, defining the advantages and limitations of the approach taken.
1.7.6 Conclusion
Chapter 2: Literature Survey
The Literature Survey will used to evaluate Business Process Modelling (BPM)
and Simulation methods to ultimately justify the research into the Automatic
Generation o f Computer Simulation models from Business Process models. Research for the literature survey was conducted through the investigation of academic publications, articles, and company visits. The chapter will be structured around the following areas:
• Business Process Modelling • Simulation
• Evidence to support the Research Project
The survey will evaluate modelling methodologies, their purpose and capacities. Substantiating the need for research by identifying there respective characteristics, defining compatibility from supporting evidence and preceding research.
2.1 Business Process Modelling:
Business Process modelling is defined in the following terms: ‘A Business Process is the definition of the tasks and sequences of those tasks necessary to deliver a business function. Process Modelling is the documentation, analysis and design of the structure of business processes, their relationships with the resources needed to implement them and the environment in which they will be used. Understanding the individual components of the Business Process and Process Modelling is not enough on their own. The user must understand the relationships and interactions between the components to achieve effective Business Modelling (Hammer. 2003).
Through the development of a business, processes develop in many different ways. Manufacturing organisations will operate with rigid processes that are dictated by their operational environment, which operates using high investment resources that often defines the development of processes. In such circumstances it is not a viable option to rearrange resources around the operating processes, such developments can only occur prior to the development of the manufacturing facility. Service providers develop their processes through an ad-hoc approach, which is not restricted by complex resource structures, enabling a flexible approach for their development. Production processes will have been deliberately designed and optimised, but many businesses will have become established through the tradition and practice of the business environment (macro/micro). As a result businesses may produce processes without realising. Companies like BT who are currently in the process of decentralising from a large nationalised company are currently using Business Processing modelling to accurately map their processes to enable the separate organisations to work individually and react quickly to their changing markets.
In an increasingly competitive market it is very important that businesses are able to react to their environment and the competition within that market place. In modern business it is no longer viable to let business processes grow and develop through tradition and practice. Legal requirements and regulation often overwhelm businesses large and small, whilst they also need to compete within their market sector (Davis. 2001). Therefore if businesses are to operate under this environment they must document their processes (Hammer. 2003), at the very least to comply with the legal requirements demanded of them (e.g. ISO 9000). After discussions with Local Government Employees it is apparent that they are legally bound to meet ISO 9000 standards by 2005 and as a result Business Process Modelling tools will be used to a greater extent within those organisation in the near future. Therefore it must be assumed that many other government and UK companies are also obliged by such regulations in the near future.
difficult to verify. Therefore this kind of model does not constitute a business model, which means that when business models are being planned the question is not should you model the business, but how and to what extent should it be modelled. Without knowing and understanding how a business works it is very difficult to automate a company and build complex business interfaces with other businesses or business units.
Rob Davis from British Telecom has said that every business should have some
sort of business model and should consider ‘serious business modelling’ if a business has one or more of the following uses (Davis. 2001):
• Large, multi-national or global. • Highly regulated.
• Have significant commercial or legal liabilities. • Wants to use a high degree of automation.
• Have complex interrelationships with other businesses. • Wants to deliver high-quality customer service.
• Wants to be an e-business.
Therefore from these guidelines it must be presumed that many companies could use BPM methods to support present and future business activities. Currently there are many organisations of different sizes, from varying global locations that are successfully using BPM techniques. Companies like IBM, American Express, General Motors, Swiss Telecom (etc) are using the techniques to undertake process analysis for daily actives and future projects.
Currently many organisations are using Business Process Modelling tools to support their Business Process Reengineering (BPR) projects. The tools were developed partly through the development of BPR concepts, which are used to capture, document and analyse the business process for reengineering purposes (Hulpic et al. 2001).
Through the introduction of BPR, some companies came through the changes with improved business processes, which made them competitive within their market sector. However many businesses went into BPR blindly, without any benefit focusing on a small number of goals, which often missed the true value
of the organisation (i.e. the intangible capital). Therefore today’s businesses have realised that the implementation of BPR projects requires a comprehensive review of the business, which has brought rise to the use of the Balanced Scorecard and the European Quality Award, enabling a realistic review of the overall business performance. As a result BPM tools are now incorporating such techniques to enhance the process analysis features. To successfully use BPM tools with BPR the process models must be linked to targets and objectives, with matrices gathering built into them.
2.2 Tools for Process Modelling:
As a result of the increasing importance of Business Process Modelling methods, modelling techniques are becoming widely developed by many software vendors. However organisations have different goals and those goals are met by a variety of software platforms, which cater for many different purposes, resulting in many modelling methods. Due to increasing competition in the current BPM sector it is predicted that the current number of vendors will reduce by a third in 2005 (www3.gartner.com) .
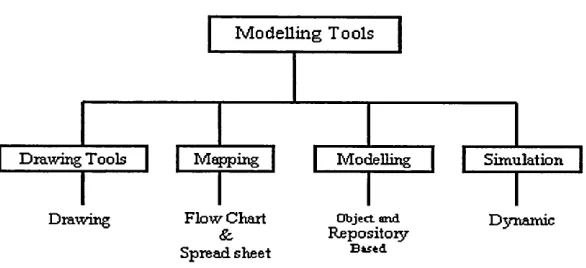
In the process modelling sector the methods extend from simple drawing
packages through to the most complex simulation models, which model
processes as a physical flow of entities in a dynamic representation. However there is a significant gap between the two methods, which is separated by
mapping and m odelling techniques. Drawing, mapping and m odelling techniques
are static models that are defined under the BPM method, used for the logical representation of processes.
[image:22.612.145.438.551.685.2]Modelling Tools
| Drawing Tools | j Mapping | | Modelling | | Simulation {
Drawing Flow Chart
&,
Spread sheet
Object and
Repositoiy
B titd
Dynamic
Drawing tools are the simplest process modelling methodology, which provides the basic functionality required, portraying a process as a picture often provided by standardised templates, containing the icons and images that meet the users
needs. The functionality of the drawing tools can be extended by mapping tools,
providing spreadsheet functions that allow data entry and basic calculations. Within these tools there are methods that can be used to validate the structure of the diagrams created through the ability to search and report on the data stored.
M odelling tools are usually described as object and repository based, which
means the objects being used within the modelling process are stored in a database (repository). Using the database as the core of the modelling tool provides a system that can manipulate, search and report on data in a flexible manor (www.enix.co.uk). Some modelling tools provide fixed database structures, whilst others allow customisation of structures, which provides extended analytical capabilities, enabling increased flexibility.
The method of performing calculations in a model is commonly described as either ‘static’ or ‘dynamic’ in nature. Static calculations is a result of data that is fixed at a single point in time, whilst dynamic reflects the changes of data over a period of time. Dynamic modelling is the most complex form of
modelling, which is carried out by sim ulation, whilst static modelling is suitable
for almost all BPM purposes except where high volumes of short time frame transactions occur when dynamic analysis may be required. Many of the leading BPM providers advertise simulation capabilities, but that capacity is limited to static modelling, which is often used for Balanced Scorecard activities.
Drawing Mapping Modelling Simulation
ABC Optimal Mood SES Workbench
Visio Process Wise
Workbench Grade Sparks
Process Modeller Action Work Flow Analysis Workflow BPR ARENA
Process Charter Raditor Enterprise
Modeller Witness
ARIS Rethink
BPA First Step
Casewise Process Wise
Workbench
BDF Extend+BPR
Although there are several modelling methods currently available to the market sector, it is only the most robust and comprehensive solutions that will survive in the future. Currently the leading software producers are those who provide comprehensive repository based systems, whilst simple drawing packages will seize to exist if they don’t move on to meet their customers future requirements.
2.3 Approach to Modelling
Although the modelling technique used for a BPM project is very important, a successful project cannot be produced without the people who understand that process and modelling approach. In BPM and Simulation projects the approach to modelling is very important and very similar in method. Without the project structure and the support of the people within the organisation, successful modelling is very difficult. They often become bogged down because the people building the model don’t understand the company and as a result the model will not accurately reflect the business.
Business Process Modelling utilises a normal project lifecycle approach and continuous improvement techniques, the project lifecycle is illustrated by diagram below (Marvin. 2000/
DUCUMEKT &
UNDERSTAND
|~ ANALYSE |
| RE-DESIGN |
| IMPLEMENT |
| M A NAO E |
C OIWOVTCTNIC A T E I
Fig 2: BPM Project Lifecycle
Currently many modelling practitioners have a variety of project
recommendations, Pegden, Shannon, Sholten all have published project planning
guidelines specific to their specialise modelling technique (Pegden. 1990, Shannon. 1990, Shrader. S 2001). However the author feels the lifecycle
demonstrated by M arvin, suitably demonstrates an effective approach for each
In both BPM and Simulation projects the lifecycle is very important and in both cases similar information will be gathered, which would indicated that if an organisation was to build two different models much of the data will be reproduced. Therefore from this perspective an integrated project and model would provide considerable value to an organisation, saving considerable time and manpower.
2.3.1 Identify
The first stage in a Business Process Modelling project is to identify the relevant business processes. Identification of those processes would require a set of process diagrams to describe how the different processes work. A model will enable diagrams to be drawn quickly and easily, capturing information that describes how the process works, linking those processes together to provide the capability to find interactions.
2.3.2 Document and Understand
After relevant business processes have been identified the next stage in a Business Modelling project, is concerned with identifying additional information and combining that information with the process diagrams to produce an integrated business model. This information can then be used to understand how and why the processes involved operate. Providing a combined understanding of more quantitative aspects of the process, such as costs and times, with more qualitative aspects, such as legal requirements, systems limitations, or training requirements. To produce such business models, the modelling tool should ideally (Marvin. 2000)
• Provide a single, managed source of information.
• Have a database that can be customised to store information appropriate to the process being modelled.
• Provide the ability to link parts of a model to external sources of information.
• Generate user-defined reports showing information stored in the model database.
To accurately document and understand an organisation to such an extent would demand capabilities that could not be provided by many of the modelling techniques discussed earlier. Drawing and mapping tools would not provide customised databases, reports, etc. Therefore in detailed projects only modelling tools (e.g. ARIS) would provide the required capabilities to achieve a successful project. These tools would also provide the potential structure to store the additional data required for future simulation projects, either within its modelling structure or linked external files.
2.3.3 Analyse
At this stage of the project the aim is to identify the performance of the processes being modelled, which would result in identification of areas that don’t meet predefined targets. To achieve effective project analysis, a suitable tool should be able to (Marvin. 2000):
• Produce a “benchmark” that clearly illustrates the qualitative and quantitative aspects of the processes.
• Define formulas within the process model that can be used to calculate the performance of the processes.
• Set targets for each performance measure within the business model and then monitor the process performance against those targets.
2.3.4 Re-design
Through the analysis stage of a business modelling project the processes that don’t meet the required performance targets are identified. The next stage is then to re-design those areas, which may produce one or more designs that are improvements of original processes or a totally new process could be designed. At this level a project a modelling tool should be able to (Marvin. 2001):
• Compare and contrast the new designs against the benchmark of the original process.
• Produce “what i f ’ analysis to assess the impact of any proposed changes.
models the role of time within the process and potential random distributions that may effect the efficient running of the new system.
2.3.5 Implement
Once the design for the new process has been identified the next stage of a project is to implement the process. A business model can be used to support implementation by describing the operation of the process, but to be successful at this level of a project, the business-modelling tool must:
• Generate a clear picture of the process that will be implemented.
• Identify the real world constraints, which may be placed on the process.
• Provide a simple approach and syntax for the communication of the business model.
The risks of introducing a project designed under BPM conditions can be limited through Simulation testing, which will greatly increase the potential for success.
2.3.6 Manage
After a new process has been implemented that processes must then be managed to ensure performance targets have been met. Therefore it is then logical to use the business model that constitutes the main knowledge base of the process
concerned to help the management of the process. To manage the process
effectively the modelling tool must (Marvin. 2000):
• Help communicate and identify areas for improvement.
• Provide a benchmark that reflects the constraints of the real world process.
• Provide decision support on the performance of the process.
• Provide the means of comparing the process within the business model and the real world process.
2.3.7 Communicate
• Provide simple communication syntax. • Use the language of the user.
• Provide a package, which is easy to understand for an inexperienced user. • Allow the user easy access to the information stored on the models database. • Provide the user with the capability to search and report on specific
information stored in the database.
• Provide a mechanism, which can allow the distribution of information across the organisation.
• Be method and industry independent.
Although BPM and Simulation tools are used at different points of a project lifecycle it is apparent there are numerous similarities in their approach. When the projects are run separately information is often reproduced.
2.4 Simulation:
Definition of Simulation (Pegden et al. 1990): Simulation - “the process of designing a model of a real system and conducting experiments with the model. Which can be used to develop an understanding of the behaviour of the system or to evaluate various strategies (within the limits imposed by a criteria or set of criteria) for the operation of the system.”
Simulation can be used to study and compare alternative designs or to troubleshoot existing systems, whether the system is a production line, distribution network or communication system. Simulation software provides its users with the capability to examine how existing systems may perform if the original system is changed. Such packages allow the construction and execution of models, which can generate statistics and animation, providing a very useful decision making tool.
future. E.g. the US Department for Defence has realised the importance of simulation and plan to use it throughout their acquisition process in the future
(Evaluating designs (including operational aspects), manufacturing,
maintenance, tactical doctrine and training).
Once simulation has been chosen as a decision making tool within an organisation, there are many barriers to overcome if the goals of the project are to be achieved. Barriers within an organisation may include acceptance from staff, availability of staff to describe various operations, existence of useful data and management expectations. Before a simulation project is started the user must be aware of what simulation can and cannot achieve. They must be aware that simulation cannot be used to optimise a systems performance (it can only describe the results of “what i f ’ scenarios or questions), provide accurate results if the inputs are inaccurate, or describe results that have not been explicitly modelled (Hulpic et al. 2001).
2.4.1 Advantages of Simulation
The following list describes the advantages and disadvantages of Simulation tools:
1. Choose Correctly: Allows the user to test designs without committing
resources or acquisitions
2. Time Compression & Expansion: Processes and shifts can be evaluated in
short periods of time during a simulation activity.
3. Provides understanding: Simulation can be used to model a real world
system to answer the specific questions of the user.
4. Explore Possibilities: Once a real world system has been modelled, the user
can then explore new possibilities, observing the results through computer simulation.
5. Diagnose Problems: Provides an increased understanding of the problem,
allowing a better understanding of the system being modelled and its interactions, which then serve as a valid representation of reality.
6. Identify Constraints: Simulation provides the user with bottleneck analysis,
7. Develop Understanding: Simulation studies can provide the user with an understanding of how a system really operates, rather than indicating personal'predictions on how the system actually works.
8. Visualise and Plan: Within simulation software there are simulation
capabilities available to the user (2D or 3D), which allows the visualisation of the actual system in operation.
9. Builds Consensus: Simulation provides substantial evidence, which identifies
the performance of a system through modelling, testing, validation and visualisation, supplying an objective opinion. Rather than presenting personal opinion that is not sustained by evidence.
10.Prepare fo r Change: Change can be prepared for by answering “what i f ’
questions.
11 .Wise Investment: A simulation study is substantially less than 1% of the cost
that would be needed to implement a design or redesign project.
\2.Train the Team: Simulation can be an excellent job-training tool when
specifically used for that purpose. A team or individuals can learn by their mistakes and learn to operate better. Which is less disruptive and expensive than learning on the job.
13.Specify Requirements: By simulating different capabilities for a machine,
requirements can be established.
From the advantages it is apparent that Simulation tools provide numerous benefits, possibly extending the potential of BPM tools. BPM tools primarily focus upon documentation and analysis of current systems identifying relationships between process resources. However Simulation provides the capacity to take that information and test future systems, through what if analysis (Banks. 1999). The technology could significantly increase the success of many BPR projects using BPM tools and potentially enhance their reputations for future projects.
2.4.1 Disadvantages of Simulation:
1. Model Building Requires Special Training: Model building is a skill and can take a great deal of time to develop, which can make its introduction into projects very difficult.
2. Simulation Results may be Difficult to Interpret: Due to most simulation
outputs being random variables, it may be difficult to determine whether an observation is as a result of a system interrelationship or a randomness.
3. Simulation Modelling can be Time Consuming & Expensive: Skimping on
resources for modelling and analysis may result in a project that is not sufficient for the task.
4. Simulation may be used Inappropriately: Sometimes simulation can be used
when other methods are more appropriate.
Many of the limitations of Simulation are a direct result of the complexities of the technology, which will only be overcome through education and training. Although there are limitations, Simulation is a valuable tool that can greatly increase the value of many projects, providing implementation is introduced correctly (Banks. 1999). However these disadvantage may become less relevant in the future, because today software vendors are now developing models that only require input data for there operation. These models have generic tag “simulators” or templates.
2.5 Simulation Methods:
Like BPM modelling tools there are a variety of Simulation tools, which are developed for a diverse range of industries and purposes. There are currently several different classifications of simulation modelling techniques that include
Static, Dynamic, Continuous, Discrete and Deterministic (Kelton et al. 2002).
The research will investigate and conduct its experimentation using Discrete
Event Simulation, which is extensively used within similar business areas to
those used in BPM projects. Therefore providing a platform, which will enable suitable integration.
Although there are many different Discrete Event Simulation vendors, each tool
consists of basic components that combine to provide comprehensive analysis of physical systems (Ingalls. 2001). These components define the Simulation
method to enable Discrete Event Simulation. The Simulation capacity and
structure is created through a combination of Entities, Activities, Events, Resources, Global variables, a Random number generator, Calendar, System State Variables and Statistic collectors.
The function of an Entity is to cause a change in state within a simulation
model, without those entities nothing would happen. Entities have attributes, which are there unique characteristics. An entity is something that is passed through a system, which could include parts within a manufacturing system or calls within a call centre. There attributes would typically be made up of there arrival and leaving times through the system.
Activities are the processes and the logic in the simulation, whilst the Events are
the conditions that occur at the point in time that causes a change in state in the model. There are three major types of activities within a simulation model,
which include delays, queues and logic. A delay activity is when an entity is
delayed for a defined period of time and that delay can be for a constant or random period of time. Queues are the places within a simulation model that are waiting for an unspecified period of time, where entities can be waiting for specific resources or for a specific condition to occur. Logic activities allow the entity to effect the state of the system through the manipulation of state variables or decision logic (Ingalls. 2001).
In a simulation model a Resource represents anything that has a restricted
capacity. Common examples would include workers, machines, nodes in a communication network, traffic interactions, etc.
The Global Variables, Random number generator, Calendar and System State
Variables combine to provide the platform to model the changes that occur in
relation to time. Producing the random generation of behaviour and flexibility to model real world systems, using system constraints that may occur.
The Statistics Collectors are the part of the simulation that collects the state of
weighted values of different variables within a simulation model, tally statistics are collected one observation at a time without regard to the amount of time between observations.
From the definition of Discrete Event Simulation tools it is apparent that their
methodologies are complex and require extensive knowledge of the tool to build an effective Simulation model. The identification of the elements that contribute to building a project defines the contrast in complexities between Simulation and BPM tools. BPM tools do not provide the opportunity to test the movement of entities and the effect of random behaviour within a system.
Although it is apparent that both techniques are used for different purposes, both methods follow similar project lifecycles, where their success is strongly determined by system definition and data interpretation of the processes that they are modelling. Therefore organisations that are using the tools will often evaluate and prepare the same information to use in different projects. The research has shown that the automatic generation of computer simulation models from BPM models will increase their individual capacities and may reduce their limitations.
Currently BPM tools are limited by their capability to test process redesign prior to its implementation, whilst Simulation is limited by its complexities and training requirements (www.enix.co.uk). Therefore a fully automated system may reduce their individual limitations and promote their future use. These theories are supported by numerous industries and universities, which have previously researched or considered integrated solutions (Field, Harrel. 2001).
2.6 Research into the Integration of Process Mapping and Simulation Tools
(Field, Harrel. 2001)
ProModel simulation. The first integration example investigated integration of Meta software’s design/IDEF with ProModel, whilst the second investigation integrated ABC Flowcharter from Micrografx Incorporated. Both of the tools used are based on different paradigms, which provide different problems for the issue. One of the case studies uses a modified process modelling tool, whilst the other uses OLE automation, which requires no modification to the process mapping or simulation software.
Previous attempts to integrate both technologies have identified
incompatibilities in the purpose and the model, where success was limited. Within process modelling technologies there is insufficient data for the production of a simulation model and as a result information had to be added, requiring extensive knowledge of both products in use. Successful integration of the products would extend the usefulness of process mapping, making simulation more acceptable among those doing process reengineering. Process mapping tools can be classified as structured (IDEF) or unstructured (e.g. ABC Flowcharter), structured methodologies impose a specific methodology for representing processes, whilst unstructured tools leave it to the modeller, on how they want to represent a process.
Advantages of Structured Methodologies:
• Imposes structure and provides categories for all areas of the process.
• Standardises process mapping, so diagrams are easily communicated and constant.
1
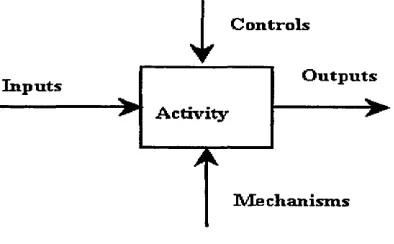
ControlsOutputs Inputs
A ctiv ity
Mb chanisms
Fig 3: IDEF Methodology
As described in Fig 3 it is apparent that there are parallels between both IDEF and Simulation, which include:
Both packages utilise inputs and outputs. • Both have activities.
• Both utilise mechanisms or resources in performing activities.
• Both use controls to determine, when, where and under what conditions the activity is performed.
[image:35.614.193.390.29.151.2]2.6.1 Case Study: Integration of Design/IDEF and ProModel Simulation
The challenge when integrating ProModel simulation with Design/IDEF was to extend the definition capacity, whilst deviating from the basic IDEF methodology. The following extensions were made:
• The addition of entity attributes.
• The addition of input buffers to every activity. • A method of modelling different entity types.
• The addition of data fields to capture dynamic information.
The purpose behind the integration was to have the entire model built using Design/IDEF, which could then be used to create a simulation model file that could then be read in and executed by ProModel. Through the project development, the developer enabled a solution that provided the user with the capability of producing a model through the one interface (Design/IDEF) for both process mapping and simulation. However in this approach the Design/IDEF code had to be significantly modified to allow input data required to run a simulation model within Design/IDEF.
2.6.2 Case Study: Integrating ABC Flowcharter and ProModel
ABC Flowcharter is a process-modelling package that is based on an unstructured methodology, which in this case was integrated through OLE automation technology, which required no modification of either application. A separate application was then written that communicated with ABC Flowcharter using OLE automation to display simulation related property sheets, which are displayed as shapes and connections created in ABC Flowcharter. Once the model is defined it is then translated by this separate application to a ProModel model and simulation.
Research has identified numerous considerations and problems that occurred within past investigations, which cannot be ignored. However it is apparent that the research was conducted prior to 1996, which researched modelling methodologies that have significantly advanced their techniques. Therefore the research project is justified in conducting experimentation into the subject area.
2.7 Summary
The Literature Survey has comprehensively evaluated the potential of Automatically Generating computer Simulation models from a Business Process Modelling format. Research has been substantiated through analysis of both methods, past research and support from related parties.
At the current time it is apparent that leading Simulation companies are providing the capacity to import data from tools like VISIO. Simulat8 and Witness (www.simul8.com & www.lanner.com) provide the capability to transfer VISIO data into their Simulation package. Although VISIO is only a simple drawing tool, it is within the BMP family, indicating a potential market, support for a fully automated solution and the capacity to exchange data between packages. There are many examples where data and software have been connected to provide a variety of capabilities. Simulation tools like ARENA are often interfaced with external software; connecting spreadsheets, databases and IT systems (Seppanen. 2000).
Chap
ter 3: Benchmarking
After the evaluation of Business Process Modelling (BMP) concepts and past integration research it is evident that a detailed investigation into current modelling tools is required. Analysis has identified the importance of the modelling method and the effect that approach has on the potential integrated solution. Currently there are many modelling methods available targeting a variety of markets and as a result the research will target the BPM tools, evaluating their limitations, advantages and simulation capabilities. The investigation will also evaluate the companies that use the software, their requirements and the impact that those solutions have had on their particular organisation. The benchmarking study has been conducted through extensive research, which has included software/company meetings, product testing and analysis of current documentation.
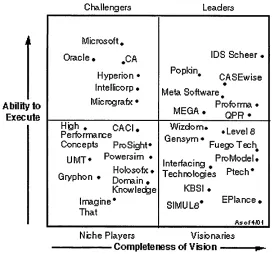
The following diagram identifies the organisations currently competing in the Business Process Modelling market, and possible future challengers to their market shares. (IDS Scheer, www.idssheer.com)
Ability to Execute
Fig 4: Leading BPM Software Providers
Traditionally Business Process Modelling was used for implementation, mergers, acquisitions, and the design and optimisation of workflow. However today such packages are now being used by enterprises to create new and
27
Challengers Leaders
Microsoft* Oracle • #CA
Hyperion • Intellicorp • Micrografx •
IDS S c h e e r «
Popkin .
CASEwise• Meta Software #
Proforma* MEGA. Q p R . H igh* C AC I.
Performance
C oncepts Pro Sight* UMT* P °w ersim • Holosofx ♦ Gryphon * Domajn #
Knowledge Imagine*
That
W izdom . , L eve|a G ensym * _ _ . FuegoT ech# , . , ProModel* Interfacing #
T echnologies Ptech* KBSI .
SIMUL8* E P Iance* Asof4AH Niche Players Visionaries
[image:39.612.153.426.387.641.2]adaptable work flows to remain competitive. Due to the requirement of today’s businesses for richer process design and implementation, Business Process Management packages have developed, offering sophisticated workflow design features.
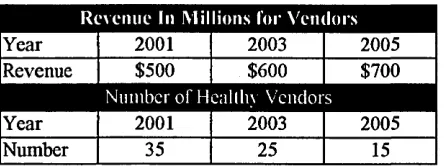
Year 2001 2003 2005
Revenue $500 $600 $700
m m
Year 2001 2003 2005
Number 35 25 15
Table 2: BPM Market Trends (www.idsscheer)
A recent report predicts that the use of BPM software will continue to grow over the next few years within a variety of industries, increasing potential revenue for vendors, but possibly reducing the number of those vendors to only the strongest companies within the sector. The following investigation will attempt to benchmark five of the strongest companies within the sector, evaluating the strength of their product and particularly their simulation capacity. The five products that will be benchmarked include:
1. Proforma 2. Popkin 3. Casewise 4. MEGA 5. ARIS
The Chapter will summarise the findings of the investigation, including the detailed product analysis within the appendix 1.
3.1 Benchmarking
[image:40.613.185.408.105.188.2]Benchmarking was a term that became fashionable in the 1990’s as a means of an assessment of a company’s performance. Since this period benchmarking has developed a considerable influence on many companies as a means of continuous improvement within both their internal or external markets. Within the concept of benchmarking there are three distinct areas that include process, performance and strategic benchmarking, which target specific areas of investigation.
The following investigation would be classed as ‘Performance Benchmarking’, which provides a reference point for the project through measuring the capabilities of software vendors that are documented as being the best in the sector. ‘Performance Benchmarking’ enables business managers to assess their competitive positions through product and service comparisons. Usually such a study will focus upon elements of price, technical quality, ancillary product or service features, speed reliability and other performance criteria. The primary techniques for performance benchmarking are reverse engineering, direct service or product comparisons and analysis of operating statistics. Currently there are many industries that employ performance benchmarking as a standard competitive tool, some of which include automotive, computer, financial services etc.
The aim of the benchmarking study is to investigate several BPM vendors to ascertain the capacity of their products, methodologies and simulation capabilities. The following study will evaluate the software vendors through the following criteria:
• Company Overview • Product Overview
• Operating and Support Environments • Product Details
• Simulation Capacity • Integration Capacity • Organisational Use
Company Overview: The aim is to identify the company’s background, which
will also evaluate the company’s presence worldwide and identify any partnerships that may influence their customer base. It is felt that this section of the study will provide a background to the company and develop an understanding of their brand strength. Identifying possible influences on the product and the effect that those influences may have on their customer base.
Product Overview: This section briefly describes the BPM vendor’s products
that are being offered to their customers.
Operating and Support Environments: Provides a brief description of the
operating environments, platforms and memory requirements for the particular package. The aim is to identify requirements for operating the software.
Product Details: This section will investigate the product structure,
methodology and capacity to meet their customer requirements. The aim is to develop an understanding of the product, its modelling capabilities, and flexibility to react to varying customer requirements and the ease at which new customers can use the product.
Simulation Capacity: This section focuses upon the simulation capacity of the
BPM tools, their target area, methodology, product features and comparison with dedicated simulation packages. This will establish the true capacity of their simulation capabilities and identify the need for an integrated solution between the disciplines.
Integration Capacity: Within this section of the investigation the aim is to
evaluate the capabilities of each package to import and export data from external sources. This will establish capacity for integration and options available.
Organisational Use: Through the investigation of customer profiles and past
3.2 Software Review
In the analysis of the available products the research has primarily focused upon Integration capacity, Simulation capabilities and organisational use, which answer the primary objectives of the study. These objectives were also supported by the assisting benchmarking categories, which established valuable product and company information that substantiated the findings. A full and detailed analysis of each tool is located within Appendix 1. The objectives of the study were:
• Identify the product Integration capability and its compatibility for data transfer.
• Establish the true Simulation capabilities of the BPM tools in comparison to a dedicated solution.
• Evaluate the Organisational Use of the BPM tools to establish the role of their advertised simulation capabilities and their industrial focus.
When considering the capabilities of the tools investigated it is apparent that each company offers similar solutions, and it is very difficult to select the best package based on those solutions. In a decision between the best package it is apparent that customer must have a clear idea of their requirements in order to make the decision most suitable to them. However through careful analysis the author feels that for integration of an external simulation package there are clear benefits to using a particular package and the study has also identified the limitations of the simulation capabilities within their solutions.
Through the benchmarking of the five BPM packages it is apparent that there are a variety of common trends that occur within each company, which must be considered when investigating the different criteria within the study. Comparing the packages that have been investigated within this study in respect to the Gartner report, it is apparent that the leading BPM providers are strongly related to their market experience.
5. MEGA (Est.1991)
Therefore it could be assumed that the market sector is very difficult to enter and the products may not be sold on their superior features. This argument could also be supported by the fact that the customer base of the benchmarked companies is strongly related to their country of origin and company headquarters. It is apparent that a large proportion of ARIS client base is German and MEGA’s is largely French.
Benchmarking BPM tools has indicated that the companies investigated are all targeting an international presence, which they have all supported through strong technical and consulting partnerships. However in retrospect it is also apparent that each company is targeting slightly different markets, which would mean that corporate benchmarking studies should be influenced by their requirements.
Through evaluation of the products that have been investigated it is apparent that there are distinct differences between the methodologies, which the top two companies (as state by the Gartner report) and their rivals have implemented. Popkin and ARIS provide structured methodologies that require comprehensive knowledge of their method, including associated rules. Whilst their competitors (Proforma, Casewise and MEGA) provide products, which are flexible to their customer requirements, whilst enabling UML languages within there solutions. Therefore supplying their customers with software that is easier to use and understand, without the need for extensive training.
Fig 5: The ARIS House
[image:44.612.215.400.524.652.2]be used it could be assumed that the best approach would be to use their UML as the method of transfer. However this approach restricts the user and looses the advantages of using such packages.
3.2.1 Integration Capabilities
From the evaluation of the integration capacity of the products investigated it is apparent that all the BPM packages enable integration with external products for the presentation of information within varying formats and their use within different software packages.
Import: Export:.
Visio MS Project
HTML RFT
Access or a common delimited format file bi-directional Rose and Erwin
Interfacing with leading application can be provided through Rational Erwin
C++ DDL XML
Table 3: Proform’s Integration Capacity
Proforma provides a variety of export facilities and languages that allow its
users to transfer information to suit their requirements. These capabilities are a result of their technical partners, which include Microsoft, IBM and Rational. The integration options available are heavily targeted towards specific market sectors, but do provide a variety of data transfer options.
Within Popkins Systems Architect a data dictionary is used across all modelling
Casewise’s corporate modeller has the capability to integrate with many Microsoft Office products, which can be used to gather information, analyse processes and produce documentation. The package can also link to many code generation applications including:
- Sybase’s Power Designer - Rational Rose
- Staffware
- Oracle Designer - J D Edwards
- SAP ERP Technology
MEGA Integration provides the capacity to export modelling data into Word and
produce HTML documentation for structured Web sites.
ARIS products have the capability to integrate with the Internet and company
Intranets, which allow the integration of Process Models/Documentation through the use of Java and HTML exports that are supported b