www.wjpr.net Vol 7, Issue 16, 2018. 1508
SELECTION-EVALUATION OF DIFFERENT EXCIPIENTS FOR
PREPARATION OF LEFLUNOMIDE TABLETS
Siddhartha Choudhury*
Department of Pharmaceutical Science, Assam University, Silchar, India.
ABSTRACT
Disease Modifying Anti Rheumatic Drug( DMARDs) reduces the rate
of damage to the bone and cartilage and prevent bone and joint damage
from occurring secondary to the uncontrolled inflammation. DMARDs
have been found to produce durable remission and delay or half
disease progression. Chemically synthesize DMARDs are
Azathioprine, Cyclosporine, Hydroxychoroquine, d-penicillamine,
Leflunomide. Leflunomide is recently introduced immonumodulator
inhabits proliferation of activated lymphocytes in patients with
Rheumatoid arthritis. Arthritis symptoms are suppressed and
radiological progression of disease is retarded. The study was under
taken with an aim of Selection-Evaluation of Excipients (Binders) for preparation of
Leflunomide tablets will be carried out. Preformulation study was done on pure drugs and
granules and results directed for further course of formulation. Based on preformulation
studies different batches of Lefiunomide were formulated using different excipients. Granules
were evaluated for Loss of drying, Angle of repose, Bulk density, Tapped density, Carrs
index and Hausner‖s Ratio. Tablets were tested for weight variation, thickness, hardness,
disintegration time. In-vitro drug release studies as per specifications. The formulation that
has been found to posses ideal characteristics required for Leflunomide 10mg, 20mg Tablets,
so it was concluded as the final formula for Leflunomide 10mg and 20mg tablets are 150mg,
200mg respectively made by co-precipitation of drug with Hydroxypropylmethylcellulose
K100M, Polyvinylpyrrolidine K30, Gelatin, Guar gum. The drug release profile of
Leflunomide compared with the market sample. From the studied it was concluded that
preparation of Leflunomide tablets containing Lactose monohydrate, Starch, Magnesium
streate, Dry starch taken as ideal or optimized preparation of tablets.
Volume 7, Issue 16, 1508-1543. Research Article ISSN 2277– 7105
*Corresponding Author
Siddhartha Choudhury
Department of
Pharmaceutical Science,
Assam University, Silchar,
India.
Article Received on 17 July 2018,
Revised on 07 August 2018, Accepted on 27 August 2018,
www.wjpr.net Vol 7, Issue 16, 2018. 1509 KEYWORDS: Azathioprine, Cyclosporine, Hydroxychoroquine, d-penicillamine.
Drug Profile of Lufifiunomide Brand name : Arava.
Synonyms : HWA486
Chemical/ IUPAC name: N – (- 4 – trifluoromethyl Phenyl) – 5 – methylisoxazole – 4 –
Carboxamide
Description
Appearance : Leflunomide is a white or almost white powder.
Solubility : Leflunomide is freely soluble in acetone, in Methanol in
alcohol, in 2 – propanol, in ethyl acetate, in acetonitrile and in chloroform. Practically in
soluble in water.
Chemical structure
Molecular formula : C12 H9 F3 N2 O2 Melting point : 165-166oC Molecular weight : 270.2
Purity : move than 99%
Half life : Approximately 2week
Storage : Store in well closed light resistant container
PHARMACOLOGY
Leflunomide is an isoxazole derivative. It exact mode of action is unclear. The active
metabolite of l (A777726) binds to dihydro- orotate dehydrogenase, an enzyme involved in
the synthesis of pyrimidines. As consequence there is reduction in uridine tri-phosphate
levels and pyrimidine synthesis by Lymphocytes and other rapidly dividing cells. The action
of the enzyme triosinekinase is also reduced. These effect result in changes in DNA and RNA
www.wjpr.net Vol 7, Issue 16, 2018. 1510 production and inference with cell adhesion. There is also suggestion that its
anti-inflammatory activity is due to its ability to inhibit histamine release and cycloxygenase-2
in-vitro.
DRUG INTERACTION
Cholestyramine significantly reduces the plasma concentration of leflunomide metabolite
and the two should not be co-administered (unless as part of the washout procedure)
Administration with other DMARD‘s or other hepator haimatotoxic drugs may inercase the
rise of toxicity it switching from leflunomide to another DMARD a washout procedure
should be considered. Alcohol should be avoided with Leflunomide. Causion should be used
if given concomitantly with phenytoin, warfarin, tobutamide or rifampicin.
Patient should not be given live vaccination whilst taking leflunomide for some time after
wards to its long half life
ADVERSE EFFECT
The most common effect with leflunomide are gastrointestinal symptom‘s (excluding
diarrhea, nausea, vomiting, abdominal pain and oral ulceration), allergic reaction (eg- – rash,
pruritus and rarely anaphylaxis) Anorexia, weight loss, heat ache, hypertension and dizziness
has been reported.
Dose : 10mg, 20mg/day,
It is not to be used in children and Pregnant / Lactating women.
Use : leflunomide usually and in the treatment of rheumatoid arthritis.
Pharmacokinetic and Pharmacodynamic
Bioavailability : 80% bioavailability after oral administration (Gonzalez et at 1994)
Protein binding : Leflunomide is highly bound of plasma protein (>99%)
Volume of distribution: 25L
Elimination half life : approximately 2 week
Metabolism : Leflunomide is metabolized to major metabolite A771726, a
malanonitrilamide, plasma concentration of A771726 appears linear across the different
dosages range (in 5 – 25 mg daily)
www.wjpr.net Vol 7, Issue 16, 2018. 1511 5. MATERIAL AND METHODS
Table 5.1 List Of Ingredients Used
SL.No Ingredients Company name
1 Leflunomide Aventis pharma limited, bmfay 2 HPMC K100M Stadmed Pvt. Ltd, Kolkata
3 Magnesium Stearate Merck Specialities private Limited 4 Lactose monohydrates Merck specialties Private Limited 5 Guar gum Merck specialties Private Limited 6 Polyvinyl pyrrolidone K30 Merck specialties Private Limited 7 Starch Merck specialties Private Limited 8 Acetone Merck specialties Private Limited 9 Athanol Merck specialties Private Limited 10 Sodium hydroxide Merck specialties Private Limited
5.2 List of Instruments Used
SI. NO. Instruments Company name
1 Electronic balance Denver instruments, Germany 2 Digital Ph meter Sartorius PB-11, USA
3 Tablet compression machine Hindustan machineries, Kolkata 4 Sieves (18mesh) Testing instruments, kolkata 5 UV- Visible Spectrophotometer Shimadzu- 1700, Japan 6 Hot air oven Testing instruments, Kolkota 7 Dissolution apparatus Digital dissolution apparatus, Testing instruments, kolkata 8 Digital friability test apparatus
9 Monsanto hardness tester Testing instruments, kolkata 10 Disintegration apparatus Testing instruments, kolkata 11 FTIR Spectrometer Perkin Elmer, spectrum-100,UK
5.3. SPECTROPHOTMERIC METHOD FOR LEFLUNOMIDE
The UV spectrophotometry method was developed for the analysis of the drug using double
beam shimadzu 1700 spectrophotometer.
A) Determinatinatio maximum wavelenth of Leflunomide in Phospate Buffer(Ph 7.4) Leflunomide was accurately weighed and dissolved in 10m. Mol phosphate buffer of pH 7.4
to prepare a stock solution of 1mg/ml.the stock solution was futher diluted to 10mcg/ml with
dilutent (10m.Mol phosphate buffer of Ph 7.4).then the diluted solution was scanned for
maximum absorbance in UV double beam spectrophotometer (shimandzu1700) in the range
of 190 to 400 nm, using 10m.Mol phosphate buffer of pH 7.4 as blank. The λmax of the was
www.wjpr.net Vol 7, Issue 16, 2018. 1512 B). PREPARATION OF STANDARD CURVE OF LEFLUNOMIDE LEFLUNOMIDE 100 mg of Leflunomide was accurately weighed and dissolved in 100 ml of m.Mol phosphate
buffer of Ph 7.4 to prepare stock solution. The adequate amount of stock solution was further
diluted with 10m. mol phosphate buffer of ph 7.4 to get 1ug to 10ug of drug per ml of the
final solution. Then the absorbance was measured in a UV spectrophotometer at 250nm
against 10m.mol phosphate buffer of Ph 7.4 as blank. The results obtained were as shown and
the average absorbance Vs conc. Curve (standard curve) plotted was shown in figure.
5.4. PREFORMULATION STUDIES 5.4.1. Drug – Polymers Interaction study
A). Demonstrated Scanning Chromotography(DSC) of the Leflunomide and Excipients to study the interaction between components.
In this technique the difference in energy inputs into a substance and reference material is
measured as a function of temperature as the specimens are subjected to controlled
temperature program. The samples were prepared by physical mixture of drug and excipients
(1:1) using a clean dried glass mortar and pestle. Samples (3mg) were accurately weighed in
aluminum pan and hermetically sealed in aluminum lid. Thermograms were obtained using
Parkin Elmer, Jada (Pyris 6.0), USA, instrument, heating at a constant rate of 10 C/min, over
a temperature range of 50 – 200C. to maintain on inert atmosphere nitrogen gas was purged
at a rate of 20 ml/min.
B) Fourier Transform Infared( FTIR) spectroscopy of the Leflunomide and Excipients to study the interaction between components.
There are two types of fundamental vibrations in a molecule (Dyer, 1984).
Stretching, in which the distance between two atoms increased or decrease, but atoms remain
to in same bond axis.
Bending in which the position the atom changes relative to the original bond axis.
The various stretching and bending vibrations of bond occur at certain frequencies. When
infrared light of same frequency is incident on the molecule, energy is absorbed and the
amplitude of the vibration increased. Most groups such as C – H, C = O and C = N give rise
to infrared absorption band which ultimately characterizes a compound. For a non – linear
www.wjpr.net Vol 7, Issue 16, 2018. 1513 Sometimes an additional (non-fundamental) absorption band occurs because of the presence
of overtones.
The dried powder sample of 100 mg was taken with 10mg of KBr and grounded together to
make it fine. They were scanned over a wave number range of 4000 cm-1 to 400 cm-1 using
FTIR (Perin Elmer, USA, Model: Spectrum one, Version A).
5.4.2. Scanning Electron Microscopy (SEM)
Conventional light microscopes use as series of glass lenses to bend light waves and create a
magnitude image. The Scanning Electron Microscope creates the magnified image by using
electrons instead of light waves. The SEM shows very details 3- dimensional images at much
higher magnification that is possible with a light microscope. The image created without light
waves black and white.
Samples have to prepared carefully to withstand the vacuum inside the microscope. Our SEM
samples are coated with a very thin layer of gold by a machine called a sputter coater. The
sample is placed inside the microscope‘s vacuum column through an air-tight door. After the
air is pumped out of the column, and electron gun (at the top) emits a beam of high energy
electrons. This beam travels downwards through a series of magnetic lenses designed to focus
the electrons to a very fine spot. Near the bottom, a set of scanning coils moves the focused
beam back and forth across the specimen, row by row. As the electron beam hits each spot on
the sample, secondary electrons are knocked loose from its surface. A dectector counts
electrons and seds the signals to an amplifer.
The final image is build up from the number of electrons emitted from each spot on the
sample. The Scanning Electon Microscope is revealing new levels of detais and complexity
in the amazing world of miniature structures.
5.5. METHOD OF PREPARATION OF LEFLUNOMIDE TABLET
Tablets containing 20 mg of Leflunomide were prepared by wet granulation method. In the
wet granulation method the drug Leflunomide were, polymer HPMC K100M, Dry starch,
guar gum or PVP K30, lactose monohydrates, gelatin were accurately weighed (as mentioned
in table) and mixed homogeneously in geometrical proportion. Then prepared sufficient
amount of binder (10% HPMC K100M dissolved in 20ml of hot water, stirred and cooled,
www.wjpr.net Vol 7, Issue 16, 2018. 1514 20ml of hot water stirred cooled, 10% PVP K30 dissolved in 20ml cold water stirred well
and10% Gelatin dissolved in 20ml of hot water, stirred well) and added to the mixture of
drug, polymer, dry starch and lactose, then mixed these to get a cohesive mass and granulated
though sieve no.16. wet granules were dried in a hot air oven at 40oC for 4 hrs. The dried
granules were passed through sieve No.18 and blended with magnesium stearate. The
homogeneous blend was then compressed into tablets using 8 mm circular flat punches in 10
station compression machine.
5.6 GENERAL DESIGN OF EXPERIMENTS Design of experiments
The purpose of the ―Design of Experiments‖ is to ensure that the experimenter Obtains data
relevant to his hypothesis as comical a way as possible. The economic aspect of
experimentation cannot be emphasized too strongly. The experimenter is always in the
position of being able too, or wishing to, spent only a certain amount of time, labour, money
etc, on his investigation, and it is certain that there are were and efficient way of using these
resources. However every statement drawn from experimental data is subject to so me error,
whose probability can be made with the help of mathematical statistics.
5.6.1 FOR MULATION STUDIES
TABLE 5.3. Composition all trial batch of formulation of leflunomide tablet.
Ingredients F1(mg) F2(mg) F3(mg) F4(mg) F5(mg)
Leflunomide 100 100 100 100 100
Lactose mono
hydrate 1200 1200 1200 1200 1200
Dry starch 0.7 0.7 0.7 0.7 0.7
Mg. stearate 0.2 0.2 0.2 0.2 0.2
Bender qs qs qs qs qs
Bending agents PVP10% Guar gum10%
Starch paste 10%
H PMC
K100M10% Gelatin10%
*Every batch is estimated at least performing 5 batches of products.
Abbreviation:
HPMC : Hydroxy propyl methyl cellulose
PVP : Polyvinyl pyrrolidenone
Mg.stearate : Magnesium stearate
www.wjpr.net Vol 7, Issue 16, 2018. 1515 Tablet- enlists the composition of different trial formulation prepared using varying amount
of hydorxy propylmethyl cellulous (HPMC) as release controlling polymer and polyvinyl
pyrrolidinone (PVPK30), guar gum, starch paste,gelatin as binder along with fixed quantity
of magnesium stearate as lubricant and lactose monohydrate as filler or diluents.
5.7. Experimental Evaluations
Granulation is the key process in the production of table dosage form involving the sustained
release of a drug from different type particles. Physical properties of such as specific surface
area, shape hardness, surface characteristice and size can significantly affect the rate of
dissolution of drug.
Micromeritic properties 5.7.1 Angle of Repose
Angle of repose of granules was measured by fixed funnel standing method. The accurately
weighed granules were taken in a funnel, the height of the funnel was adjusted in such a way
that the tip of the funnel just touch the apex of the heap of the granules. The granules were
allowed to flow through the funnel freely onto the surface. The diameter of the powder cone
was measured. Angle of repose was calculated using the following equation (cooper and
Gunn, 1986):
θ = tan¯¹h/r (4.1)
Where
θ = angle of repose,
r = the radius of the base the pile,
h = height of the pile.
5.7.2 Bulk density of powder blend for Leflunomide tablet
Both loose bulk density (LBD) and tapped bulk density (TBD) were determined. A quantity
of 2 gm of powder from each trial formulation, previously lightly shaken to break any
agglomerates formed, was introduced into a 10-ml measuring cylinder. After the initial
volume was observed, the cylinder was allowed to fall under its own weight onto a hard
surface from the height of 2.5 cm at 2-second intervals. The tapping was continued until no
further change in volume was noted. LBD and TBD were calculated using the following
formulas (shah et al., 1997)
www.wjpr.net Vol 7, Issue 16, 2018. 1516 LBD= weight of the powder / volume of the packing --- (4.3)
5.7.3 Compressibility index of powder blend for Leflunomide tablet
The Carr’s index (CI) is an indication of the compressibility of a powder. It is calculated by
the formula, where is the freely settled volume of a given mass of powder, and Vт is the
tapped volume of the same mass of powder.
The Carr index is frequently used in pharmaceutics as an indication of the flow ability of a
powder. A Carr index greater then 25 is considered to be an indication of poor flow ability,
and below 15, of good flow ability [mark Gibson et al 2001]. But Carr index, 20 to 40 shows
reasonable flow property.
Carr‘s index (%) = [(1-Vт/Vв) x100] ---4.4
It also expressed as,
Carr‘s index (%) = [(1-ρв/ρт) x100] ---4.5 Were, ρв is loose bulk density and ρт is tapped bulk density.
5.7.4 Hausner ratio of powder blend for Leflunomide tablet
Hausner ratio was determined by using the ρв is loose bulk density and pt is tapped bulk
density. Hausner ratio is greater than 1.25 is considered to be an indication of poor flow
ability.
Hausner ratio = ρт / ρв --- (4.6)
5.8. Evaluation of Leflunomide Tablets
5.8.1 Measurement of thickness of Leflunomide tablet
The thickness of tablet was measured by using screw gauge. The thickness variation should
be with in ±5% limit. All the thickness was measured by screw gauge. In this screw gauge,
main scale reading (MSR) = 2mm
Circular scale reading (CSR) = 64mm
Least count (LC) = 0.01
Error = 6 x 0.01 =0.06
Total thickness = [{MSR + (CSR x LC)} +0.06] (4.6)
5.8.2 Tablet Hardness (lee et al., 1999, Lachman et al., 1987)
In this experiment Monsanto hardness tester determined hardness of tablets. It has a
www.wjpr.net Vol 7, Issue 16, 2018. 1517 between the spindle and anvil. The desired pressure needed to hold the tablet in position was
moved so that the indicator was fixed zero. The pressure was then applied till the tablet
broken. The reading was noted, which indicate the pressure which was needed to break the
tablet.
5.8.3 Measurement of tablet friability of Leflunomide tablet
The friability of tablets was determined by Roche friabilator. This device subjected a number
of tablets to combined effects of abrasion and shock by utilizing a plastic chamber that
revolved at 25 rpm, dropping the tablets a distance of six inches with each revolution. 20
tablets were weighed and placed in the friabilator; it was operated for 100 revolutions. The
tablets were then dusted and reweighed.
For the calculation,
%weight loss = initial weight of tablets (w¹) – final weight (w²) / w1 x 100 ---(4.8)
conventional compressed tablets loss less then 0.5 to 1.0 % of their weight are generally
acceptable.
5.8.4 Weight variation test of Leflunomide tablets
For each batch 20 tablets were selected randomly and their average weight was determined.
Weight of the individual tablet was also determined. The tablets meet the weight variation
test if not more than of the individual weights deviate from the average weight by more than
the percentage shown in table 4.4 below and none deviates by more than twice that
percentage.
Table 5.4. official specification of weight variation
Average weight of tablet Percentage deviation
80 mg or less 10
More than 80 mg but less than 250 mg 7.5
250 mg or more 5
5.8.5. Content uniformity test of Leflunomide tablets
The Weight variation test is clearly not sufficient to assure uniform potency of tablets of
moderate or low dose drugs, in which excipients make up the bulk of the tablet weight. To
assure uniform potency for tablets of low dose drugs, a content uniformity test is applied. 30
tablets are randomly selected for sample, and at least 10 tablets are assayed individually
www.wjpr.net Vol 7, Issue 16, 2018. 1518 115%of the labeled drug content. The 10th tablet may not contain not less than 75% or more
then 125% of the labeled drug content. If these conditions are not met, the tablets remaining
from the 30 must be assayed individually, and none may fall outside of 85 to 115%.
The content uniformity test of Leflunomide tablets was performed (as per IP, 1996) by following way
Weighed and powered 20 tablets, weighed accurately a quantity of the powder equivalent to
0.5 g of leflunomide extracted with 60 ml of acetone for 15 minutes and filter. Washed the
residue with three quantities, each of 10 ml, of acetone and gently evaporated the filtrate just
to dryness in a current air. Dissolved the residue in 100 ml of ethanol (95%), previously
neutralized to phenolphthalein solution, and titrated with O.IM sodium hydroxide using
phenolphthalein solution as indicator.
5.8.6 Disintegration test of Leflunomide tablets
The drug release process from tablets often includes a step at which the tablets disintegrate
into smaller fragments. In our experiment the disintegration test was done by using USP
disintegration test apparatus (excel, India).
To test the disintegration test three tablets of each batch was placed in 3glass tube and the
basket rack was positioned in the beaker containing 900 ml of phosphate buffer pH 7.4
solution maintained at 37 ±2˚c. The disintegration time was recorded using mobile phone
stop watch.
5.8.7. Dissolution studies of Leflunomide tablets
The drug delivery from the dosage form is studies by using the in vitro release test. The
purpose of an in vitro release study is to provide a fast, easily performed and inexpensive
method that correlates with the performance of a dosage form in human subjects. Numerous
advantages can be exemplified on treating in vitro data in kinetic fusion.
In vitro release profile of Leflunomide from the preparations was examined in pH 7.4, 10
m.Mol phosphate buffer from 0 to 2hrs using USP-II dissolution rate test apparatus (rotating
paddle type) at 100 rpm. One tablet accurately weighed, was placed in the 900 ml of
dissolution medium and maintained at 37 ± 0.5˚c. 1ml aliquot of was withdrawn from
dissolution media periodically at intervals of one hr by manual sampling, and same volume of
www.wjpr.net Vol 7, Issue 16, 2018. 1519 the sink condition automatically. Withdrawn samples were further diluted properly with fresh
medium. The diluted samples were analyzed spectrophotometrically at the wavelength of
maximum absorbance (λ max) 250 nm. Concentration of drug in solution was, than
determined from the calibration curve and cumulative percent release was calculated.
5.9. Study of release kinetics on in vitro release profile of Leflunomide tablets.
Different kinetic equation (zero order, first order, higuchi‘s equation) were applied to
interpret the release rate from matrix system using linear regression. From the release kinetic
the mechanism of drug release may also be known.
Zero- order release kinetics
According to this model, under stander condition of temperature and agitation the dissolution
medium, the dissolution rate model can be described by the equation:
dq/ dt = ko---- (4.9)
Or, in integrated form,
q= kоt --- (4.10)
Where, q= cumulative % release,
ko = zero order release rate constant
t = time
A plot of q vs t gives a straight line staring from the origin.
First order release kinetics (Noyes Whitney’s equation)
According to Noyes Whitney, under standard condition of agitation and temperature, the
dissolution rate process for solids can be described by the equation: dq -Ct) (4.11)
Under sink conditions, i.e., when Ct <0.15cs the equation becomes,
Or, in an integrated form,
Where, q=amount of drug released per unit surface area,
k1= first order release rate constant,
Qo = initial amount
Cs = saturation solubility
Ct = concentration at time t
www.wjpr.net Vol 7, Issue 16, 2018. 1520 Higuchi square root equation
For coated type dosage form, the dissolution medium enters the dosage form in order to the
drug to be released and diffused into the solution. In such cases, often the dissolution follows
the equation proposed by higuchi:
Q = [D€ (2a -€Cs) CST / τ] 0.5 (4.14) Or Q= k нgt 0.5 (4.15)
Or, Mт/m∞= Kнgt1/2 (4.16)
Where, Q = amount of drug released per unit surface area
€ = Porosity of the matrix τ = Tortuosity of the matrix
Kнg = Higuchi release rate constant
Cs = saturation of the drug in the surrounding liquid
A = concentration of the drug in the matrix, t = time.
A plot of cumulative % release v/s square root of the time is plotted to represent a Higuchi
release kinetics (higuchi et al., 1963)
Korsmeyer- peppas model (power law) (koresmeyer et al., 1983)
The power law describes the drug release from the polymeric system in which release
deviates from Fickian diffusion, as expressed in following equation:
Mt/m∞ = k tⁿ (4.17)
Log [mt/m∞] = log k+n log t (4.18)
Where, Mt and m∞ are cumulative amounts of drug release at time t and infinite time. K is
the constant, and n is a diffusional release exponent indicative of the mechanism of drug
release for dissolution.
A plot of log [Mt/M∞] Vs log t will be liner with slope of n and intercept gives the value of
log k.
Antilog of log k gives the value of k. Peppas used the n value in order to characterize
different release mechanisms as shown in result and discussion.
Table 5.5. Diffusion exponent and solute release mechanism. 0.45
0.45<n<0.89 0.89
n>0.89
Fickian diffusion
Anomalous(non firkin)diffusion Case –II transport
www.wjpr.net Vol 7, Issue 16, 2018. 1521 5.10. Accelerated stability studies of prepared Leflunomide tablets
The tablets from the selected Bach are kept at 4.5.c temperature and 7.5% relative humidity
for a period of 3 months for accelerated stability study. The selected batches are kept in the
humidity chamber (Thermo lab. India) maintaining the required temperature and humidity.
After 3 months samples are taken for in vitro dissolution analysis.
6. RESULTS AND DISCUSSIONS
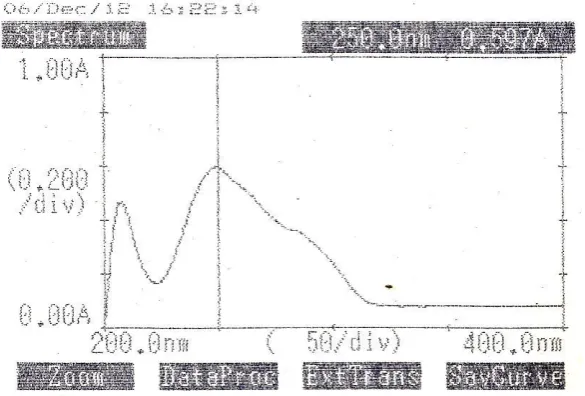
6.1 Determination of max of Leflunomode
Determination of max of Leflunomide chapter -4 (section -5.3.A.) scan report is shown in
figure -6.1. It was found that leflunomide had maximum UV absorption at 250 nm in
phosphate buffer (pH 7.4) respectively.
Figure 6.1. max of leflunomide in phosphate buffer (pH7.4).
6.2. Preparation of standard curve of Leflunomide
Standard curve of Leflunomide was prepared by taking different known serial concentration
of Leflunomide solution and measuring the absorbance as per described in the chapter -4. The
result in given below in the table no -6.2. The carve is given in the following page.
Table 6.2. Standard Curve of Leflunomide in phosphate buffer(pH7.4). Serial No. Concentration (mcg/ml) Absorbance
1 5 0.143
2 10 0.342
3 15 0.5961
4 20 0.787
[image:14.595.154.447.320.518.2]www.wjpr.net Vol 7, Issue 16, 2018. 1522 Figure 6.2. Standard curve for Leflunomide in phosphate buffer (pH 7.4) solution.
The standard carve figure -6.2 drawn as per table -6.2, has shown acceptable regression value
(R² =0.986).
6.3. Compatibility study of Leflunomide with Excipients. A) DSC for compatibility study of Leflunomide
DSC provides information about the physical properties of samples as crystalline or
amorphous nature and demonstrates a possible interaction between drug and polymer
information. According to the thermograms, Leflunomide presented a sharp endothermic
peak at 166.69˚C and Leflunomide, Guar gum and HPMC presented a sharp peak at 165.56˚C
corresponding to the melting points of the drug in the amorphous forms. The was detected for
the interaction study further accomplices with FTIR study. The thermo gram as shown figure
-6.3(a,b&c).
[image:15.595.114.479.540.735.2]www.wjpr.net Vol 7, Issue 16, 2018. 1523 Figure 6.3(b) DSC Spectra of Leflunomide and Guar gum.
Figure 6.3(c) DSC Spectra of Leflunomide, Guar gum and HPMC.
B) FTIR spectroscopy for compatibility study of Leflunomide
The drug polymer compatibility was ascertained by subjecting the drug with HPMC K100M,
Guar gum to Infrared Spectrophotometer study. The spectrum is given in the figure--. It has
been observed that the absorption bend of both pure drug and drug with polymer mixture was
same.So it was concluded that no such interaction between the active medicament and
polymer was it was concluded that no such interaction between the active medicament and
polymer.
[image:16.595.161.437.596.740.2]www.wjpr.net Vol 7, Issue 16, 2018. 1524 Figure 6.4(b) FTIR Spectra of Leflunomide and HPMC.
Figure 6.4(c) FTIR Spectra of Leflunomide Guar gum.
6.4. Experimental Evaluations
6.4.1. Evaluation of Micromeritic properties of Leflunomide granules
To maintain nature of granules under control the physical properties were evaluated. To
prevent the adhesion of the granules, it kept in dry trays and moisture content was found to be
22° - 32°, it show that the flow ability was good and further to describe the granules the bulk
density, tapped density, Carr‘s index, It answer ratio were calculated (table -6.4.).
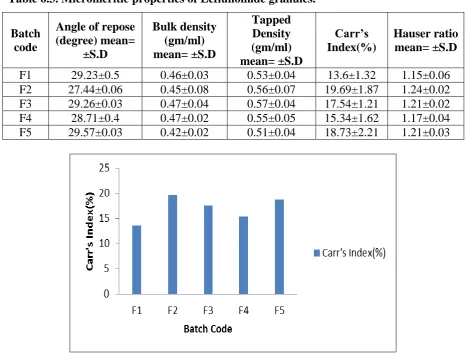
Granules of different formulation were evaluated for angle of repose. The results of angle of
repose (<30°) indicates good flow properties of granules (Martin, 2001). It was further
supported by compressibility (or Carr‘s index) values given in table -6.4. Carr‘s index value
up to 15% results in good to excellent flow properties (Aulton satisfactory flow properties
www.wjpr.net Vol 7, Issue 16, 2018. 1525 Table 6.3. Micromeritic properties of Leflunomide granules.
Batch code
Angle of repose (degree) mean=
±S.D
Bulk density (gm/ml) mean= ±S.D
Tapped Density (gm/ml) mean= ±S.D
Carr’s Index(%)
Hauser ratio mean= ±S.D
F1 29.23±0.5 0.46±0.03 0.53±0.04 13.6±1.32 1.15±0.06 F2 27.44±0.06 0.45±0.08 0.56±0.07 19.69±1.87 1.24±0.02 F3 29.26±0.03 0.47±0.04 0.57±0.04 17.54±1.21 1.21±0.02 F4 28.71±0.4 0.47±0.02 0.55±0.05 15.34±1.62 1.17±0.04 F5 29.57±0.03 0.42±0.02 0.51±0.04 18.73±2.21 1.21±0.03
Figure 6.5. Micromeritic properties of Leflunomide granules.
6.4.2. Thickness of Luflunomide tables.
The thickness was measured by using slide calipers. The thickness should within ± 5%
[image:18.595.64.534.85.444.2]variation of standard value. All thickness was measured by venire caliper (Asahi, India).
Table 6.4.Results of thickness measurement of Leflunomide tablets. Batch code Average thickness (mm) S.D (n=5)
F1 3.57 0.01
F2 3.52 0.02
F3 3.70 0.05
F4 3.66 0.02
F5 3.85 0.02
Average thickness of each batch of Leflunomide tablets were measured and the results of
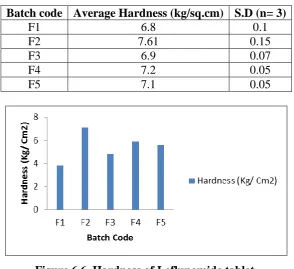
www.wjpr.net Vol 7, Issue 16, 2018. 1526 6.4.3. Hardness of Leflunomide tablets
Hardness of tablets is 3.8 to7.1kg/sq.cm in all batches. Hardness of tablets in all force required to break a tablet in the diametric compression test. This can affect the drug
dissolution and consequently the drug release. Hardness of a tablet depends up on
compression force, proportion of binder etc.
Tablet 6.5. Results of Hardness of Leflunomide tablets.
Batch code Average Hardness (kg/sq.cm) S.D (n= 3)
F1 6.8 0.1
F2 7.61 0.15
F3 6.9 0.07
F4 7.2 0.05
[image:19.595.151.446.209.478.2]F5 7.1 0.05
Figure 6.6. Hardness of Leflunomide tablet.
6.4.4. Weight Variation of Leflunomide tablets
For each batch 6 tablets were selected randomly and their average weight was determined
weight of the individual tablet was also determined. The details method of weight variation
test is given the chapter -4.
Tablet 6.5. Results of Hardness of Leflunomide tablets.
Batch code Average weights (mg) ±SD (n=6)
F1 290.93±1.58 ±1.25
F2 300.28±2.1 ±2.04
F3 290.29±1.49 ±1070
F4 310.00±1.96 ±2.10
F5 300.42±1.06 ±1.67
The above table shows the result of the weight variation test of each batch of formulation.
www.wjpr.net Vol 7, Issue 16, 2018. 1527 more than 250 mg is ± 5%. The results shows that the weight variation comes within the
official specification.
6.4.5. Friability of Leflunomide tablets
The friability of tablets was determined by Roche friability. The details methods as described
in the chapter -4 and the results are shown in the table -6.7.
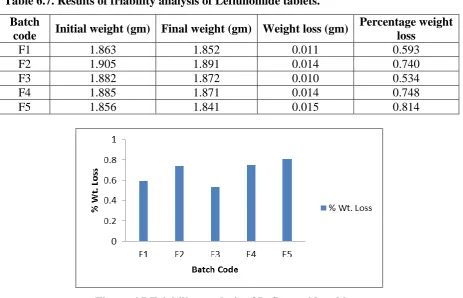
Table 6.7. Results of friability analysis of Leflunomide tablets. Batch
code Initial weight (gm) Final weight (gm) Weight loss (gm)
Percentage weight loss
F1 1.863 1.852 0.011 0.593
F2 1.905 1.891 0.014 0.740
F3 1.882 1.872 0.010 0.534
F4 1.885 1.871 0.014 0.748
[image:20.595.68.532.214.512.2]F5 1.856 1.841 0.015 0.814
Figure 6.7 Friability analysis of Leflunomide tablets.
The friability(0.534to0.814) of all formulation are complaint with official friability
specification which allow not more than 1% of mass on 6 tablets. Convention compressed
tablet that loss less than 1% of their weight are generally considered acceptable. In the
present study, the percentage friability for all the tablets for all the formulations are below
1%, indicating that the friability is within the prescribed limits.
6.4.6. Disintegration Profil of Leflunomide tablets.
In vitro disintegration time (DT) was determined using a disintegration test apparatus (Excel,
India). This test was carried out at 37°c ± 2°c in 900 ml of phosphate buffer (pH 7.4)
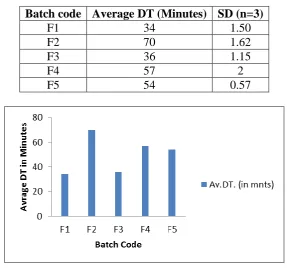
www.wjpr.net Vol 7, Issue 16, 2018. 1528 Table 6.8.Results of Desintegration profile of Leflunomide tablets.
Batch code Average DT (Minutes) SD (n=3)
F1 34 1.50
F2 70 1.62
F3 36 1.15
F4 57 2
F5 54 0.57
Figure 6.8 Desintegration profile of Leflunomide tablets.
The above table show that the result of the disintegration test of tablets of each batch of
formulation. The disintegration time of the tablets varied from -34 to -70minutes.
6.4.7. Content Uniformity of Leflunomide tablets
All batch of formulation are assayed for content uniformity as per the method described in
chapter -4. The results of the test are stated in table TABLE-6.11 Results of Leflunomide
[image:21.595.153.441.91.359.2]content in each batch of formulation.
Table 6.9. Results for uniformity of Leflunomide tablets.
Batch code Average Drug content (mg)
Theoretical Drug
content % ±SD (n= 4)
F1 20 99.52 ±0.54
F2 20 99.80 ±0.76
F3 20 99.95 ±0.63
F4 20 100.02 ±1.36
F5 20 99.77 ±0.97
The above table shows the result of content uniformity test of tablets of each set formulation.
These are determined following IP 1996 (vol. II). The quantity of drug in each batch of tablet
should not be less than 98% and more than 101%. All drug content in formulation remain
www.wjpr.net Vol 7, Issue 16, 2018. 1529 6.5. SCANNING ELECTRON MICROSCOPY (SEM)
6.5.1. SEM of drug and Polymer
The surface morphology changes after dissolution were studied using SEM, and the
instrumental conditions were described in the chapter-4. The samples were collected from
dissolution studies at specific time interval and scanned under SEM. From the observation of
all samples, the erosion was held on the samples surfaces which is directly proportional to
time of sampling. A gel formation also found. All these these observations were recorded as
photograph at 500X and X100K magnification. showing-6.9.(a,b,c,d).
Figure 6.9.(a) The surface morphology of sample at 0 minutes.
Figure 6.9.(b) The surface morphology of sample at 10 minutes.
[image:22.595.178.421.255.385.2] [image:22.595.177.421.429.554.2] [image:22.595.175.425.597.726.2]www.wjpr.net Vol 7, Issue 16, 2018. 1530 Figure 6.9.(d) The surface morphology of sample at 30 minutes.
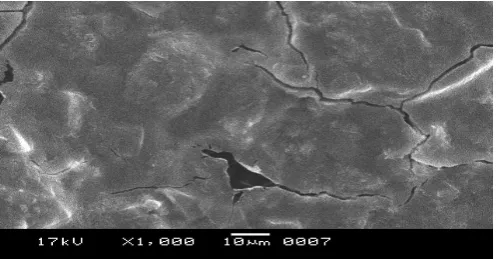
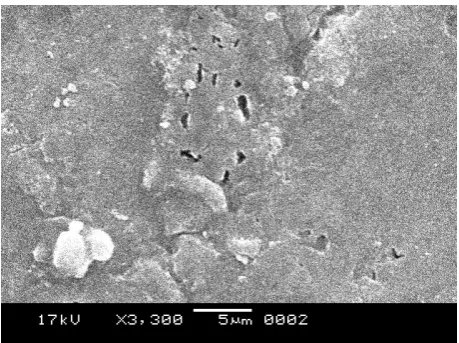
6.5.2 Surface Topography of tablet by SEM
The both surfaces of the tablet (outer surface & inner surface) were coated with
gold-palladium alloy using fine coat ion- sputter(Hitachi, E-1010) and examined at 17.0KvX1000
&17.0KvX3,000 &17.0KVX600&17.0KvX330 and with little edge of 45degree centigrade.
The coated samples were subsequently analysed under emission. SEM(Hitachi,S-3400N).
From the observation, it was that the tablets were well compacted, intact less porous and
[image:23.595.181.412.76.197.2] [image:23.595.186.410.396.528.2]fractured surface contained less of loose particle, shown figure-6.10(a,b,c,d).
Figure 6.10.(a) The outer surface of tablet.
[image:23.595.183.413.568.739.2]www.wjpr.net Vol 7, Issue 16, 2018. 1531 Figure 6.10.(c) The inner surface of tablet.
Figuer 6.10.(d) The fractured surface of tablet.
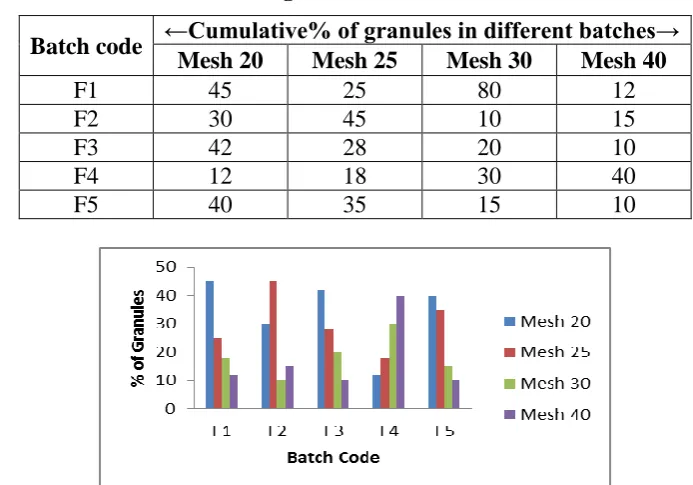
[image:24.595.120.467.500.742.2]6.6. Distribution of granules
Table 6.10. Results of distribution of granules in different meshes.
Batch code ←Cumulative% of granules in different batches→ Mesh 20 Mesh 25 Mesh 30 Mesh 40
F1 45 25 80 12
F2 30 45 10 15
F3 42 28 20 10
F4 12 18 30 40
F5 40 35 15 10
www.wjpr.net Vol 7, Issue 16, 2018. 1532 6.6.1. Friability of Leflunomide tablets
The friability of tablets was determined by Roche friability. The details methods as described
[image:25.595.67.531.164.443.2]in the chapter -4 and the results are shown in the table -6.9.
Table 6.11. Results of friability analysis of Leflunomide tablets.
Figure 6.12. Friability analysis of Leflunomide tablets.
The friability (0.534 to 0.814) of all formulation are complaint with official friability
specification which allow not more than 1% of mass on 6 tablets. Convention compressed
tablet that loss less than 1% of their weight are generally considered acceptable. In the
present study, the percentage friability for all the tablets for all the formulations are below
1%, indicating that the friability is within the prescribed limits.
6.6.2. Disintegration Profil of Leflunomide tablets.
In vitro disintegration time (DT) was determined using a disintegration test apparatus (Excel,
India). This test was carried out at 37°c ± 2°c in 900 ml of phosphate buffer (pH 7.4)
solution. Batch code
Initial weight (gm)
Final weight (gm)
Weight loss (gm)
Percentage weight loss
F1 1.863 1.852 0.011 0.593
F2 1.905 1.891 0.014 0.740
F3 1.882 1.872 0.010 0.534
F4 1.885 1.871 0.014 0.748
www.wjpr.net Vol 7, Issue 16, 2018. 1533 Table 6.12. Results of Desintegration profile of Leflunomide tablets.
Batch code Average DT (Minutes) SD (n=3)
F1 34 1.50
F2 70 1.62
F3 36 1.15
F4 57 2
F5 54 0.57
Figure 6.13 Desintegration profile of Leflunomide tablets.
The above table show that the result of the disintegration test of tablets of each batch of
formulation. The disintegration time of the tablets varied from -34 to -70minutes.
6.6.3. Content Uniformity of Leflunomide tablets
All batch of formulation are assayed for content uniformity as per the method described in
chapter -4. The results of the test are stated in table TABLE-6.11 Results of Leflunomide
[image:26.595.157.440.88.353.2]content in each batch of formulation.
Table 6.13. Results for uniformity of Leflunomide tablets.
Batch code Average Drug content (mg) Theoretical Drug content % ±SD (n= 4)
F1 20 99.52 ±0.54
F2 20 99.80 ±0.76
F3 20 99.95 ±0.63
F4 20 100.02 ±1.36
F5 20 99.77 ±0.97
The above table shows the result of content uniformity test of tablets of each set formulation.
These are determined following IP 1996 (vol. II). The quantity of drug in each batch of tablet
should not be less than 98% and more than 101%. All drug content in formulation remain
www.wjpr.net Vol 7, Issue 16, 2018. 1534 6.7. In- Vitro Drug Release Profile
Leflunomide tablets was determined using USP standard dissolution apparatus (paddle type)
as describe in chapter -4. The cumulative percentage of drug release time were tabulated in
table -6.14. and the graph of release profile was shown figure 6.14.
Table 6.14. In vitro-release of Leflunomide tablet against time.
Time in minutes
---Cumulative % of drug release---
F1 F2 F3 F4 F5 M
0 0 0 0 0 0 0
10 47.01 60.23 72.33 69.51 68.55 65.91
20 53.37 65.22 74.44 77.91 78.51 75.58
[image:27.595.69.533.186.500.2]30 60.99 88.37 89.31 94.48 94.88 88.05
Figure 6.14 In vitro-release of Leflunomide tablet against time.
6.7.1. Drug release kinetics of Leflunomide tablet formulation
To study the mechanism of release of Leflunomide forms matrix tablet, the release kinetic
has to be followed. Here four types of release kinetic for Leflunomide tablet are considered to
find out the best fit kinetic of release. These are zero order, first order, Higuchi model and
Poppas model. The release constant was calculated from the stop of the appropriate plots and
the regression co-efficient / correlation coefficient (R²) was determined (table -6.14.).
The zero – order rate (equation q=kot, where ―q‖ is cumulative % release, ―k0‖ is zero-order release rate constant, ―t‖ is time) describe the system where the drug release rate is
independent of its concentration. Figure-6.14 show the cumulative amount of drug release Vs
www.wjpr.net Vol 7, Issue 16, 2018. 1535 Table 6.1 Zero-order release of Leflunomide tablets against time.
Time in minutes
---Cumulative % of drug release---
F1 F2 F3 F4 F5 M
0 0 0 0 0 0 0
10 47.01 60.23 72.33 69.51 68.55 65.91
20 53.37 65.22 74.44 77.91 78.51 75.58
[image:28.595.74.523.82.408.2] [image:28.595.153.444.419.595.2]30 60.99 88.37 89.31 94.48 94.88 88.05
Figure 6.15 In-vitro release of Leflunomide against time.
www.wjpr.net Vol 7, Issue 16, 2018. 1536 Figure 6.15(b) Zero-order release kinetics of formulation F-2.
Figure 6.15(c) Zero-order release kinetics of formulation F-3.
[image:29.595.143.454.75.266.2] [image:29.595.143.451.306.477.2] [image:29.595.142.454.517.682.2]www.wjpr.net Vol 7, Issue 16, 2018. 1537 Figure 6.15(e) Zero-order release kinetics of formulation F-5.
Figure 6.15(f) Zero-order release kinetics of formulation M.
The first order (In qₒ / q₂ = k₁t) rate describes the release from system where the release rate is independent of its concentration figure -6.15. show the log cumulative % release Vs time.
Table 6.15. The first order release kinetic of Leflunomide tablet.
1st order ← Log cumulative % of drug Release →
Time (mnts) F1 F2 F3 F4 F5
0 0 0 0 0 0
[image:30.595.146.451.75.244.2] [image:30.595.145.451.285.469.2]www.wjpr.net Vol 7, Issue 16, 2018. 1538 Figure 6.15 In vitro-release of Leflunomide tablets against time.
Higuchis model ( Q = KHGt ½, k is constant reflecting the design veriable of the system and t is the time in hours) described the release of drugs from an insolute matrix as a square root of
a time dependent process based on Fickian diffusion. Figure - Table-6.13. Describes the
Higuchis square root kinetics, showing the cumutative % release Vs square root of time.
Table 6.16. Higuchi’s square root of Leflunomide tablets.
Sq. RT ←Cumulative % of drug release→
F1 F2 F3 F4 F5
0 0 0 0 0 0
3.16 22.72 16.60 18.35 20.97 21.50 4.47 35.83 39.09 40.49 34.09 36.71 5.47 56.81 50.69 58.56 48.95 51.57 6.32 79.54 63.81 77.79 69.05 61.18 7.07 89.16 78.67 82.16 85.66 77.79 7.74 98.95 86.53 89.16 98.07 98.77
[image:31.595.160.440.399.724.2]www.wjpr.net Vol 7, Issue 16, 2018. 1539 Korsmeyer- peppas model (power law) (Kors – meyer et. Al. 1983)
The power law descrines the drug release from the polymeric system in which release
deviatis from Fickian diffusion as expressed in following equation
Mt / M∞ = Kt ⁿ
Log [Mt / M∞] = Log K + n Log t
When Mt and M∞ are cumulative amount of drug release at time ―t‖ and infinite time is the
constant and ―n‖ is a diffusion release exponent indicative of the mechanism of drug release
dissolution Figure—and Table:6.14.
Describe the korsmeyer – peppas model (power law), showing log cumulative % release Vs
Log of time.
Log of time in minutes ←Log Cumulative % of drug release→
F1 F2 F3 F4 F5
0 0 0 0 0 0
[image:32.595.126.471.296.653.2]1 1.356 1.220 1.263 1.321 1.332 1.30 1.554 1.532 1.607 1.532 1.564 1.47 1.754 1.704 1.767 1.689 1.712 1.60 1.900 1.804 1.890 1.839 1.786 1.69 1.950 1.895 1.914 1.932 1.890 1.77 1.995 1.937 1.950 1.991 1.994
www.wjpr.net Vol 7, Issue 16, 2018. 1540 6.7.2. Correlation Coefficient Value (R²) for different in vitro release kinetic for Leflunomide from formulation
Table 6.18
Batch code ←R² value of different rate kinetics→
Zero order 1st order Higuchi Korsmer – peppas
F1 0.983 0.685 0.938 0.987
F2 0.990 0.708 0.942 0.994
F3 0.958 0.677 0.951 0.988
F4 0.996 0.703 0.923 0.990
F5 0.999 0.683 0.928 0.986
The release kineties of 6 batches of formulation was studied and plotted as describe above.
The correlation co-efficient (R²) for different in-vitro release kinetic is tabulated above. For
the above said data, it is observed that the correlation co-efficient (R²) values are ranged from
0.958 to 0.996, 0.677 to 0.708,0.928 to 0.923 and 0.951,0.986 to 0.994 zero order, first order, Higuchi‘s and korsmer peppas respectively.
6.7.3. Accelerated stability study of tablet containing Leflunomide tablet
The accelerated stability study of the final tablets was performed according to the procedure
describe in chapter -4. The results are shown in table -6.16. It is revalued that the formulation
remained stable at 40°c / 75% RH upto three months.
Table 6.19. Results of stability study for of Leflunomide tablets.
Sl. No. Parameters Standards Initial 40°c & 75% RH R.T
1 month 2 months 3months 3 months
1 Description
Round, biconvex, white color
tablet
Complies Complies Complies Complies Complies
2 Average wt.
(mg) 300.00 229.89 300.33 300.90 229.54 229.53
3 Dissolution
Leflunomide 10 – 30% in
1st hour 19.73% 18.98% 18.77% 19.01% 19.58%
4 Assay
Leflunomide
90 – 110% of label
claim
99.90% 99.22% 98.70% 98.95% 98.75%
www.wjpr.net Vol 7, Issue 16, 2018. 1541 7. REFERENCES
1. Chien Y.M. In Novel Drug Delivery System, 2nd edition, Swarbrick, J. Ed, Marcel
Dekker, New York, 1992; 139.
2. Brahmankar D.N. & Jaiswal Sunil B, Bio pharmaecuties & pharmacokinities 12th edition,
vellor prakashan, 2008; 352-353, 357-358.
3. Bandhopadhay A.K, Novel Drug Delivery System, 5th edition New Gyam publisher, 67,
2004; 32.
4. Kirk JH Danna SE Biotechford CG, Lactose a definitive guide to polymorph
determination Internal Journal of Pharmaceutics, 2007; 334: 103-114.
5. Bolluis GK et al, Film formulation in mixing by magnesium state and its effect in
tableting Pharmaceutics Weekblad, 1975; 110: 317-325.
6. Crang, R.k., Robinson, J.R., Drug release from tablets and particles through coating. In
Theory and practice of Industrial pharmacy, 3rd Edition volume-3.
7. Ghosh, S. Amd Barik, B.B, Preparation and evaluation of leflunomide tablet formulation
and comparison of formulated and market product, International Journal of Medicine and
Medical Sciences sep., 2009; 1: 375 – 382.
8. Higuchi T, Mechanism of action medication; Theoretical analysis of release of solid
drugs dispersed in solid, J. Pharm. Science, 52(1963): 1145 – 1149.
9. L. Reddy., B.Ghosh and R.Rajesh ―First Dissolving Drug Delivery Systems; A Review of
the Literature ―Indian Journal of Pharmaceutical sciences 2020; 64(4): 331-336.
10.Technology catalysts International Coporation Report, ―Orally disintegrating tablet and
film Technologies‖ 2005; 3(1).
11.Pradhan, R, Budhathoki, U. Thappa, P. Formulation of once day,tablet based on HPMC –
MANNTOL Kathmandu University. Journal of science, Engineering and Technology,
sep., 2008; 1(5): 55- 67.
12.Ashok Katdare and Mahesh Chaubal- Exicipents Development for Pharmaceutical
Biotechnology and Drug Delivery System, CRC Press 2006,1st Edition 2006; 201-290.
13.Raymood, C., Paul, J.W., Handbook of pharmaceutical excipients. 4th edition,
pharmaceutical press and American pharmaceutical Association, 2004; 125 – 641.
14.Majethia V. Geraei SA Rehmatoid arthrities diagnosis and management. Am, J, Med,
www.wjpr.net Vol 7, Issue 16, 2018. 1542 15.Sarvanan, M., Nataraj, K.S., Ganesh, K.S., Hydroxypropyl methyl cellulose based
Cephalexin extended release tablets; influence of tablet formulation, hardness and storage
on in-vitro release kinetics.‖Chem. Pharm. Bull‖ 2003; 51(8): 978-983.
16.United states of Pharmacopeia 31, official monographs, 2504, 2505.
17.Banker G.S, Anderson N.R. Tablets, In Lachmanl; Liberman H.A. and Kaning; J.L;
Theory and practices of Industrial pharmacy, 3rd edition, Vergheses publishing House
Bombay. 1990; 293 – 345.
18.Liberman, H.A., pharmaceutical dosage forms ―TABLETS‖ second edition, 1: 136.
19.Alderman, D.A., Review of cellulose ethers in hydrophilic matrices for oral crdds, Int. J.
Pharm. Technol. Pod. Mfr, 1984; 5: 1- 9.
20.Aulton, M. Wells, I.T., Pharmaceutics: The science of dosage from design churchill
Livingstone, London, England, 1988; 4.
21.Chang, R.K., Robinson, J.R., Leflunomide tablets and pertocles through coating. In
pharmaceutical dosage from : tablet And 3. 2nd edition by Liberman, H.A., Lachman, 1.,
Varghese Publishing House, Mumbai 2: 1991.
22.Robertson Ml. Regulatory issues with excipients. Ins J. Pharm., 1999; 187: 293-276.
23.Bherdwajl, S., Jain, V,. Jat,. R.C., Mangal, a,. Jain. S., evaluation of fast dissolving tablet
of leflunomide,‖ International Journal of drug delivery, 2010; 2: 93-97.
24.Swarbrick, J.; Encyclopedia of pharmaceul Technology, 3rd ed., Informa Healthcare USA,
Inc., North Carolinia, USA, 2007; 4: 2328 – 2329.
25.Vyas, S.P.; Khar, R.K.; Targeted & Controlled Drug Delivery Novel Carrier System, 1st
ed., CBS Publisher, New Delhi, 2002; 429 – 420.
26.Wurster, D.E.; US Patent 1949; 2: 648,609.
27.Wurster, D.E.; Am. J. Pharm. Assoc. Sci Ed. 1959; 48: 451 – 454.
28.Martin, A., Physical Pharmacy, Lippincott Wilkins, Baltimore, 2001; 423.
29.Landre-Beauvais AJ La goutte asthenique primitive (doctoral thesis).reproduced in
Landre-Beauvais AJ (March 2001).‖ The first description of Rheumatoid arthritis
Unabridge text of the doctoral dissertation presented in 1800. Joint bone Spine 68(2):
130- 43Aulton “Pharmaceutics the sciences of dosage Form Design‖ 2nd Edition, 2002;
398.
30.Lachman, L. and Liberman, H. A; “Theory and industrial pharmacy practice of‖. 3rd Edition, 1990; 293-298.
www.wjpr.net Vol 7, Issue 16, 2018. 1543 32.Lachman Leon, Liberman H.A and Kanig J L, ―The theory and practice of industrial
pharmacy ―(3dr edition), Vergheses publishing House Bombay, 443- 453, 171.
33.Bankar G.S, Anderson N.R, Tablets, In; Lachman L.; Liberman H.A. and kaning; J.L;
Theory and practices of industrial pharmacy ―(3dr edition), Vergheses publishing House
Bombay, 1990; 293- 345.
34.United States of Pharmacopeia, 31, Official monographs, 2504.
35.United States of Pharmacopeia, 31, Official monographs, 2505.
36.ICH harmonized tripartite guidelines, stability testing of new drug substances and
products, 2003.
37.Rowe Raymond C., Sheskey Paul J., Cowen Sian, Hand book of Pharmaceutical
Excipients,5th edition, Royan Pharmaceutical socity of GB, London 2001; 334.
38.Tripathi KD., Essential of Medical Pharmacology'4th edition, Jaypee Bros, New Delhi,
Pharmacology of Rheumatoid arthritis, 1999; 300.
39.Kshirsagar N.A., Indian Journal of Pharmacology, 32: 3.
40.Journal of the Royal Statistical Society, series C, Applied statistics, 2007.
41.Hydroxlpropyl Methylcellulose, National Organic standards Board Technical Advisory
Panel Review,1-4, 2002.
42.Indian Pharmacopoeia, vol-1,2nd edition,Controller of Publication, Govt. Of India 1996;
256-257.
43.Pranab Kumar Banerjee ‗‘Introduction to Biostatistics, Published by S.Chandra 14.
44.John Langridge Ph D., DFE Pharma Germany, Pharmaceutical Lactose; Making The