E & G
Quaternary Science JournalVolume 60 / Number 1 / 2011 / 27–46 / DOI 10.3285/eg.60.1.02 www.quaternary-science.net
GEOZON SCIENCE MEDIA ISSN 0424-7116
Spatial analysis of loess and loess-like sediments in the Weser- Aller catchment (Lower Saxony and Northern Hesse, NW Germany)
Bianca Wagner
Abstract: A spatial compilation and visualization of loess parameters was carried out for the Pleistocene loess and loess-like sediments in the Weser-Aller catchment (southern Lower Saxony and northern Hesse, NW Germany), one of the loess regions of Central Europe. As far as available, data about main loess characteristics like thickness, granulometry and stratigraphy were combined for the first time with spatial information extracted from maps. Data storage and analysis in a geographical information system (GIS) permitted creation of large-scale thematic loess maps.
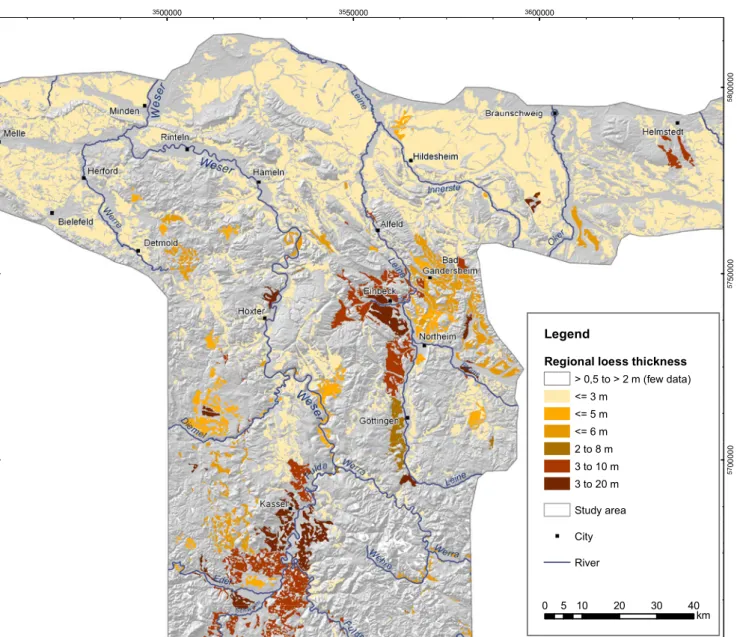
The loess thickness map displays an increase of the thickness in valleys and basins and from north to south. The granulometry map presents main granulometrical facies types of the loess cover. Furthermore, several loess locations with unusual thickness were identified and their special geological and geomorphological conditions are discussed.
In summary, the loessic sediments in the northern part of the study area are of Upper Weichselian age, whereas in the south- ern upland regions incomplete or detailed Weichselian loess sequences were identified. In conclusion, highly detailed maps of regional loess-property patterns can be created even if only heterogeneous historically published data are taken into account.
[Räumliche Analyse von Lössen und löss-ähnlichen Sedimenten im Weser-Aller-Einzugsgebiet (Süd-Niedersachsen und Nord-Hessen, NW-Deutschland)]
Kurzfassung: Eine räumliche Kompilation und Darstellung von Löss-Parametern wurde für die pleistozänen Lösse und löss-ähnlichen Sedi- mente im Weser-Aller-Einzugsgebiet (Süd-Niedersachsen und Nordhessen, NW-Deutschland), einer der Lössregionen in Mit- teleuropa, durchgeführt. Erstmals wurden Daten, soweit verfügbar, über die wichtigsten Lösseigenschaften, wie Mächtigkeit, Granulometrie und Stratigraphie mit räumlichen Informationen von Karten kombiniert und ausgewertet. Die Datenerfassung und – analyse in einem Geographischen Informationssystem (GIS) ermöglichte die Ableitung großformatiger thematischer Lösskarten.
Daten über Lössmächtigkeiten wurden analysiert und zu einer regionalen Mächtigkeitskarte kompiliert. Zusätzlich dazu wurden zahlreiche Lössvorkommen mit anormaler Mächtigkeit aufgrund spezieller geologischer und geomorphologischer Bedingun- gen abgegrenzt. Mehrere Lössregionen mit unterschiedlicher granulometrischer Fazies wurden ausgeschieden. Zudem konnten regionale Lössdecken unterschiedlichen Alters kartiert werden. Die Lössdecken im nördlichen Teil des Untersuchungsgebietes haben jungweichselzeitliches Alter, dagegen wurden im Bergland Regionen mit unvollständigen und gut gegliederten weich- selzeitlichen Lössabfolgen nachgewiesen. Die Ergebnisse der Untersuchung zeigen, dass auf der Grundlage veröffentlichter, heterogener Daten neue Aspekte und regionale Muster abgeleitet werden können.
Keywords: loess, loess-like deposits, Pleistocene, Weichselian, spatial analysis, NW Germany
Address of author: B. Wagner, Department of Applied Geology, Geoscience Centre Göttingen, University of Göttingen, Goldschmidtstr. D-37077 Göt- tingen, Germany. E-Mail: [email protected]
1 Introduction
Loess and loess related sediments cover wide parts of Eu- rope. In North-Western and Central Europe they form a continuous loess belt, trending roughly in ESE-WNW di- rection. The belt is limited by a northern and southern boundary (Haase et al. 2007). In Germany, the northern boundary of the loess belt runs north of the Rhenish Mas- sif, the Harz Mountains and the Ore Mountains and sepa- rates the loess and loess-like sediments from cover sands and drift sands (Eissmann 2002, Haase et al. 2007). Five main loess regions adjoin to the northern boundary. These are from west to east the lower Rhine area, southern parts of the Weser-Aller catchment (southern Lower Saxony and northern Hesse), the loess region northeast of the Harz Mountains (Saxony-Anhalt) and the loess region north of the Ore Mountains (Saxony).
The loess and loess related sediments in the Weser-Aller catchment were the subject of many mapping campaigns and studies. Grupe (1916a) and Seltzer (1936a, 1936b) rec- ognized different layers, paleosols and ice-wedge pseudo- morphs in the loess outcrops and tried to distinguish loes- sic sediments of different ages. Schönhals, Rohdenburg
& Semmel (1964) published a detailed stratigraphy of the loesses in Hesse that is based on paleosols and tephra.
Rohdenburg & Meyer (1966) extended the Eemian and Weichselian part of the pedostratigraphy to southern Low- er Saxony and northern Hesse. Rohdenburg (1966) added ice-wedge pseudomorphs. Subsequently, new facies types (Breinum soil, Hattorf soil, Alversdorf soil) of the Middle Weichselian Lohne soil were described by Bartels & Ro- hdenburg (1968), Ricken & Meyer (1982), Ricken (1983) and Brosche & Walther (1978, 1991).
Ricken & Grüger (1988) verified the age of the oldest palaeosols based on a transition between dated lake sedi- ments and paleosols of Eemian and Early Weichselian age.
Roeschmann et al. (1982) published a compiled overview of the paleosols in Lower Saxony and Bremen. This loess stratigraphy was proven and correlated with other regions (e.g. Ricken 1983).
In the following years scientists mapped and published a lot of detailed individual loess sections or outcrops in smaller areas based on the above mentioned pedostratig- raphy. Brosche & Walther (1978) examined and corre- lated sections in the brown-coal opencast pits near the northern loess boundary. Jauhiainen & Brunotte (1978), Schwartau (1978, 1979) and Brunotte & Jauhiainen (1979) described a complete Upper Weichselian section in the Leine valley. Ricken & Meyer (1982) and Ricken (1983) studied the loess cover and paleosols in the Southwest Harz Foreland and the Eichsfeld.
In northern Hesse Jacobshagen, Huckriede & Jacob- shagen (1963), Bosinski (1969), Kulick & Semmel (1968) and Bosinski & Kulick (1973) analyzed archeological and paleontological findings in loess sections. Semmel (1967) reported new findings of Eltville tephra in Hesse and he published a summary of the loess sections in Hesse in 1968.
Brosche & Walther (1980) studied loess outcrops in the Weser valley.
Furthermore, some isolated deposits of Lower or Middle Pleistocene age, not included by the pedostratigraphy of
Rohdenburg & Meyer (1966), were examined. Most of the loess remnants survived due to special conditions, e.g. in grabens or subrosive sediment traps. Moreover, they con- tain paleosols or are intercalated with interglacial sedi- ments. Lüttig (1960a), Jordan & Schwartau (1993) and Grüger et al. (1994) investigated such deposits in the Leine valley. Lüttig & Rein (1955), Lüttig (1965) and Bittmann
& Müller (1996) analyzed the interglacial sediments and loesses in the Bilshausen clay pit in the Southwest Harz Foreland. Sabelberg et al. (1976) and Mahaney, Andres &
Barendregt (1993) studied the stratigraphically important Dreihausen paleosol sequence in northern Hesse.
The loess and loess related sediments along the north- ern boundary contain no Eltville tephra and no paleosols of Weichselian age. Therefore, the pedostratigraphical scheme of Rohdenburg & Meyer (1966) can not be ap- plied on these sediments. Gehrt (1989, 1992, 1994) mapped the loess near the boundary between the Leine and Oker valley. He found vertical and horizontal zones of different lithology and age. As a result, he defined a lithostratigra- phy of this marginal facies. Hilgers et al. (2001) carried out luminescence dating in order to establish a chronostratig- raphy for these loess and sandy-loess sediments.
Beside these stratigraphic investigations the authors tried to analyze the spatial properties of loess and to subdivide the loess region into subregions. Wortmann (1942) pub- lished the first loess map of Lower Saxony based on small- scale soil maps displaying sediment lithology and thick-
3500000 3550000 3600000
570000057500005800000
0 5 10 20 30 40
km
200 km Legend
Study area
Geological units Quarternary Tertiary Cretaceous Jurassic Upper Triassic Middle Triassic Lower Triassic Permian Pre-Permian
River
" City
Germany
Study area
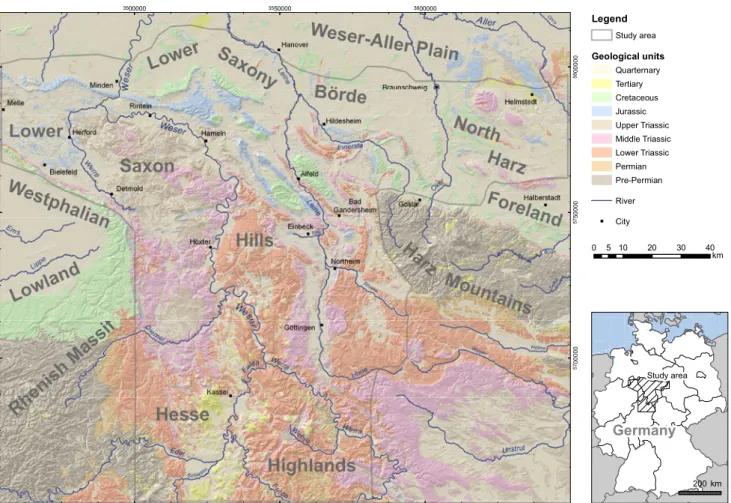
Fig. 1: Outline, main geological units and shaded relief of the study area. (DEM: ASTER GDEM is a product of METI and NASA; river network: Open- StreetMap, published under CC-BY-SA 2.0)
Abb. 1: Umriss, geologische Haupteinheiten und beleuchtetes Geländemodell des Untersuchungsgebietes. (DGM: Globales ASTER-DGM ist ein Produkt von METI und NASA, Flussnetzwerk: OpenStreetMap, veröffentlicht unter CC-BY-SA 2.0)
ness. Merkt (1968) published a new version of a loess dis- tribution map of southern Lower Saxony and adjacent re- gions. In contrast to Wortmann (1942), he exploited small- scale geological maps and unpublished material.
Müller (1961), Niederbudde (1976) and Siebertz (1988) analyzed loess properties (e.g. grain size distribution, min- eral composition) to outline regional zones within the loess cover. Beside this, scientist tried to distinguish regions that show differences in paleosols, lithology or sequences. They aimed to determine climatic differences and trends. For ex- ample, Rohdenburg & Meyer (1966) published outcrop maps, maps of the Lohne soil distribution and described wet and dry loess provinces based on paleosols facies. Fur- thermore, Walther & Brosche (1983) gave an extended compilation of stratigraphical columns including climatic interpretation near the northern loess boundary. Brosche
& Walther (1991) mapped a large number of loess sec- tions in Lower Saxony and north-eastern North Rhine- Westphalia. They provided many details for the regional loess stratigraphy and to the geomorphological periods during the Weichselian. Correlation of loessic, solifluction deposits, fluvial and glaciofluvial sediments in the North Harz Foreland combined with luminescence dating was published by Reinecke (2006).
In spite of the huge dataset only few regional graphical presentations, e.g. location maps, distribution maps, facies maps (Rohdenburg & Meyer 1966, Walther & Brosche 1983, Brosche & Walther 1991), or maps, displaying the dis- tribution of marker horizons like the Lohne soil or the Eltville tephra, were compiled. The available geological or loess maps give only limited information about the third dimension (e.g.
thickness, loess sequences or the age of the loess deposits).
In contrast to the regional overview of the loess properties in Eastern Germany by Eissmann (2002), there is no recent compilation of such data for Northwestern Germany.
The aim of this study is a regional overview of the main loess characteristics (granulometry, thickness and stratig- raphy) in the Weser-Aller catchment which is based on all available descriptive or graphical data. The second objec- tive of the investigation is a spatial analysis of the existing data in order to recognize spatial patterns of regional scale.
The following questions are addressed:
- May spatial information be extracted from published data?
- To which level of spatial and qualitative accuracy can the data be extracted over the extended area?
- Can regional ages of the loess cover be estimated, if there are only few numerical ages available?
2 Background Study area
The study area is located in Northwest Germany covering an area of about 17,800 km² (Fig. 1). It comprises the southern part of the Northwest German Plain and the northern part of the Northwest Central Uplands. The study area is bordered by the Harz Mountains, the Thuringian Basin, the Vogelsberg Mountains, the Rhenish Massif and the Westphalian Low- lands. The rivers Weser and Aller and their tributaries drain wide parts of the study area. The elevation ranges from 30 m a.s.l. in the North to 730 m a.s.l in the South.
The area is subdivided into the northern lowland and the southern mountainous region. The northern part comprises the Weser-Aller Plain, the Lower Saxony Börde and parts of the northern Harz Foreland. The region is covered by ex- tended Pleistocene and Holocene sediments. The underlying Tertiary to Mesozoic sedimentary rocks are exposed in a few ridges or hills only (Fig. 1).
The southern mountainous area is subdivided into the Lower Saxon Hills including Weser and Leine Hills (or Weser-Leine Uplands) and the northern Hesse Highlands.
In the higher parts, ridges or hills with marine to terres- trial sedimentary rocks of Upper Palaeozoic to Tertiary age are exposed. In the South mainly Triassic rocks crop out, whereas to the North mainly Jurassic to Cretaceous rocks are exposed. Weak to strong tectonic overprint of the pre-Quaternary rocks is evidenced by normal faults and grabens, inverse faults, thrusts and folds. The tectonic pat- tern is also influenced and complicated by strong haloki- netic processes like salt movements, salt dissolution, and salt intrusion in relation to the various salt-bearing Per- mian to Mesozoic strata. These processes are still ongoing.
The main tectonic directions, visible in the orientation of the large folds, faults, ridges and valleys are NW-SE, N-S and NE-SW. This complex geology of the pre-Quaternary bedrock results in a heterogeneous, small-scale regional pattern of valleys, hills, basins and grabens. Quaternary sediments were mainly accumulated in the valleys, on slopes and in upland basins or marginal basins.
The distribution of the Pleistocene sediments is charac- terized by three important boundaries (Fig. 2). The north- ern boundary of the loess belt runs along the line Melle – Minden – Hanover – Braunschweig – Helmstedt. It sepa- rates the almost continuous cover of loess and loess-like sediments in the South from regions in the North, where predominantly cover sands and drift sands were deposited.
The southern boundaries of the Elsterian and Saalian gla- ciation cross the study area along a line Rinteln – Alfeld – Seesen – Goslar (Kaltwang 1992). They separate the per- iglacial Pleistocene sediments in the South from the glacial, glaciofluvial, periglacial and fluvial deposits in the North.
The ice-shield of the Weichselian glaciation did not extend to the study area.
Aeolian sediments
The aeolian sediments of the study area can be subdivid- ed by their grain-size distribution into aeolian loess, sand- banded loess, sandy loess, and cover sand (Vierhuff 1967, Weise 1983). In general, the light-coloured, calcareous, un- stratified, loess contains more than 15 % of silt (medium to coarse silt), less than 15 % sand (0,063–2 mm), and clay.
The sandy loess consists of more than 15 % sand and more than 15 % silt (maxima in medium to coarse silt). The sand- banded loess is a stratified mixture of loess and sandy-loess.
During the last century local German names, like “Flottsand”
and “Flottlehm” were used for sandy loess. These terms are not exactly defined and used by different authors for differ- ent aeolian sediments (Wortmann 1942, Siebertz 1982, Sie- bertz 1992). Generally “Flottlehm” is a silt-rich sandy loess and “Flottsand” a sand-rich sandy loess (Gehrt 1994). Cover sand has an even higher sand content.
Apart from these, some more loess-like deposits are rel-
evant, which were originated from loess by different proc- esses. Loamy loess or loess loam is loess which was de- calcified during weathering and soil genesis. Soliflucted reworked loess was generated by downslope movement during gelifluction or solifluction, which results in a mixed, banded or chaotic structure with possible higher amounts of clay, sand, or blocky gravel from over- or underlying material. The colour is strongly influenced by the amount of these contaminants. When aeolian loess is eroded and transported by water, fluvially reworked loess with a stri- ated structure and gravel or sand intercalations will be de- posited.
A special type of aeolian deposition is represented by mixed layers of glacial loam, sand, and silt on top of un- weathered glacial till. Many authors interpret their fine sand and silt content as aeolian relics, reworked and in- corporated in these layers. This “Geschiebedecksand” may have a basal stone layer, fluvial structures and cryoturba- tion features.
Loess regions
The northernmost part of the loess belt investigated com- prises the “Börde” – a loess-rich region between the north- ern loess boundary and the slopes of the Lower Saxon Hills and the Harz Mountains (Fig. 2). The almost flat plain as- cends slightly to the South. It is underlain by thick gla- cial, glacio-fluvial and periglacial sediments. The region is structured only by few ridges or swells of Mesozoic bed- rock (Fig. 1).
The Börde is 6 to 30 km wide in North-South direction and separated by the Weser, Leine, Innerste, and Oker val- leys into different segments: the narrow Lübbecke Löss Börde, the A-shaped Calenberg Löss Börde and the Braun- schweig-Hildesheim-Börde. The Börde zone merges east of Helmstedt into the Magdeburg Börde. The loess accumulat- ed all over the lowland and on most slopes, only dissected by drainage networks.
The Elm-Asse-Helmstedt region east of the Hildesheim- Braunschweig-Börde also borders to the northern bound- ary of the loess belt. This region is characterized by a quite different morphology more similar to the upland dominat- ed by several NW-SE-trending anticlines and synclines of folded Mesozoic to Tertiary sedimentary rocks, where the Elm and the Asse are the largest domes. Due to the un- dulating morphology the loess cover is not continuously, loess is enriched in valleys and slopes, basins and lower ridges (Merkt 1968). According to Wortmann (1942) there is also loess on the higher parts of the slopes, even on the hills and ridges, e.g. parts of the Elm.
Some areas, which are separated from the loess bounda- ry by ridges and small uplands or those located in the Low- er Saxon Hills, have a Börde-like appearance. This includes a huge, extended loess cover and wide, flat areas with smooth or undulating morphology. The loess cover is only dissected by the recent drainage network or influenced by some steeper ridges or slopes. There is the wide region be- tween the Harz Mountains and the anticlines in its foreland and the Ravensburg Hills, a long stripe between the Wie- hen Hills, the Tecklenburg-Osning and the Wehre valley in the easternmost part of the study area.
In contrast, the uplands south of the Calenberg Börde
and the Hildesheim-Braunschweig Börde, the so called Leine Uplands, show a more pronounced morphology which is caused by synclines, anticlines, and thrusts of folded Mesozoic rocks. The Leine Uplands are subdivided by the narrow Leine and Innerste valley into the Calenberg Uplands, Alfeld Uplands and Innerste Uplands. According to Merkt (1968) loess covers the flat regions, the north- eastern and northern slopes and few south-western slopes of the elongated valleys and hills up to 200 to 250 m altitude and is accumulated in some grabens and subrosion-related structures.
The morphology of the above mentioned long and nar- row valleys and basins is quite different from the more ir- regular and diverse loess accumulation sites in the central parts of the upland. The deposition structures of various sizes and shapes occur mainly within plateaus of Triassic sedimentary rocks, which are dissected by several faults and influenced by subrosion activities. The loess was ac- cumulated in the shallow basins, in sinks, tectonic grabens, and mainly on eastern, north-eastern, and northern slopes up to 230 to 270 m altitude, and in drainage features. The higher ridges, hills, and steep slopes are free of loess. The situation is typical for the Lower Eichsfeld Basin, the Uslar Basin, and the Warburg Börde but is also found within the Lippe Upland, the Pyrmont Uplands and Oberwälder Land, and the Waldeck Uplands and Plains.
Apart from these small-scale irregular and shallow loess accumulation structures wide and extended depressions occur within the Uplands. They were filled with Tertiary and Quaternary sediments during long-lasting periods of subsidence caused by tectonic or halokinetic processes.
Loess accumulated within the depressions mainly on the eastern slopes. Large depressions are located in the Leine- Ilme Basin and the West Hessian Depression.
Southwest of the Harz Mountains there are marginal ba- sins with Tertiary fillings and strong subsidence. The ba- sins are smaller and show a small-scale pattern of valleys and ridges. Typical for this type is the triangular South- west Harz Foreland between the Alfeld Uplands and the Harz Mountains. Common subrosion and karst features are related to highly soluble Permian sulphate and carbonate rocks. Loessic sediments cover the plains, the basins, the valleys and the slopes up to 200 to 300 m in elevation.
The main river valleys within the Lower Saxon Hills and the Hesse Highlands are also distinct, morphological traps for loess deposition. They are treated as separate loess re- gions in this study. The valleys of the rivers Weser, Fulda, Werra and Leine are rich in loess compared to the adjacent regions.
The upper Leine valley between Göttingen and Einbeck, South of the Leine-Ilme Basin, is mainly influenced by the complex structure of the N-S-striking Leine valley Graben.
The wide valley with the distinct, fault-related slopes has a closed loess cover, quite different from the adjacent hills.
The valleys of the rivers Fulda, Werra and Werre in the Southeast of the study area follow tectonic structures in a small-scale pattern of NW-SE-trending faults and fractures.
The loess accumulated in the narrow and steep valleys, es- pecially on the western or north-western side up to 250 m in elevation. The bedrock consists of Lower Triassic sand- stones and subordinate Paleozoic rocks.
The upper Weser flows in a narrow, meandering valley deeply incised in Lower Triassic sandstone through the so- called Upper Weser Uplands. North of Hameln the river flows in a NW-SE-trending valley through Middle to Up- per Triassic and Jurassic to Cretaceous rocks of the Lower Weser Uplands. The river leaves the Lower Saxony Hills through Porta Westphalica and enters the loess Börde of the Northwest German Plain. Along the river loess was mapped on the valley slopes on one or both sides, favour- ably on northeast-, north- and east-facing sides up to 200 to 300 m altitude. Graupner (1970) and Brosche & Walther (1991) already noted that the region south of Hameln is richer in loess. Single loess deposits were mapped in aban- doned lobes, incoming valleys, or subrosive sinks. With increasing distance from the main valley the loess cover thins out and is only found in some patches. Wortmann (1942) mapped some parts of the Weser valley. His loess patches are a bit larger and more connected than on the other maps.
N o r t h e rn bo u n d a r y
o f W
e i ch s e l ia n l o e s s b e l t
3500000 3550000 3600000
570000057500005800000
0 5 10 20 30 40
km Legend
Aeolian sediments Cover sand and dunes Sandy loess and-banded loess Loess and loamy loess
Quaternary boundaries Boundary of Weichselian loess Saalian maximum ice advance Elsterian maximum ice advance
Study area
River
" City
Loess stratigraphy
The loess stratigraphy of the study area comprises Upper Pleistocene loessic sediments and paleosols (Tab. 1). The stratigraphically lowest part of the Upper Pleistocene is the Eemian interglacial soil, a typical brown haplic luvi- sol (WRB). The Lower Weichselian is composed of loess, which is in most cases decalcified, and has a strong pedog- enetic overprint. Besides loess a lot of other sediments are typical for this unit, like pedosediments of Lower Weich- selian or Eemian soil horizons, glaciofluvial and glacial sediments, or weathered bedrock. In the stratigraphically upper part of the Lower Weichselian sequence the loess amount increases. The most prominent pedogenetic fea- tures are Ah, Al and Bt horizons and features related to stagnic conditions. These soil horizons are relics of hap- lic chernozem, rendzic leptosol, haplic luvisol and stagnic gleysol. Ricken (1983) mentioned cycles from dry to wet conditions inferred from these palaeosols. The main impor- tant marker horizons are up to four Ah horizons includ-
Fig. 2: Aeolian sediments, loess regions and main boundaries of Quarternary age. (DEM: ASTER GDEM is a product of METI and NASA; river network:
OpenStreetMap, published under CC-BY-SA 2.0; maximum ice advance: Kaltwang 1992)
Abb. 2: Äolische Sedimente, Löss-Regionen und wichtige quartäre Verbreitungsgrenzen. (DGM: Globales ASTER-DGM ist ein Produkt von METI und NASA; Flussnetzwerk: OpenStreetMap, veröffentlicht unter CC-BY-SA 2.0; Maximale Eisausdehung: Kaltwang 1992)
ing one typical Al horizon (bleached zone), disconformi- ties (stone layer), a basal solifluction layer, enrichments in Mn-Fe concretions and charcoal. Due to the wide range of sediments, the influence of local material and the possible soil horizons the Lower Weichselian sections show a high heterogeneity. Without the prominent Ah horizons a clear correlation of different sections is quite difficult.
The Lower Weichselian in the study area was subdivid- ed by Rohdenburg & Meyer (1966) and Ricken & Meyer (1982) into a lower unit (wa1) and an upper unit (wa2).
Generally, the base of wa1 is a solifluction deposit of re- worked Eemian soil material, the stratigraphically young- est Ah horizon is the boundary to the Middle Weichselian.
In some locations a loamy soil complex (Niedervellmar soil complex) was formed instead of typical soil horizons.
If it is overlain by Middle Weichselian arctic brown soils or loamy loess, no clear boundary can be drawn. The authors dated the Niedervellmar soil complex as a part of the wa2 and wm (Tab. 1).
The Middle Weichselian is characterized by calcified or partly decalcified loess, a high amount of fluvially reworked loess, and intercalations of gravel and sand. In the loess se- quence, artic brown soils and arctic soils are found, e.g. the
Herzberg soil and the Kirchberg soil. Reinecke (2006) de- scribed very detailed Middle Weichselian loess sequences with several intercalated soils east of the study area. The most prominent marker horizon is the Lohne soil, which is correlated with the Denekamp interstadial. Bartels & Ro- hdenburg (1968) described a greyish brown soil equivalent called Breinum soil, Ricken (1983) found a stagnic palae- osol of the same age termed Hattorf soil, and Brosche &
Walther (1991) located an arctic paleosol equivalent termed Alversdorf soil. The Lohne soil and its equivalents correlate to the top of the Middle Weichselian record.
The Upper Weichselian is the most homogeneous unit of the study area (Rohdenburg & Meyer 1966). It is composed mainly of loess. Up to five arctic palaeosols are found in the loess sequence (wj1gamma, wj2beta, wj3beta, wj3delta, wj4beta), generally the wj3delta soil is the most prominent one. Besides the soils the Eltville tephra, ice-wedge pseu- domorphs of various sizes, and frost fissures are important marker horizons. The uppermost arctic paleosol (w4beta) was found very seldom, sometimes in sinks of ice-wedge pseudomorphs, normally but masked by the Holocene soil formation.
Table 1: Pedostratigraphy of the loess- and loess-like sediments in southern Lower Saxony and northern Hesse (after: Rohdenburg & Meyer 1966, Ricken
& Meyer 1982, Brosche & Walther 1991, Pouclet & Juvigne 2009).
Tabelle 1: Pedostratigraphie der Löss und löss-ähnlichen Sedimente in Süd-Niedersachsen und Nordhessen (nach: Rohdenburg & Meyer 1966, Ricken &
Meyer 1982, Brosche & Walther 1991, Pouclet & Juvigne 2009).
Upper Weichselian
Middle Weichselian
Lower Weichselian
Late
Weichselian
Eemian Eemian soil Erbach soil
Laacher See Tephra
Eltville Tephra
wj1 gamma soil wj2 beta soil wj3 beta soil wj3 delta soil wj4 beta soil
Lohne soil & equivalents Kirchberg soil
Herzberg soil
Niedervellmar soil complex
Bilshausen soil complex wm
wa1 wa2 wj1 beta loess wj2 alpha loess wj3 alpha loess wj3 gamma loess wj4 alpha loess wj5 alpha loess
E1 E2 E3 E4
Hahnstatt soil Gräselberg soil
southern Lower Saxony northern Hesse
Ah horizon
Ah horizon Ah horizon
Ah horizon
20.000
30.000 12.900
117.000 wj1 alpha loess
Age (ka)
Period Loess and loess- Marker horizons
related sediments
3 Data
The available published data about loess in the study area can be subdivided into three different types (Fig. 3).
- The first, most important data type includes descrip- tions of loess sections, outcrops, or drill-holes. The in- formation is provided mainly as text, sketches or pic- tures, and few tables.
- In contrast, the second type of data comprises descrip- tions about loess properties in a limited area, such as local thickness, granulometry, age, or facies of loessic sediments.
- The third type compiles data about loess properties that are already published in a two dimensional way.
These can be hard-copies of maps or digital maps. They cover more or less the whole study area, because of the large-scale.
The main data sources used are publications, maps and digital data. Most of the articles, mentioned in the previ- ous chapter, contain extensive descriptions and sketches
of loess sections, outcrops and drill-holes. Furthermore, they comprise comments about the local and regional loess properties. These papers are the essential data source of the study.
Additionally, publications about Holocene and Pleis- tocene sediments were examined, as well as palaeobotani- cal, geomorphological, archaeological or paleontological topics including supplementary details about loess and loess-like sediments. Furthermore, releases like excursion guides or general publications about the occurrences of un- consolidated construction material or brown coal deposits were included.
Other important input sources are explanatory notes on the geological map sheets. The German geological map sheets on a scale of 1: 25,000 (GK25) have been mapped since the late 19th century by the regional Geological Sur- veys (Fig. 4). Together with every completed map sheet, the Geological Surveys published an explanatory report of varying extent. In these explanatory notes the authors de- scribed every geological unit in detail and added further
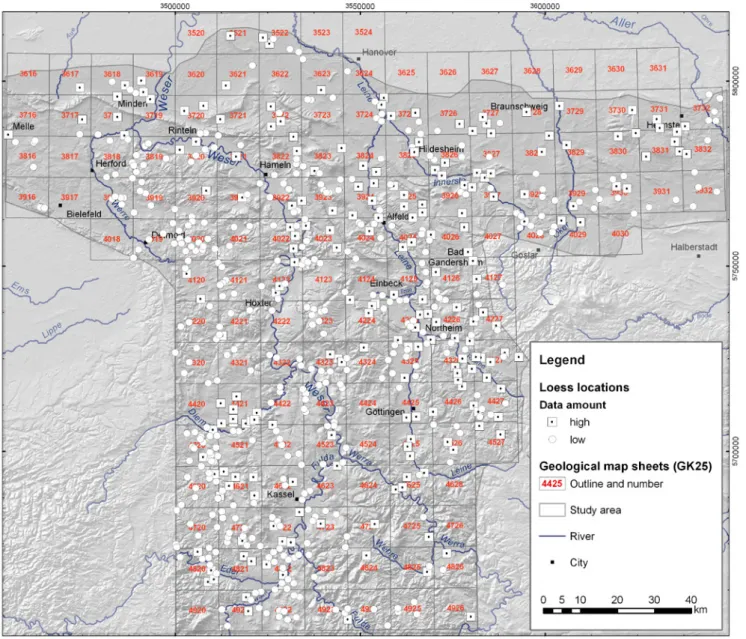
Fig. 3: Loess locations and outline of geological map sheets (1: 25,000 – GK25). (DEM: ASTER GDEM is a product of METI and NASA; river network:
OpenStreetMap, published under CC-BY-SA 2.0)
Abb. 3: Lösslokationen und Umrisse der geologischen Kartenblätter (1: 25.000 – GK25). (DGM: Globales ASTER-DGM ist ein Produkt von METI und NASA; Flussnetzwerk: OpenStreetMap, veröffentlicht unter CC-BY-SA 2.0)
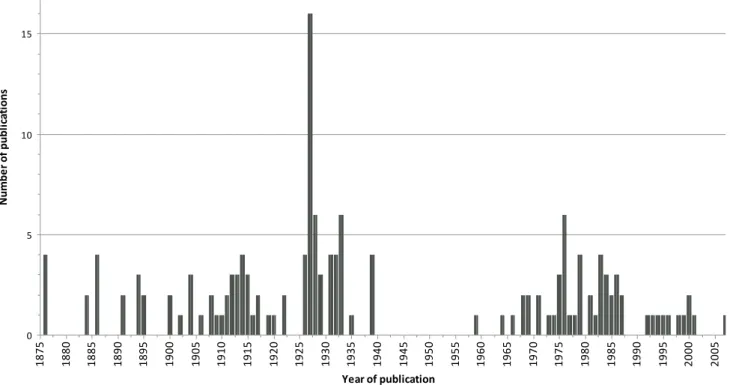
Fig. 4: Year of publishing and number of published explanations on the geological map sheets on a scale of 1: 25,000 (GK25) of the study area.
Abb. 4: Jahr der Veröffentlichung und Anzahl der veröffentlichten Erläuterungen zur Geologischen Karte 1: 25.000 (GK25) des Untersuchungsgebietes.
0 5 10 15
1875 1880 1885 1890 1895 1900 1905 1910 1915 1920 1925 1930 1935 1940 1945 1950 1955 1960 1965 1970 1975 1980 1985 1990 1995 2000 2005
Year of publication
Numberofpublications
descriptions that are not presented on the associated geo- logical map. For that reason, in most explanations some loess sections or drill-holes have been described in detail and some outcrops with remarkable thickness were cited.
Furthermore, the authors released short or extended de- scriptions of the properties of the loess and loess-like de- posits in the particular area covered by the map sheet.
Moreover, different thematic maps, either as hard copies or as digital data, were used for the study. The following three thematic loess maps, available as hard copies, were analyzed.
- The loess map of Wortmann (1942) on a scale of 1: 700,000 is based on small-scale soil maps. On the map the units of the aeolian sediments are classified according to granulometry (loess, “Flottlehm”, “Flottsand” and sandy loess) and thickness (0.2 to 0.5 m; 0.5 to 2 m and more than 2 m). Cover sands and drift sands were not consid- ered, because the author could not infer them from the soil maps. The map covers southern Lower Saxony and small areas of Saxony-Anhalt and Thuringia.
- The loess map of Merkt (1968) is based on published geological maps and unpublished drafts from the Geo- logical Survey of Lower Saxony on a scale of 1: 25,000 and a 1: 200,000 general map. The scale of the loess map is 1: 300,000, covering southern Lower Saxony and small parts of North Rhine-Westphalia, Hesse and Saxony- Anhalt. Merkt (1968) distinguished loess, sand-banded loess as well as sandy loess and separated two thickness classes. Additionally, he illustrated the heterogeneous data level of each input map as a small figure.
- Müller (1961) outlined loess, sandy loess, cover sands and drift sands, weathered soils and recent deflation ar- eas on the loess map of North Rhine-Westphalia on a scale of 1: 1,000,000. The latter author distinguished four loess regions according to their grain size values and
mineral composition, but without thickness data. Only region IV (Lower Weser Upland) of Müller (1961) be- longs to the recent study area.
Furthermore, a geological map of the whole study area was incorporated. The geological map of Germany on a scale of 1: 200,000 (GÜK200) is a digital and generalized compilation of all German geological maps sheets on a scale of 1: 25,000 (GK25). The part of the GÜK200 that covers the study area was used in this study. In contrast to the above maps, this digital map has an attached database containing proper- ties of all mapped units. Aeolian sediments are subdivided in loess and loamy loess, sandy loess and cover sands. But there are no thickness values. A digital elevation model based on ASTER satellite data with horizontal resolution of 25 m x 25 m was inserted. These data are distributed by the Land Processes Distributed Active Archive Center (LP DAAC), located at the U.S. Geological Survey (USGS) Earth Resources Observation and Science (EROS) Center (lpdaac.
usgs.gov). ASTER GDEM is a product of METI and NASA.
4 Methods GIS
The database of this study consists of a huge, heterogene- ous data set of point data, local descriptions and regional information. All types of data contain spatial references (information about location or coordinates). For spatial analysis the GIS software ArcGIS was used which permits storage, display and analysis of spatial data in so called lay- ers. The graphical part of the data (the map content) is rep- resented in vector format as points, polylines or polygons, or in raster format as images or grids. The individual layers can be superimposed exactly above each other according to accurate coordinates, comparable to a traditional stack of maps or transparent papers. In contrast to a traditional
stack of maps or image processing in graphical software packages the GIS software stores attribute data of each ob- ject in a connected table or database. For further analysis objects with relevant attribute data can be extracted based on logical queries, displayed, labelled, and overlain.
A new GIS-project in ArcGIS with the coordinate sys- tem Gauß Krüger Zone 3 was created. Firstly, the digital data (GÜK200 files, ASTER DEM files) were imported and prepared for further analysis. The single tiles were merged to create mosaics, the part of the mosaic, covering the study area was clipped. The clipped files were transformed from geographic coordinates to the projected coordinate system Gauß Krüger Zone 3. Afterwards the hard copies of the analogue loess maps were scanned, added to the GIS project, and geo-referenced. Finally, different shaded relief images on the basis of the DEM were calculated.
In contrast to processing of the digital input data most of the spatial information about loess properties is expressed in texts, tables, or sketches in loess-related publications.
For use in the GIS program they have to be transformed into GIS layers. Hence, two types of layers for the different data types were created.
The first one is a point layer representing loess outcrops, drill-holes, or sections. All points, independent from out- crop type, were named as “loess locations”. These loess lo- cations were digitized as points according to their coor- dinates or position details or copied from geo-referenced location maps.
Sometimes several single descriptions of loess sections had to be generalized and combined to one loess location.
The reasons for that may be that
- different sections were mapped in one outcrop or clay pit, - several descriptions on one outcrop were made by dif- ferent authors, or
- several loess outcrops are located close to each other in one region.
These “summary” locations were named after the nearest village, town or natural region. In the connected attribute table the following data, if available, of each loess location were stored:
- name of the loess location
- description of geographical location - coordinates
- data source - structural type
- granulometry of sediments - thickness
- marker horizons - stratigraphical ages - fossil content
Hereby, as much information as possible, preferring the latest published data, were extracted and stored. Additional data from older publications were added to create complete description. Unsure and inaccurate descriptions and sec- tions that could not be located were excluded.
In summary, 639 loess locations were created (Fig. 3).
Their available attribute data are very heterogeneous, be- cause of large differences in quantity and quality of the out- crop descriptions. They range from few hints about loess outcrops to detailed descriptions with a lot of parameters.
The reasons are the different publishing dates of the pa-
pers and the context, in which the outcrops were exam- ined (loess, fluvial sediments, deposits, paleontological or archeological investigations). In many loess locations some parameters or details are missing. Most information was available about thickness, less information about the other parameters. Sometimes the description is based on incom- plete stratigraphy. The loess locations were classified in a group of very detailed data (421 locations) and in a group of general data (218 locations).
Secondarily, a polygon layer in the GIS project was cre- ated to store the data extracted from the explanations on the geological map sheets in scale 1: 25,000. The outline of each map sheet was digitized as rectangle (Fig. 3). All loess- related information was stored in the related attribute ta- ble, including:
- number of explanatory note - publishing year
- author(s) - loess distribution - accumulation zones
- horizontal zones and granulometric boundaries - granulometry and vertical sequences
- morphology of loess cover - thickness
- stratigraphic age - fossils
- cryoturbation features
From the notes as much information as possible was ex- tracted, more recently published explanatory notes were preferred. Older notes were checked, additional facts and descriptions were added, if available.
In summary, all available notes were examined and data of 152 of them were stored. The notes were published be- tween 1876 and 2007 (Fig. 4), therefore amount and quality of loess-related data are very heterogeneous. Most publica- tions were released in the 1920s and 1930s or between 1960 and 1985. The older notes released before 1940 give only few details on loessic sediments. Aeolian loess and loess derivates are not differentiated. Moreover, in the oldest prints there is no differentiation between loess and flood- plain deposits. Sometimes one note describes two or three map sheets. Few map sheets were published without ex- planatory note.
In addition to the layers “loess locations” and “explana- tory notes”, other layers in the GIS project including digi- tized main topographic features (e.g. rivers, cities, geologi- cal boundaries) were created.
Selection of base map
The accurate distribution of loess and loess-like sediments in the study area is a fundamental base for further analy- sis of the parameters thickness, granulometry and age. The study is not a mapping campaign, so a base map showing a realistic loess distribution to work with had to be selected.
The already mentioned loess maps of Wortmann (1942), Müller (1959) and Merkt (1968) and the digital geological map (GÜK200) were evaluated based on the parameters:
scale, units, coverage, accuracy and publishing age. The result shows that none of them displays a realistic distri- bution of loess and loess-like sediments. Reasons are the difference in the map coverage and the inaccuracy due to
the combination of aeolian loess, loamy loess, soliflucted or fluvial reworked loess to one „loess unit“. Sometimes even younger colluvial or slope sediments were included.
It is also obvious that the maps based on geological sur- veys display a smaller, fragmented loess cover, which was caused by the mapping policy before 1960s. Field geologists drilled only few 1-m drill-holes per map sheet. They fo- cused on the mapping of the bedrock to visualize the com- plex geological and tectonic situation, especially in the Lower Saxon Hills and the Hesse Highlands. Even when the bedrock was only visible in boulders or referred from morphological bends, they mapped the bedrock unit in- stead of the overlying loose material.
Lüttig (1968) compared the results of different geological surveys in 1890–1891, 1948 and 1956/1961 on the the geologi- cal map sheet 4325 (GK25). He proved that a more accurate distribution of loess is displayed in the latest map only, cov- ering much larger areas than in the older maps. From the 1960s on field geologists drilled much more drill-holes (2 m) and tried to map the uppermost geological unit. Most GK 25 sheets, which are the database of the map of Merkt (1968) and GÜK200, were mapped before 1960; some are younger reprints or revision maps with only little changes. Field geol- ogist had no general rule how to map the minimal thickness of loess. Therefore, the loess distribution based on the geo- logical maps show a minimum loess distribution represent- ing a loess cover thicker than 0.5 m, 1 m or 2 m.
The loess unit of the GÜK200 and the loess map of Merkt (1968) show a lot of similarities. In few regions, the GÜK200 shows smaller loess patches. The map of Merkt (1968) displays locally a more realistic distribution. The au- thor examined not only the published GK25 map sheets, but also drafts of modern, unpublished mapping campaigns from the archive of the Geological Survey of Lower Saxo- ny, resulting in some differences and sharp edges between adjacent regions.
The loess map of Wortmann (1942) displays a larger, but also inaccurate loess distribution. The map is based on soil survey campaigns. The uppermost geological unit has a high influence on the resulting soil. Hence, the soil map reflects much more information about the loess and loess-related sediments than the underlying hard rocks.
Comparing this map with the map of Merkt (1968) and the GÜK200, a much larger area of loess cover becomes obvi- ous especially in the uplands. However, the map contains loess patches close to the main rivers, where no real loess can be found. Possibly Wortmann (1942) combined loess and loess derivates with younger flood plain deposits (col- luvial loess).
Although none of the maps shows a realistic loess distri- bution, each of them inhibits important details. Therefore, the comparison between the geology based maps and the soil based map can give additional information. This ap- plies especially to thin loess covers in the uplands as re- corded by Wortmann (1942).
However, the GÜK200 was selected as main base map for the following analysing steps of the study. The map shows smaller loess patches than the other maps and is based on an unclear minimal loess thickness to be mapped. Nevertheless, the map covers the whole investigation area and is the most detailed because of its small scale. The map is in a digital
format, representing the loess and loess-related sediments as polygons, to which new information can be added.
Thickness
In the GIS project all objects of the layers “loess locations”
and “explanations” that contain thickness values or thick- ness ranges were displayed. Each object was labelled with these values or ranges. The loess map of Merkt (1968) was used as background. Then all available thickness values were explored for their minima, their maxima and their typical ranges.
To define thickness classes for a compiled thickness map, some limitations of the data set had to take into ac- count. In general, a loess cover has a very wide range of thickness values in one area depending on the local mor- phology. There is no or only few loess on steep slopes, but very much loess on E-facing slopes or in other accumula- tion positions. And there are a lot of transitions between these extremes.
For that reason, wide thickness classes covering the typ- ical ranges of loess thickness were defined. The main focus laid on the maximum values.
> 0.5 to > 2 m (few data)
≤ 3 m
≤ 5 m
≤ 6 m 2 – 8 m 3 – 10 m 3 – 20 m
The thickness values of all input sources were compared and new patches of the same thickness class were outlined.
The new thickness classes were added to the polygons of GÜK200.
The following rules were set for this procedure:
- If the area was not covered by the map of Merkt (1968) and no further information (loess locations, de- scriptions) were available, the class “> 0.5 to > 2 m (few data)” was selected.
- The thickness data of the loess map of Merkt (1968) were copied, if no further information (loess locations, descriptions) were available.
- The same was done, if the loess locations and the thick- ness in the loess map were similar.
- New thickness patches were outlined, when the loess locations showed higher values, than the loess map of Merkt (1968).
The advantage of the method is the combination of differ- ent input data. Basal map information from the loess map of Merkt (1968) was used and regions with higher loess thickness were added. Nevertheless, the loess locations with thickness values are not distributed equally. In some regions no or few loess locations were reported in the liter- ature. Additionally, authors mentioned minimal thickness values or combined thickness values of loessic sediments and other material in their publications.
Granulometry
In the GIS project a query was applied to display all ob- jects (“loess locations” and “explanations”) with data about petrography, grain sizes, and typical sediment sequenc- es. The granulometric descriptions of the loess maps of
Merkt (1968), Wortmann (1942), and the geological map (GÜK200) were visualized. These input data vary in qual- ity and quantity. Some loess locations have detailed grain size measurements and grain size curves. In contrast, many others have only rough descriptions, the loess maps dis- playing only the uppermost loessic sediment in one region.
As a result, small-scale details were not separated, but a general subdivision in a loess cover layer and a basal layer was carried out. The cover layer represents the homogene- ous upper part of the loess deposits. The underlying basal layer can vary widely in thickness, granulometry, pedog- enetic overprint, intercalations, and distribution. The cover layer was separated into:
- sandy facies (sandy loess, sand-stripped loess and derivates)
- loessic facies
- thin or no sandy facies (very thin cover with gaps) - thin or no loessic facies (very thin cover with gaps) The lower part (base layer) of the loess cover was subdi- vided into:
- unknown base layer - mixed layer or stone layer - reworked loess
All regions with the same cover layer and the same base layer were outlined. Then, the following combinations of these two layers were generated:
- sandy facies on unknown base layer - sandy facies on mixed/ stone layer - sandy facies on reworked loess
- thin or no sandy facies on reworked loess - loessic facies on unknown base layer - loessic facies on mixed/ stone layer - loessic facies on reworked loess
- thin or no loessic facies over reworked loess
These granulometric types were attached to the GÜK200 polygons. During the analysis the outline of the new re- gions followed the boundaries of the map sheets. In case that a map sheet had no information about the base layer, the class “unknown base layer” was selected.
Fig. 5: Thickness map displaying regional thickness ranges of loess and loess-like sediments (including loamy loess, reworked loess, sandy loess, sand-band- ed loess and cover sand). (DEM: ASTER GDEM is a product of METI and NASA; river network: OpenStreetMap, published under CC-BY-SA 2.0) Abb. 5: Mächtigkeitskarte der regionalen Mächtigkeitsbereiche von Lössen und löss-ähnlichen Sedimenten (Lösslhem, Schwemmlöss, Sandlöss, Sandstreifen- löss, Decksand). (DGM: Globales ASTER-DGM ist ein Produkt von METI und NASA; Flussnetzwerk: OpenStreetMap, veröffentlicht unter CC-BY-SA 2.0)
3500000 3550000 3600000
570000057500005800000
0 5 10 20 30 40
km Legend
Regional loess thickness
> 0,5 to > 2 m (few data)
<= 3 m
<= 5 m
<= 6 m 2 to 8 m 3 to 10 m 3 to 20 m
Study area
" City
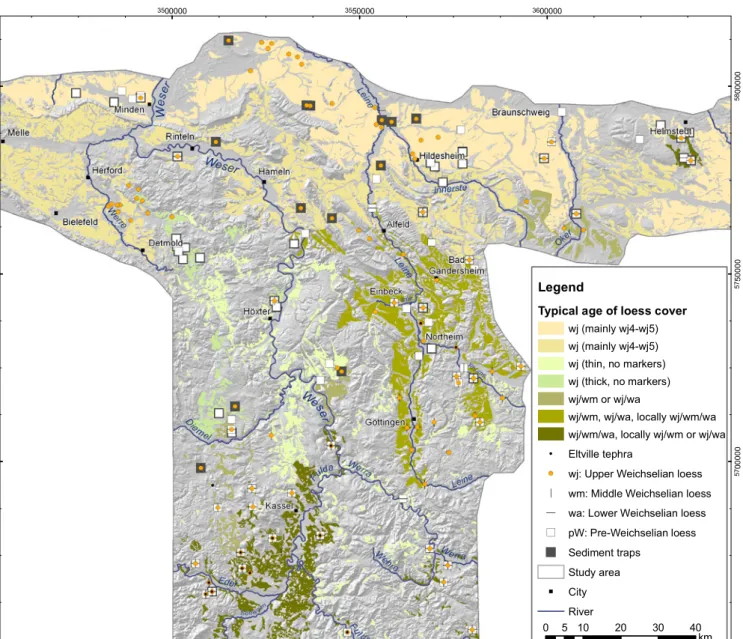
River