1
Abstract ID 23 – International Journal of Hydrogen Energy
Zeolite supported Pd electrocatalyst nanoparticle characterization
Jun Yaoa*, Yufeng Yaob
a School of Engineering, University of Lincoln, Brayford Pool, Lincoln LN6 7TS, UK
b Department of Engineering Design and Mathematics, University of the West of England,
Coldharbour Lane, Bristol BS16 1QY, UK, [email protected]
*Correspondent Author. Tel: +44 (0)1522 837 7919, Email: [email protected] (J. Yao)
Highlights:
• Detail Pd cluster structure by the ex-situ Extended X-ray Adsorption Fine
Structure (EXAFS) method.
• Evaluate Pd/Y-zeolite nanoparticle size under calcinations and reduction
temperature.
• Measure Pd nanoparticle electrochemical activity in electrolyte solution.
• Discuss electrochemical reaction behaviour with respect to Pd particle size.
• Explore Pd particle location and Pd particle migration and electrochemical
behaviour.
Abstract
A laboratory made 1.5 wt% Palladium (Pd) zeolite electrocatalyst is investigated using the
Extended X-ray Adsorption Fine Structure (EXAFS) and Cyclic Voltammetry (CV)
techniques to reveal Pd structure and resultant electrochemical performance. It was found that
2
electrocatalyst with large-size particles made at high temperature of 400 oC, compared to
those with small-size particles calcined and reduced at temperature below 360 oC, at which no
major discrepancies were observed between catalysts of different sizes. Furthermore, Pd
particle location has played an important role to enhance electrocatalyst performance. The Pd
atom tends to remain at small cages, i.e. zeolite sodalite cages or hexagonal prisms at
calcinations and reduction temperatures below 360 oC. When temperature increases to about
400 oC, the majority Pd atoms tend to migrate from zeolite small cages to supercages and
zeolite external structures with enhanced electrochemical performance.
Keywords: Pd nanoparticle mobility; Calcinations and reduction temperatures; Cyclic Voltammetry (CV); Ex-situ EXAFS; Electrochemical activity; Zeolite sodalite cages and
hexagonal prisms.
1. Introduction
The hydrogen polymer electrolyte fuel cell (PEFC) has been extensively investigated over
the past five decades, with most studies focused on electrochemical reactions including the
hydrogen oxidation reaction (HOR) and oxygen reduction reaction (ORR) [1, 2]. While the
Platinum (Pt) based electrocatalysts have been proved to be the best choice for HOR and
ORR reactions due to their high activity and stability [2], the high (Pt) price has limited its
wider industry applications. This largely stimulates researchers to search for alternative
electrocatalysts with comparable performance but at much reduced cost. The Palladium (Pd)
as one of the Pt-group metals has attracted significant attentions, owing to its relatively good
HOR and ORR activities [3], and much low cost (only about one third of that of Pt). In
general, the Pd-based catalyst has shown lower catalytic activity than those Pt
3
small organic molecules, e.g. methanol and ethanol due to a better resilience to CO poisoning
[4]. Hence, Pd nanoparticle catalyst can be a potential good candidate as an electrocatalyst for
fuel cell applications, if Pd catalytic activity and stability can be largely improved to be
compatible with Pt electrochemical activity. This is the main motivation of this proposed
study.
Recently, a lot of efforts have been made to focus on the development of carbon and
graphene based Pd-nano electrocatalysts [5] using approaches such as surface modification,
composition control [6], alloying [7] and spontaneous methods [8] respectively for hydrogen
fuel production in PEFCs. In addition, the ‘support promotion’ method is another approach
employed to improve catalyst nanoparticle distribution for hydrogen fuel cell efficiency
enhancement [2]. Zeolite is a type of porous amorphous material consisting of crystalline
framework, formed by aluminosilicates structure comprised of SiO4 and AlO4 tetrahedral
forms as the base units. These tetrahedral structures are interlinked with each other by sharing
one oxygen atom. Each [AlO4]- tetrahedron in the framework induces negative charges which
can be compensated by a charge–balancing cations of Na+ or H+ ions situated in the zeolite
channels or cavity. The extra framework of metal ions on zeolite active sites (also called
Brnsted acidic sites) are mobilized to take part in an ion exchange process with the desired
metal ions. The ‘X’ or ‘Y’ type of zeolite channel structure with exemplary surface area and
cation exchange capacity makes it a desirable platform for adsorption of different species to
produce fine metal particle distribution. Moreover, the larger surface area and the pore
structure of zeolite enable to absorb the electrolyte and electrochemical reaction species,
which can lead to a suitable condition for electrochemical measurement during
diffusion-controlled mass transfer process [9].
Zeolite catalytic performance can be modified by pre-exchanging with ions to give the
4
reduction process with fine-tuned temperature control to further promote catalytic activity of
metal particles [10]. For example, Scarano et al. investigated 4 wt% Pd loading on NH4-Na-Y
zeolite exchanged with aqueous solution of [Pd(NH3)4](NO3)2 under calcinations at 200 oC
and reduction at 300 oC, respectively. The hydrogen atoms transiting through silicate rings are
the possible mechanisms for hydrogen transport to and from the sodalite – cages, due to
hydrogen diffusion in active form through zeolite framework by spill-over effects that
hydrogen can be adsorbed by Pd [11]. The proton is able to migrate to zeolite neighboring
rings, facilitating the mobility of hydrogen atoms in the silicate framework. The penetration
probability of hydrogen within sodalite cage and hexagonal prism can be further enhanced by
the presence of Pd catalytic active site on zeolite. The large-size Pd nanoparticle is found to
locate at the exterior of zeolite surface due to the migration of Pd atoms from zeolite internal
structure to the external surface during reduction process [11]. Alternatively, the atomic
hydrogen can diffuse into the zeolite sodalite cages by penetrating from hexagonal openings
of the zeolite framework. Homeyer and Sachtler [12] have reported that Pd(NH3)x2+ ions
release into zeolite supercages at calcinations temperature of 250 oC. The oxidation of
Pd(NH3)42+ ions were observed to produce Pd(NH3)22+ ions in supercages and Pd(NH3)2+ in
sodalite cages [13]. Further temperature increase was found to result in producing Pd2+ ions at
calcinations temperature over 300 oC. The Pd2+ ions were found to have a high mobility,
migrating from zeolite external surface and supercages into zeolite small cages i.e. sodalite
cages or hexagonal prism. Most Pd2+ ions were forced into sodalite cages at the calcinations
temperature up to 500 oC.
The reduction process has shown that Pd atom is more favorable to remain in the zeolite
supercages than the sodalite and hexagonal prism [11]. Bergeret et al. [14] and Kleine et al.
[15] have found that the reduction can result in agglomeration of Pd atoms in the supercages
5
high temperature condition. Pd species were observed to migrate back into zeolite supercages
at reduction temperature of 360 oC. Moreover, the mobility of Pd might be contributed by the
restoration of zeolite active sites (i.e. Brnsted acidic sites) via H2 reduction [16]. H2 can have
affinity with proton to induce a ligand displacement with the –OH groups interacted to
oxygen atoms in the sodalite cages and form the hydrogen bonded complex [11].
In a previous study, the in-situ EXAFS data analysis of Pd nanoparticle structure on Y
zeolite in an electrochemical environment has predicted a first shell Pd-Pd distance of 2.73 Å
with respect to a Pd first shell coordination number of 12 which give rise to an average radius
of metal particle greater than 15 Å [11]. However, the average of Pd particle size is still
smaller on zeolite than on carbon and those coated on microcellular graphitic carbon where
Pd particles can be between 2.7 nm – 65.2 nm and 6.6 nm – 30.3 nm, respectively [17].
Pd also has a capability of bulk incorporation of hydrogen that can lead to the high
solubility and mobility of hydrogen in Pd. This might be associated to the diffusion of atomic
hydrogen produced by the disassociation of the H2 molecule on the Pd metal particles due to
hydrogen spillover ability on Pd within zeolite internal structure especially sodalite cages.
Subsequently, the Pd sample activation procedure can be important to control the atomic
hydrogen spillover efficiency on Pd [11, 18]. Recently, zeolite supported Pd material has
attracted a significant interest for its applications to enhance the fuel cell efficiency.
In general, the hydrogen oxidation reaction (HOR) pathway will include three important
steps that might occur either via Volmer-Tafel or Volmer-Heyrovsky reaction process or both
reactions [2, 19, 20]. In an acid electrolyte solution, the activity of HOR on Pd or Pt surface
can follow an almost identical trend of hydrogen evaluation reaction that includes three
reaction steps, in which the first step involves the Volmer reaction to receive an electron by a
proton, leading to an intermediate hydrogen atom to be adsorbed at the active sites [21],
6
hydrogen atoms are initially adsorbed on the active sites of electrocatalyst as intermediates
and then they are able to form hydrogen molecules [2]. Moreover, the Pd is found to exhibit
the lower kinetics of hydrogen evolution reaction (HER) than that of the Pt. Thus, some
different approaches [5, 6, 7, 8] have been explored to develop the cost effective Pd
electrocatalyst system, such as nanocomposites [6] supported on different porous medium
materials.
The study presented in this paper will focus on the investigation of Pd sample activating
procedure that might affect the electrochemical performance of hydrogen oxidation and
oxygen reduction process on Pd active sites in the electrolyte solution. The electrocatalytic
activity of 1.5 wt% Pd on zeolite made by ion exchange method under various calcinations
and reduction temperatures was investigated using Cyclic Voltammetry (CV) technique. Pd
particle size and its dispersion on zeolite will be characterized by the ex-situ extended X-ray
adsorption fine structure (EXAFS) using pallet made by Pd zeolite catalyst and boron nitride.
The study will contribute to the well understanding of Pd electrocatalyst efficiency enhanced
by hydrothermal process under calcinations and reduction temperature control.
2. Experimental
2.1 Preparation of Pd/Y zeolite electrocatalysts
The ion exchange method has been employed to achieve 1.5 wt% Pd loading on Y zeolite
using (NH3)4PdCl4 [7,19, 22]. In this process, the [Pd(NH3)4]4+ ligand was ion exchanged with
Na+ ions situated on the alumina tetrahedral arrangement of [AlO4]- ions that led to a high
dispersion of Pd on zeolite with uniform distributions [22, 23]. Each positive [Pd(NH3)4]4+ ion
can interact with four negative charged [AlO4]- ions to introduce a charge balance. Then,
further calcinations reaction can induce a Pd4+ ion which bridges with four [AlO4]- ions after
7
The ion exchange process was carried out at PH7 in a neutral solution. An appreciated
quantity of (NH3)4PdCl4 was introduced in 200 ml of triply distilled water to produce a Pd
concentration of 0.004 mol dm-3. The Pd salt was dissolved uniformly in an ultrasonic bath at
ambient room temperature. The process of [Pd(NH3)4]4+ ions exchange with zeolite was taken
place using a water jacketed reaction with water cycled around at 70 oC, in which Y zeolite
powder was dispersed at a concentration of 1 g per 100 ml of triply distilled water. The Pd
salt solution was then pumped into the reactor at a flow rate of 0.1 ml/min. The resultant Pd/Y
zeolite samples were washed with a sufficient amount of triply distilled water until no Cl- ions
detected by 1 N AgNO3 solution. The completion of Pd complex ion exchange was confirmed
by UV spectrum.
2.2 Synthesis of 1.5 wt% Pd zeolite electrocatalyst
1.5 wt% Pd/Y zeolite electrocatalysts were made by calcinations and reduction processes
to remove Pd coordinate ligand. The [Pd(NH3)4]4+ salt loaded Y zeolite samples were purged
with argon gas at 150 oC to dry out the water moisture in a fluidized reactor. The calcinations
of [Pd(NH3)4]4+ salt/Y zeolite samples were carried out at 250 oC, 350 oC and 400 oC,
respectively, in O2 gas phase at a flow rate of 200 ml/min, and then followed by reduction in a
5%H2/95% N2 gas mixture at 360 oC or 400 oC to produce a fine distribution of Pd particles
on zeolite.
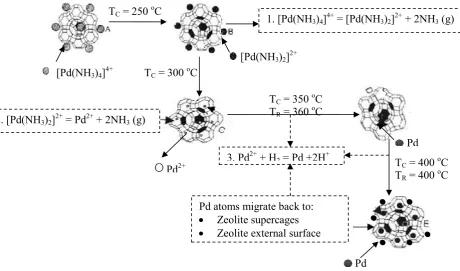
Figure 1 illustrates the Pd migration pathways through zeolite structure under calcinations
and reduction temperature control. The ion exchange process is to locate [Pd(NH3)4]4+ ligand
on zeolite exterior surface and in supercages. The ammonia ligands start to decompose at 250
oC [13] and produce [Pd(NH
3)2]2+ (see formula 1 in Fig. 1). The Pd2+ ions can migrate
through zeolite channels and then further extend to zeolite small cages, i.e. sodalite cages and
8
increase of calcinations and reduction temperatures up to 350 oC and 360 oC respectively
might force Pd atoms to migrate back into zeolite sodalite cages or zeolite supercages (see
formula 3 in Fig. 1). Pd atoms can move back from zeolite small cages to supercages and
zeolite external surface at calcinations and reduction temperature of 400 oC (see formula 3 in
Fig. 1).
Figure 1. A schematic diagram depicts Pd migration controlled by calcinations (denoted as
‘C’) and reduction (denoted as ‘R’) process.
The following equation (1) prescribes an overall chemical reaction of Pd ligand by
calcinations and reduction process:
[Pd(NH3)4]4+ + O2 (gas) + 2H2 (gas) = 4NH3 (gas) + 2H2O + Pd (1)
Pd
TC = 250 oC 1. [Pd(NH
3)4]4+ = [Pd(NH3)2]2+ + 2NH3 (g)
2. [Pd(NH3)2]2+ = Pd2+ + 2NH3 (g)
TC = 300 oC
TC = 350 oC
TR = 360 oC
3. Pd2+ + H
2 = Pd +2H+ T
C = 400 oC
TR = 400 oC
Pd atoms migrate back to: Zeolite supercages Zeolite external surface
[Pd(NH3)4]4+
[Pd(NH3)2]2+
Pd2+
[image:8.595.66.527.251.522.2]9
2.3 Electrochemical cell and cyclic voltammetry (CV)
A typical 9 cm2 electrode sheet was made of 1.5 wt% Pd loading on zeolite electrocatalyst
mixed with XC-72R carbon powder (untreated) mixture and 15 wt% Nafion@ solution (from
Aldrich) as a binding agent. A solidification process was then taken place by hot pressing the
resultant paste on carbon paper (E-TEK TGHP-90). A 2.5 cm2 diameter disc electrode was
trimmed for a standard CV measurement that was performed using a glass–jacket
electrochemical cell, consisting of a zeolite supported Pd working electrode, Hg/Hg2SO4
Mercury/Mercuries Sulphate (MMS) reference electrode and a Pd gauze counter electrode.
The electrolyte was 2.5 mol dm-3 sulfuric acid (H2SO4) solution and the CV was measured at
a scan rate of 1 mV s-1 in a potential region of -0.675 V to 0.4 V for 1.5 wt% Pd loading on
zeolite samples calcined at 250 oC and reduced at 360 oC (denoted as 15Pdanc25r36),
calcined at 350 oC and reduced at 360 oC (denoted as 15Pdanc35r36) and calcined and
reduced at 400 oC (denoted as 15Pdancr40), respectively, in which no electrolyte
decomposition was detected.
2.4 The Ex-situ Extended X-ray Adsorption Fine Structure (EXAFS) Measurement
Pd/Y zeolite electrocatalysts were characterized by the ex-situ extended X-ray
adsorption fine structure (EXAFS) measurement technique using a Synchrotron Radiation
Source (SRS) at STFC Daresbury National Laboratory [7]. The wiggler beam line was
operated at 2 GeV and 100 mA. Those high order harmonics that might affect the amplitude
of EXAFS were removed using a double-crystal Si220 monochromator. The EXAFS data was
then collected at the Pd K edge using a pellet placed in air. The pellet was made by 1.5 wt%
Pd/Y zeolite catalyst powder mixed with boron nitride to give a Pd loading of 0.73 mg cm-2.
A Pd foil was used as a reference sample for EXAFS data collection. The resultant EXAFS
10
distance, atom number and the type of backscattering neighbors were determined by a method
proposed by Abruna [24].
3. Results and Discussion
3.1 The ex-situ extended X-ray adsorption fine structure (EXAFS) measurement
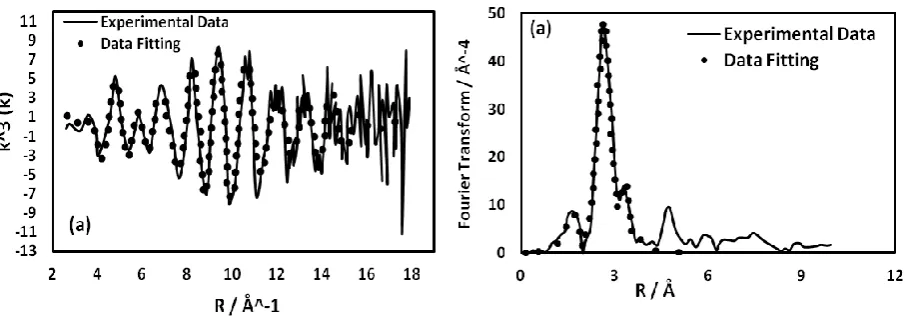
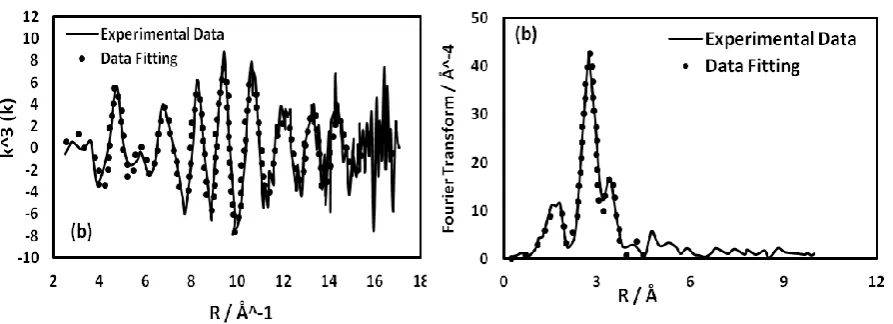
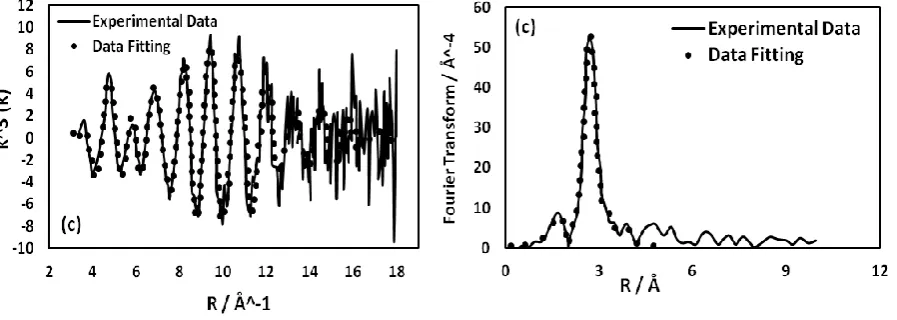
Pd particle size and distribution for 1.5 wt% Pd loading on zeolite were investigated using
the ex-situ EXAFS technique. Figures 2-4 display the EXAFS Chi data and their Fourier
transform fitting results using the ex-situ EXAFS measurement. The EXAFS data were
collected at the Pd K edge in air. The fitted data are presented in Tables 1, 2 and 3. The Chi
data for catalyst samples 15Pdanc25r36 and 15Pdancr40 were valid over the range of wave
vector from 2 Å-1 to 18 Å-1, and for catalyst sample 15Pdanc35r36, Chi data were up to 17 Å
-1. A data scattering was observed in Chi spectrum at a slightly high noise level after 14 Å-1.
The EXAFS data was subsequently fitted up to 3 shells with respect to a goodness fitting
value (Rexafs) of 40% representing an acceptable data fitting quality. The curve fitting (shown
in dotted symbols) matches well against the raw data (shown in solid lines). The shells 1 & 2
Pd-Pd coordination numbers were predicted at 5.2 and 2.05 for catalyst 15Pdanc25r36 (see
Table 1), 4.25 and 3.22 for catalyst 15Pdanc35r36 (see Table 2), and 5.77 and 2.22 for
catalyst 15Pdancr40 (see Table 3), respectively. The Pd-Pd binding distance was determined
at 2.74 Å,indicating that Pd atom had metallic property in nature. A Pd-O shell was further
added to improve data fitting quality for all three catalyst samples. The Pd-O distance was
predicted at 2.01 Å for catalyst samples 15Pdanc35r36 (see Table 2) and 15Pdancr40 (see
Table 3) and 2.02 Å for catalyst sample 15Pdanc25r36 (see Table 1), respectively. The
presence of O neighboring atom indicates the oxidation of Pd to form Pd-O shell.
The Pd cluster size and geometry might be estimated using the first (or nearest) neighbor
11
An icosahedra cluster is adopted to estimate the Pd cluster edge length usingN1, due to Pd
metallic feature in nature. An average theoretical first (or nearest) neighbor mean coordination
number and a total number of atoms in a cluster was estimated at 6.45 and 13, using equations
(2) and (3) [25]. The Pd-Pd first shell coordination number estimated by EXAFS is slightly
lower than those given by Benfield theory [25]. On average the Pd atoms are estimated at 11,
10 and 12, respectively, based on EXAFS data analysis, which results in the following order
of Pd particle size in radius: 15Pdancr40 at 1.0 nm > 15Pdanc25r36 at 0.9 nm >
15Pdanc35r36 at 0.8 nm. The EXAFS results imply that Pd particle size increases with the
increase of calcinations and reduction temperatures. The larger particle size is usually
correspondent to a low Pd active surface area based on per gram of metal. Thus, the expected
electrochemical activity of charger transfer under the features of the hydride peak would be in
an order of 15Pdancr40 < 15Pdanc25r36 < 15Pdanc35r36, only if the calcinations and
reduction temperature has solely effect on the particle size. However, this is not a type of
trend being observed in CV measurement by determining charger transfer in hydride region.
Therefore, the location of the metal particle on zeolite must also be taken into a consideration.
Unlike Pt, Pd is more capable to mobile from zeolite small cages to supercages and zeolite
external surface under high calcinations and reduction temperature, due to its‘d’ electron
configuration [26], that can be altered with the change of Pd electronic and geometric
structure [27]. The valence electrons on Pd are in the form of 4d orbital shape, whilst they are
in the 5d orbital shape on Pt. Pd2+ has a greater charge density than Pt2+. This will lead to the
increase of the mobility of Pd. By controlling the calcinations and reduction temperature, Pd
particle can be enriched in the zeolite supercages and zeolite external surface. Pd particles in
these locations are more accessible to the protons in the electrolyte solution. In addition, Pd
particles on the zeolite external surface might have a better electronic contact with the carbon
12
cos
6
1
2 2 25 12
/
2 1
5 2 5 3
1 i m m m m m m
N (2)
1/3 2 1
5 25 3
m m m
[image:12.595.152.443.302.423.2]Ntotal (3)
Table 1. The ex-situ EXAFS data fitting results for data collected at the Pd K edge at ambient room temperature for catalyst sample 15Pdanc25r36.
15Pdanc25r36 N 22/Å2 R/ Å
Shell 1 O 0.950.09 0.00490.0012 2.020.006
Shell 2 Pd 5.200.62 0.01410.0003 2.740.003
Shell 3 Pd 2.050.54 0.01250.0032 3.410.017
Figure 2. The ex-situ EXAFS Chi data and Fourier transforms and their fitting results for
catalyst sample 15Pdanc25r36, phase corrected. The data were collected at ambient room
temperature in air. The solid lines represent the experimental data, and the dotted symbols
[image:12.595.76.531.476.642.2]13
Table 2. The ex-situ EXAFS data fitting results for data collected at the Pd K edge at ambient room temperature for catalyst sample 15Pdanc35r36.
15Pdanc35r36 N 22/Å2 R/ Å
Shell 1 O 1.450.25 0.00630.0023 2.020.006
Shell 2 Pd 4.250.28 0.01350.0006 2.740.003
Shell 3 Pd 3.220.57 0.01470.0016 3.420.010
Figure 3. The ex-situ EXAFS Chi data and Fourier transforms and their fitting results for
catalyst sample 15Pdanc35r36, phase corrected. The data were collected at ambient room
temperature in air. The solid lines represent the experimental data, and the dotted symbols
[image:13.595.79.526.342.504.2]14
Table 3. The ex-situ EXAFS data fitting results for data collected at the Pd K edge at ambient room temperature for catalyst sample 15Pdancr40.
15Pdancr40 N 22/Å2 R/ Å
Shell 1 O 1.100.30 0.00720.0038 2.010.018
Shell 2 Pd 5.770.33 0.01410.0006 2.740.005
Shell 3 Pd 2.221.01 0.02000.0053 3.390.013
Figure 4. The ex-situ EXAFS Chi data and Fourier transforms and their fitting results for
catalyst sample 15Pdancr40, phase corrected. The data were collected at ambient room
temperature in air. The solid lines represent the experimental data, and the dotted symbols
represent the fitted data.
3.2 Cyclic Voltammetry (CV)Measurement
The total accessible electrochemically active Pd surface area of electrode was measured in
2.5 mol dm-3 sulfuric acid (H2SO4) solution, corresponding to catalyst samples 15Pdanc25r36,
[image:14.595.72.521.323.483.2]15
wt% Pd on XC-72R Nafion@ bound working electrode made by a commercial catalyst of 40
wt% Pd on XC-72R carbon mixed with extra XC-72R carbon powder (denoted as
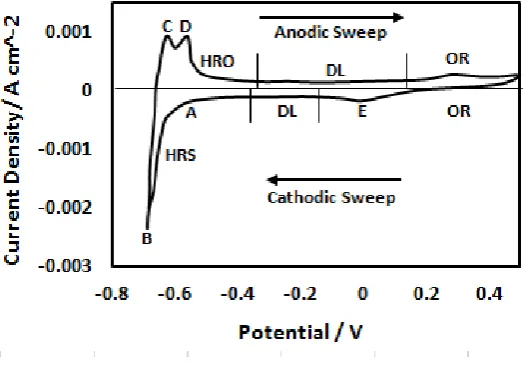
15PdXC-72R) [28]. The two distinguished regions are identified and they are likely associated with the
hydrogen adsorption, evaluation, hydrogen desorption and the re-oxidation peaks,
respectively. This may be contributed by the morphology of Pd electrocatalyst as discussed in
[29]. A small peak ‘A’ is detected at -0.59 V, which is correspondent to hydrogen adsorption
on Pd active site. The hydrogen evolution (i.e. the peak ‘B’) is observed at -0.689 V, and a
double layer (DL) current density is measured between -0.18 V and -0.420 V in the cathodic
sweep and from 0.18 V to -0.4 V in the anodic sweeps, respectively. The hydrogen
re-oxidation represented by the peak ‘C’ is determined at -0.626 V on the anodic sweep and the
second peak ‘D’ at -0.564 V is attributed to hydrogen desorption. The increase of current
density from 0.226 V to 0.4 V is due to the formation of Pd oxide (PdO) on Pd surface. A
[image:15.595.146.410.450.636.2]peak ‘E’ predicted at 0.0656 V interprets the striping of O formed on Pd surface.
Figure 5. Steady State Cyclic Voltammogram (CV) measurement using 1.5 wt% Pd on
XC-72R carbon powder Nafion@ bound working electrode made by a commercial 40 wt% Pd on
16
scanned at 1 mV s-1 in 2.5 mol dm-3 H2SO4 at the potential region of -0.675 V to 0.4 V vs
MMS reference electrode [28].
The electrochemical activity of Pd on zeolite was determined using a Nafion@ bound
Pd zeolite electrode fabricated by 1.5 wt% Pd loading on zeolite with extra XC-72R carbon
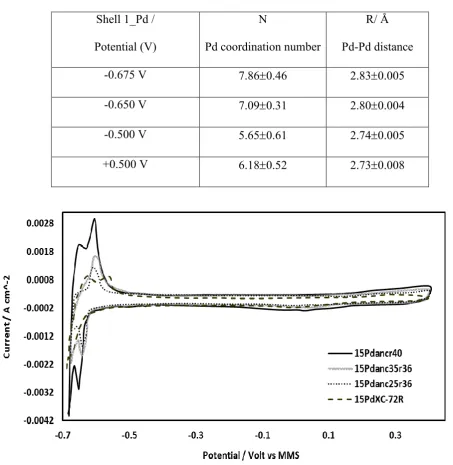
power. Figure 6 has shown CV comparisons of electrochemical performance for 1.5 wt% Pd
zeolite samples made by calcinations and reduction process at different temperatures. The
strong current density change was detected using electrode made by catalyst sample
15Pdancr40 calcined and reduced at 400 oC in hydride region, where two distinguished peaks
for weakly or strongly hydrogen desorption were captured at -0.607 V and -0.631 V in the
anodic sweep. The peak tendency measured for catalyst sample 15Pancr40 is very identical to
that measured by catalyst sample 15PdXC-72R. The current density of hydrogen desorption
has seen a smaller increase for catalyst sample 15Pdanc35r36 than catalyst 15Pdanc25r36 in
hydrogen adsorption and desorption regions, respectively, where a single hydrogen desorption
peak is observed for both catalysts. There is no second hydrogen desorption peak captured in
the hydride region, which implies these two hydrogen desorption peaks having a very similar
energy level on Pd active sites. The current density increase in the hydride region follows an
order of 15Pdancr40 > 15Pdanc35r36 > 15Pdanc25r36 > 15PdXC-72R. A similar tendency
was detected in the oxygen oxidation and reduction region for all the four samples. The CV
measurement indicates that the calcinations and reduction temperature increasing up to 400 oC
enables the improvement of Pd electrocatalytic activity in an electrochemical environment.
The similar peak areas captured in the hydride region for catalyst samples 15Pdanc25r36 and
15Pdanc35r36 indicate that Pd particle has a very similar location in the structure of these two
samples. The calcinations and reduction temperature has played a critical role to mobile the
17
zeolite hexagonal prisms to sodalite cages at the calcinations temperature of 350 oC. The
mobility of Pd particles from zeolite small cages to the supercages and zeolite external surface
are more pronounced by high calcinations and reduction temperature at 400 oC. This has
resulted in the increase of the Pd active surface areas. Furthermore, the restoration of zeolite
active sites (i.e. Brnsted acidic sites) under hydrogen reduction process might have enhanced
the migration of Pd atoms between the zeolite channels and cages [16].
Previously, the in-situ EXAFS data analysis to determine Pd particle structure in the
hydride region via electrode made by catalyst samples of 15Pdanc35r36 has depicted a Pd-Pd
distance of 2.83 Å at -0.675 V and 2.80 Å at -0.65 V which has seen a significant increase
whereas compared to a metallic Pd-Pd distance of 2.74 Å (see Table 4) [28]. This increase
corresponding to Pd distance might be due to hydrogen adsorbed on Pd surface or forming Pd hydride phases such as -PdH or α-PdH on Pd particle through ‘spillover’ of hydrogen atom on zeolite channel or surface conductance. The -PdH associated with a direct hydrogen adsorption reaction between electrode surface and sub-surface might be decomposed to α -PdH, due to the migration of hydrogen atom from a nearer surface of Pd hydride phase to the center of Pd particle. The Pd-Pd atom binding distance was predicted at 2.74 Å at -0.5 V and 2.73 Å at 0.5 V which implies the Pd particle presenting more metallic features in nature. The Pd particle size tends to be large at more negative potential in the hydride region as indicated by the Pd first shell coordination number (see Table 4), and this might be directly associated with the formation of -PdH and α-PdH hydride phase, resulting in a long Pd-Pd distance in comparison to the Pd-Pd distance predicted for same catalyst samples in atmosphere condition.
18
Table 4. The in-situ EXAFS data fitted at the Pd K edge in hydride region at the potential of -0.675 V, -0.65 V, -0.5 V and + 0.5 V via MMS reference electrode [28].
Shell 1_Pd /
Potential (V)
N
Pd coordination number
R/ Å
Pd-Pd distance
-0.675 V 7.860.46 2.830.005
-0.650 V 7.090.31 2.800.004
-0.500 V 5.650.61 2.740.005
+0.500 V 6.180.52 2.730.008
Figure 6. Comparison of CV measurements to determine the catalyst performance of
15Pdancr40 – calcined and reduced at 400 oC; 15Pdanc35r36 – calcined at 350 oC and
reduced at 360 oC; 15Pdanc25r36 – calcined at 250 oC and reduced at 360 oC, respectively.
The CV was measured at scan rate of 1 mV s-1 in 2.5 mol dm-3 H2SO4 at the potential region
[image:18.595.77.531.142.608.2]19
4. Conclusion
The influence of calcinations and reduction temperature on Pd particle size has been
investigated by the ex-situ extended X-ray adsorption fine structure (EXAFS) and Cycle
Voltammetry (CV) techniques. The enhancement of electrochemical activity associated with
the charger transfer on Pd active surface in the hydride region increases with calcinations and
reduction temperature up to 400 oC. No major discrepancy of current change with respect to
hydrogen adsorption and desorption peaks was determined for catalyst samples calcined at
250 oC and reduced at 360 oC (i.e. 15Pdanc25r36) or calcined at 350 oC and reduced at 360 oC
(i.e. 15Pdanc35r36), respectively. The Pd particle size follows an order of 15Pdancr40 (1.0
nm) > 15Pdanc25r36 (0.9 nm) > 15Pdanc35r36 (0.8 nm). A high dispersion of small metal
particle size is usually correspondent to a high catalyst activity. However, this tendency is not
reflected by CV measurements observed for electrochemical activity of charger transfer in the
hydride region, in which the electrocatalytic activity of catalysts is arranged in an order of
15Pdancr40 > 15Pdanc35r36 > 15Pdanc25r36. The Pd location might have played an
important role to increase the catalytic activity of Pd particle. For catalyst 15Pdancr40, the
majority of Pd atoms are resident at zeolite supercages and/or on the zeolite external surfaces.
For those samples made at the calcinations and reduction temperature below 360 oC, the Pd
atoms are most likely to remain at zeolite small cages such as sodalite cages or hexagonal
prisms. The mobility of Pd atoms can be facilitated by atomic hydrogen disassociated by H2
molecule or the restoration of zeolite active sites (i.e. Brnsted acidic sites) during a
chemically H2 reduction process.
5. References
[1] W. Vielstich, A. Lamm, H.A. Gasteiger, Handbook of Fuel Cell: Fundamentals
Technology and Applications, Vol. 1. Fundamental and Survey of Systems, Wiley, ISBN:
20
[2] L. Zhang, Q. Chang, H. Chen, M. Shao, Recent advances in palladium-based
electrocatalysts for fuel cell reactions and hydrogen evolution reaction, Nano Energy, 29
(2016), pp. 198-219.
[3] M. Shao, Palladium-based electrocatalysts for hydrogen oxidation and oxygen reduction
reactions, J. Power Sources, 196 (2011), pp. 2433-2444.
[4] S. Yao, C. Liu, W. Xing, Enhanced catalytic performance of carbon supported palladium
nanoparticles by in-situ synthesis for formic acid electrooxidation, J. Power Sources, 284
(2015), pp. 355-60.
[5] Ghasemi S, Hosseini SR, Nabipour S, Asen P. Palladium nanoparticles supported on
grapheme as an efficient electrocatalyst for hydrogen evolution reaction. Int. J. Hydrogen
Energy 2015; 40(46): 16184-16191.
[6] DÖner A, Tezcan F, Kardas G. Electrocatalytic behavior of the Pd-modified
electrocatalyst for hydrogen evolution. Int. J. Hydrogen Energy 2013; 38(10): 3881-3888.
[7] Yao, J. and Yao, Y.F. Experimental study of characteristics of bimetallic Pt-Fe
nano-particle fuel cell electrocatalyst, Renewable Energy 2015; 81: 182-196.
[8] Ojani R, Raoof JB, Hasheminejad E. One–step electroless deposition of Pd/Pt bimetallic
microstructures by galvanic replacement on copper substrate and investigation of its
performance for the hydrogen evolution reaction. Int. J. Hydrogen Energy 2013; 38(1):92-99.
[9] H. Ramezani, S.N. Azizi, S.R. Hosseini, NaY zeolite as a platform for preparation of Ag
nanoparticles arrays in order to construction of H2O2 sensor, Sensors and Actuators B, 248
(2017), pp. 571-579.
[10] Y.M. Li, Industry Catalysis Principle, 1992. Tian Jing University Publications.
[11] D. Scarano, S. Bordiga, C. Lamberti, G. Ricchiardi, S. Bertarione, G. Spoto, Hydrogen
adsorption and spill-over effects on H–Y and Pd-containing Y zeolites: An experimental and
21
[12] S.T. Homeyer, W.M.H. Sachtler, Elementary steps in the formation of highly dispersed
palladium in NaY: II. Particle formation and growth, J. Catal. 118 (1989), pp. 266-274.
[13] S.T. Homeyer, W.M.H. Sachtler, Elementary steps in the formation of highly dispersed
palladium in NaY: I. Pd ion coordination and migration, J. Catal. 117 (1989), pp. 91-101.
[14] G. Bergeret, P. Gallezot, B. Imelik, X-ray study of the activation, reduction, and
reoxidation of palladium in Y-type zeolites, J. Phys. Chem. 85 (1981), pp. 411-416.
[15] A. Kleine, P.I. Ryder, N.I. Jaeger, G. Schulz-Eklofff, Electron microscopy of Pt, Pd and
Ni particles in a NaX zeolite matrix, Journal of the Chemical Society, Faraday Transactions 1:
Physical Chemistry in Condensed Phases, 82 (1986), pp. 205-212.
[16] T. Beutel, Z. Zhang, W.M.H. Sachtler, H. Knozinger, Temperature Dependence of
Palladium Cluster Formation in NaY and 5A Zeolites, J. Phys. Chem. 97 (1993), pp.
3579-3583.
[17] X. Zhao, Y. Hu, L. Liang, C. Liu, J. Liao, W. Xing, Ionic Liquid mediated synthesis of
‘clean’ palladium nanoparticles for formic acid electrooxidation, Int. J. Hydrogen Energy
37(1) (2012), pp. 51-58.
[18] L.Q. Xu, Z.C. Zhang, B. Marshik, W.M.H. Sachtler, Hydrogen isotope exchange on
Pd/NaY and Pd/HY zeolites, Catal. Lett. 10(1-2) (1991), pp. 121-129.
[19] B.E. Conway, B.V. Tilak, Interfacial processes involving electrocatalytic evolution and
oxidation of H2, and the role of chemisorbed, H. Electrochem Acta 47(22-23) (2002), pp.
3571-3594.
[20] J.X. Wang, T.E. Springer, P. Liu, M. Shao, R.R. Adzic, Hydrogen oxidation reaction of
Pt in acidic media: adsorption isotherm and activation free energies. J. Phys. Chem. C111(33)
22
[21] J. Durst, C. Simon, F. Hasché, H.A. Gasteiger, Hydrogen oxidation and evolution
reaction kinetic on carbon supported Pt, Ir, Rh, and Pd Electrocatalysts in Acidic Media. J.
Electrochem. Soc. 162(1) (2015), pp. F190-F203.
[22] J. Yao, Y.F. Yao, Investigation of zeolite supported platinum electrocatalyst for
electrchemical oxidation of small organics species, Int. J. Hydrogen Energy 41(33) (2016),
pp. 14747-14757.
[23] M.S. Tzou, B.K. Teo, W.M.H. Sachtler, Formation of Pt particles in Y-type zeolites: the
influence of co-exchanged metal cations, J. Catal. 113(1) (1988), pp. 220-235.
[24] H.D. Abruna, X-ray absorption spectroscopy in the study of electrochemical system, in:
HD Abruna (Eds.), Electrochemical interface: Modern Techniques for In-Situ Interface
Characterization, VCH Publishers, New York, 1991, Chapter 1, pp. 1-54.
[25] R.E. Benfield, Mean coordination numbers and the non-metal–metal transition in
clusters, J. of the Chemical Society, Faraday Transactions, 88(8) (1992), pp. 1107-1110.
[26] W.M.H. Sachtler, Z.C. Zhang, Zeolite-supported transition metal catalysts, Advances in
Catalysis, 39 (1993), pp. 129-220.
[27] Suarez-Alcantara K, Martinez-Casillas DC, Zheng KB, Zhu Q, Abdellah M, Haase D,
Pullerits T, Solorza-Feria O, Canton SE. SEM and XAS characterization at beginning of life
of Pd-based cathode electrocatalysts in PEM fuel cells. Int. J. Hydrogen Energy 2014; 39(10):
pp. 5358-5370.
[28] J. Yao, Y.F. Yao, Zeolite supported palladium nanoparticle characterization for fuel cell application, Int. J Hydrogen Energy, 42(29) (2017), pp. 18560-18567.
[29] Eftekhari A. Electrocatalysts for hydrogen evolution reaction. Int. J. Hydrogen Energy