1
Longitudinal comparisons of dietary patterns derived by cluster analysis in 7 to 13 year
1
old children
2
Kate Northstone1 PhD 3
Andrew D.A.C. Smith1 PhD 4
P.K. Newby2,3,4 ScD, MPH, MS 5
Pauline M. Emmett1 PhD 6
1 School of Social and Community Medicine, University of Bristol
7
2 Department of Pediatrics and Program in Graduate Medical Nutrition Sciences, Boston
8
University School of Medicine, 88 East Newton Street, Vose Hall 308, Boston, MA 02188, USA 9
3 Department of Epidemiology, Boston University School of Public Health,
10
88 East Newton Street, Vose Hall 308, Boston, MA 02188, USA 11
4 Program in Gastronomy, Culinary Arts, and Wine Studies, Metropolitan College at Boston
12
University, Boston, MA 02215 USA 13
14
Corresponding author
15
Kate Northstone 16
School of Social and Community Medicine, University of Bristol 17
Oakfield House, Oakfield Road, Clifton, Bristol, BS8 2BN 18
United Kingdom 19
Tel: +44 117 3310040 Fax: +44 117 3310080 20
Email: [email protected] 21
2
Abstract
23
Little is known about changes in dietary patterns over time. This study aims to derive dietary 24
patterns using cluster analysis at 3 ages in children and track these patterns over time. Three-25
day diet diaries were completed for children from the Avon Longitudinal Study of Parents 26
and Children (ALSPAC) at 7, 10 and 13 years. Children were grouped based on the 27
similarities between average weight consumed (g/day) of 62 food groups using k-means 28
cluster analysis. Four clusters were obtained at each age, with very similar patterns being 29
described at each time point: Processed (high consumption of processed foods, chips and soft 30
drinks), Healthy (high consumption of high-fibre bread, fruit, vegetables and water), 31
Traditional (high consumption of meat, potatoes and vegetables) and Packed Lunch (high 32
consumption of white bread, sandwich fillings and snacks). The number of children 33
remaining in the same cluster at different ages was reasonably high: 50% and 43% of 34
children in the Healthy and Processed clusters respectively at age 7 were in the same clusters 35
at age 13. Maternal education was the strongest predictor of remaining in the Healthy cluster 36
at each time point – children whose mothers had the highest level of education were nine 37
times more likely to remain in that cluster compared to those with the lowest. Cluster analysis 38
provides a simple way of examining changes in dietary patterns over time and similar 39
underlying patterns of diet at 3 ages during late childhood, persisted through to early 40
adolescence. 41
42
Keywords: dietary patterns, children, cluster analysis, ALSPAC, adolescence, diet diaries, 43
tracking 44
3
Introduction
46
Dietary intake is associated with many health outcomes. When investigating these 47
associations, particularly with health outcomes occurring in adulthood, it is important to 48
consider the effect of diet over the whole life course (1). Diet may have a cumulative effect 49
and there may be critical periods during which diet is particularly important. In addition the 50
effects of later diet may be influenced or confounded by previous dietary intakes. Therefore 51
longitudinal modeling of the development and change of diet throughout life may be useful, 52
particularly if started during childhood. 53
Dietary patterns have emerged as an effective way of describing and quantifying diet in 54
nutritional epidemiological studies (2). These methods recognize that foods and drinks are
55
consumed in combination, and enable study of the whole diet, rather than individual foods or 56
nutrients. Cluster analysis is one such method for deriving dietary patterns, which combines 57
individuals into non-overlapping groups based on similarity of dietary intakes. Meaningful 58
dietary patterns derived using cluster analysis among children have been shown in diverse 59
settings, including Australia (3), Germany (4), Great Britain (5, 6), Finland (7), South Korea (8, 9)
60
and the USA (10, 11). The majority of these have used data collected from diet diaries, although 61
some used 24 hour recalls (9, 10) and food frequency questionnaires (FFQs) (6).
62
Despite the diverse cultures represented in the published literature, similar patterns of dietary 63
intake have been identified across studies. Two dichotomous patterns have often been 64
described in adult studies (12-15): These have been labeled either as ‘prudent’ or ‘healthy’, 65
being related to high intakes of fruit, vegetables, cereals and low-fat dairy products or ‘less 66
healthy’, being related to high intakes of meat, processed meats and added sugar. It is quite 67
4 therefore be important to examine any change in dietary patterns over time prior to
69
adulthood. Such changes, during childhood and from childhood into early adulthood, have 70
been investigated with principal components analysis (16, 17) but we are not aware of any 71
studies that have examined them using dietary patterns obtained from cluster analysis. 72
Newby and Tucker note that the “reproducibility of patterns over time may either represent 73
instability of the measurements or actual changes in dietary intakes.” (2) It is therefore unclear 74
whether observed changes are due to the underlying patterns themselves changing or whether 75
it is the individuals in that population who are changing their diet over time (17). Therefore, 76
the purpose of this study is to derive cross-sectional dietary patterns using cluster analysis 77
from diet diary data collected on children between 7 and 13 years of age, and to examine 78
whether these patterns, or the individuals, change over time. 79
5
Subjects and Methods
81
The Avon Longitudinal Study of Parents and Children (ALSPAC) is a population-based birth 82
cohort study investigating environmental, genetic and other influences on development and 83
health (18). Pregnant women living in the Avon health authority area (South West England) 84
with expected dates of delivery between April 1991 and December 1992, inclusive, were 85
eligible to participate. The current study includes children in the core ALSPAC sample, 86
consisting of 14541 pregnancies together with children from an additional 542 eligible 87
pregnancies that were invited to participate at a later date. There were 14535 children alive at 88
1 year of age comprising the baseline sample. Further details can be obtained from the 89
ALSPAC website (http://www.bristol.ac.uk/alspac). Ethical approval was obtained from the 90
ALSPAC Law and Ethics Committee and the Local Research Ethics Committees. 91
Children were invited to attend hands-on research clinics when they were 7, 10 and 13 years 92
of age. The mean age at attendance was 7 years 7 months (s.d. 4 months), 10 years 8 months 93
(s.d. 3 months), and 13 years 10 months (s.d. 2 months) respectively. Prior to each clinic the 94
subjects were sent a 3-day diet diary for care-giver completion at 7 years and child 95
completion at 10 and 13 years, recording all food and drink consumed over two weekdays 96
and one weekend day. During the 10 and 13 years clinics, a nutritionist conducted an 97
interview to clarify portion sizes and any omitted foods and drinks. 24 hour recalls were 98
conducted if the child did not bring a completed diary to the clinic with them (<10% at each 99
time point). Further details on the recording and coding of the dietary data can be found 100
elsewhere (19, 20); briefly the completed diaries were entered into the DIDO (Diet In Data Out) 101
computer program (21), which generated a weight for every food consumed by each child
102
6 of each food consumed over the three days was used.Foods were allocated to 62 groups 104
which were based primarily on the food groups used in FFQs administered to the same 105
subjects (6, 17, 22); additional groups were included to allow for foods not covered by the FFQ 106
(such as salty flavourings and sauces). The average weights (g/day) consumed in each group 107
were used as input variables for cluster analysis. 108
Statistical methods
109
Cluster analysis combines individuals into non-overlapping groups according to the similarity 110
of foods consumed between individuals. Here, similarity between children was measured by 111
the sum of squares of differences in standardized average weights (g/day) of foods consumed 112
in each of the 62 food groups. Cluster solutions are sensitive to extreme values, therefore 113
outliers were removed at that time point (not from other time points, unless they too were 114
outliers); these were defined as children with at least one intake being more than 5 standard 115
deviations higher than the mean, where the mean and standard deviation were calculated from 116
non-zero intakes. The standardization method used was subtraction of the mean and division 117
by the range (23) as there are potential drawbacks of standardization by subtracting the mean
118
and dividing by the standard deviation when performing cluster analysis (24). 119
The cluster analysis used the k-means algorithm, the most common method used in dietary 120
studies (2). This method minimizes the sum of squares of differences between each child and 121
the mean of his/her cluster. The standard k-means algorithm can give incorrect cluster 122
solutions (24) and it was therefore run 100 times, with different starting positions, to find the 123
solution with smallest sum of squares differences. To examine the stability of the final 124
7 number of children allocated to a different cluster gave a measure of stability of the solution. 126
This procedure was repeated five times. 127
We examined 2- to 6-cluster solutions at each time point: Several factors influenced the 128
choice of the number of clusters to retain, including stability of the cluster solutions, and the 129
size and interpretation of each cluster. At each time point the 4-cluster solution was found to 130
be the most interpretable and was also the most reliable (with less than 10% misclassified at 131
each time point – see results for further details). Analysis of variance (ANOVA) and the 132
Tukey-Kramer method aided interpretation of clusters by testing for differences in the means 133
of each food item according to cluster. We chose to give labels to the clusters to assist with 134
reporting, these labels were subjective and based on the foods that were most highly 135
associated with each cluster. The characteristics of children with dietary data were compared 136
with the whole cohort at baseline using chi-square tests and the following characteristics were 137
considered: child ethnicity (white if both parents were white, non-white otherwise), maternal 138
age at delivery, highest level of maternal education, housing tenure, and whether the mother 139
had ever smoked. These characteristics were reported by the mother via self-completion 140
questionnaires administered during pregnancy. Changes in dietary patterns over time were 141
assessed by cross-tabulating cluster solutions at different ages, and calculating the proportion 142
of children remaining in the same cluster between each pair of ages. A sequence index plot 143
(25) was also used to illustrate the changes in cluster membership over time. Logistic
144
regression was used to assess the associations between the characteristics mentioned above 145
and a child consistently belonging to a particular cluster over time. We chose these variables 146
as we have previously shown that they are associated with dietary patterns cross-sectionally. 147
8
Results
149
At age 7, 8299 children attended the clinic with 7285 (88%) providing diet diaries. Of these, 150
6837 (94%) children were available for analysis after outlier removal. At age 10, 7563 151
children attended, 7473 (99%) provided diaries and 6972 (93%) were available after outlier 152
removal. At age 13, 6147 children attended with 6105 (99%) providing diaries and 5661 153
(93%) remained after outlier removal. Dietary data was more likely to be available for girls, 154
white children, children with older, higher educated and non-smoking mothers, and those 155
living in homes that were owned or mortgaged. These inequalities were similar across the 156
three ages (data not shown). 157
A four-cluster solution provided stable clusters with similar interpretations at each age. In 158
stability testing, consisting of five sets of split-sample testing, at most 573 (the maximum 159
from the five sets) children were allocated to different clusters at age 7, at most 460 were 160
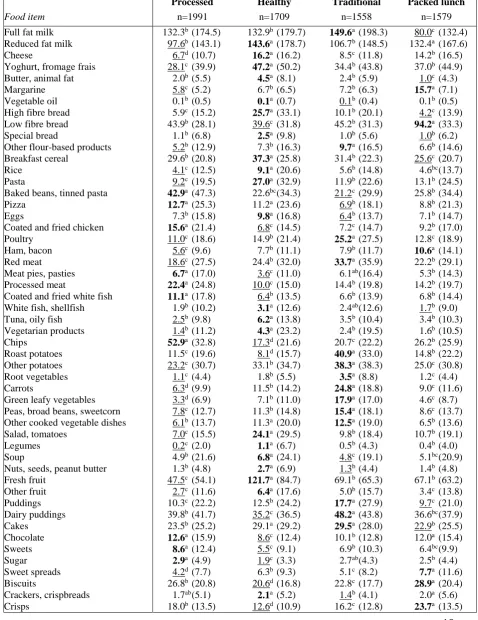
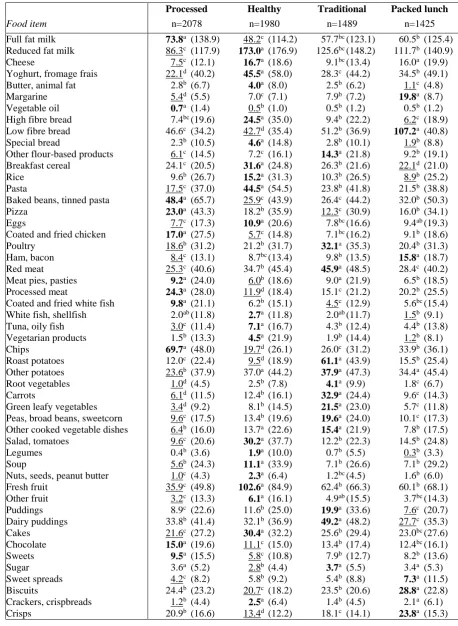
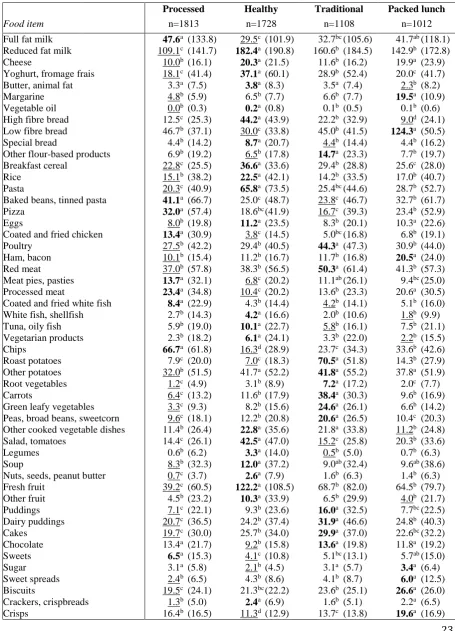
reallocated at age 10, and at most 581 were reallocated at age 13. Tables 1- 3 present the sizes 161
of each cluster, and the mean consumption of each food, according to those clusters that were 162
retained at ages 7, 10 and 13 respectively. The mean amount of each food consumed within 163
each cluster differed between ages, generally increasing as the children got older. However, 164
the patterns of foods consumed, and the foods in each cluster with higher and lower than 165
average consumptions, were similar at each age. 166
The largest cluster at each age, which we chose to label Processed, had higher mean 167
consumption of processed meat, pies and pasties, coated and fried chicken and white fish, 168
pizza, chips, baked beans and tinned pasta, chocolate, sweets, sugar, and diet and regular 169
fizzy drinks compared to the other clusters. The second-largest cluster at each age, which we 170
9 cheese, yoghurt and fromage frais, butter, breakfast cereal, rice, pasta, eggs, fish, vegetable 172
and vegetarian dishes, soup, salad, legumes, fruit, crackers and crispbreads, high energy-173
density sauces (e.g. mayonnaise), fruit juice, and water. The third cluster had higher mean 174
consumption of red meat, poultry, potatoes, vegetables, flour-based products (e.g. Yorkshire 175
pudding), low energy-density sauces (e.g. gravy), puddings, tea and coffee. This cluster was 176
given the label “Traditional”, in line with a traditional British diet. The final cluster had 177
higher mean consumption of white bread, margarine, ham and bacon, sweet spreads (e.g. 178
honey), salty flavourings (e.g. yeast extract), crisps, biscuits, diet squash, tea and coffee. This 179
cluster was labeled “Packed Lunch”, because in school aged children these foods are often 180
eaten in packed lunches. 181
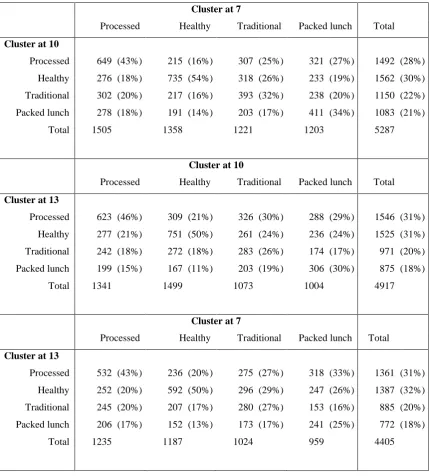
Table 4 shows the cluster membership at 10 and 13 years of age tabulated against cluster 182
membership at 7 years. It also shows the proportion of children who remained in each cluster 183
between ages. The highest proportions staying in the same cluster were seen for the Healthy 184
cluster: 54% of children in this cluster at age 7 remained in it at age 10 and 50% were still in 185
it at age 13. Of those in the Healthy cluster at age 10, 50% remained there at age 13. The 186
Processed cluster at age 7 also showed reasonable stability over time: 43% and 46% of 187
children in this cluster at 7 were still in it at 10 and 13 respectively, while 43% in it at 10 188
remained there at 13. The Traditional and Packed Lunch clusters were less stable with 25% to 189
34% remaining in those clusters over time. The proportion of children who stayed in the 190
same cluster at all three ages was 20%: for individual clusters the greatest stability was seen 191
for the Healthy cluster 33% with the processed cluster second at 22%. Figure 1 illustrates the 192
tracking of cluster membership over time and shows that the most consistent cluster 193
10 Given that the Healthy and Processed clusters showed greater stability and could be
195
considered to represent the two extremes of diet we carried out our association analyses on t 196
these clusters only. It can be seen in Table 5 that mothers with the highest level of education 197
had children who were nearly 9 times more likely to be in the Healthy cluster at all 3 time 198
points compared to the lowest level of education (adjusted OR: 8.83 (95%CI: 4.58, 17.01)). 199
This compared to an adjusted OR of 4.39 (95% CI: 3.05, 6.35) for being in the Healthy 200
cluster at any two time points. Girls were also more likely to remain in the Healthy cluster as 201
were children whose mothers were aged over 30 at delivery and who lived in rented/other 202
accommodation. Staying in the processed cluster at all three ages was much more likely in 203
children who were non-white and who had mothers with the lowest levels of education. 204
205
Discussion
206
In this study four meaningful dietary patterns were consistently identified using cluster 207
analysis among children at 7, 10 and 13 years of age: Processed, with higher consumption of 208
processed, convenience and snack foods; Healthy, with higher consumption of high-fibre, 209
low-fat foods, fruit and vegetables; Traditional, with higher consumption of meat and 210
vegetables, and Packed Lunch; with higher consumption of white bread, sandwich fillings, 211
and snacks. Although the mean amounts of each food consumed changed slightly over time, 212
the relative intakes were similar at each age. Therefore the underlying dietary patterns were 213
comparable at the different ages. Although some children changed between clusters at later 214
ages the most stable clusters were the Healthy cluster followed by the Processed cluster and 215
continued membership of both was highly associated with maternal education level (although 216
11 Several studies have extracted dietary patterns in children using cluster analysis, although to 218
our knowledge none have examined longitudinal changes in cluster interpretation or 219
membership. Dietary patterns can be population dependent and the underlying patterns may 220
differ between studies. However, there are many similarities between the patterns we have 221
described here and those in the literature. A study of British children between 1 and 4 years 222
of age identified three clusters (5). One described a diet with high consumption of prepared 223
meat products, chips and soft drinks, similar to our Processed cluster. A second had a high 224
consumption of wholegrain cereals, low-fat dairy products, fruit and vegetables, similar to 225
our Healthy cluster. The final pattern was identified as a traditional diet and is similar to our 226
Traditional pattern. The lack of a Packed Lunch pattern is most likely due to the children 227
being of a pre-school age. A study of British adults based on 7-day diet diaries found four 228
clusters after stratification by gender (26). One cluster described a dietary pattern with, in men,
229
high consumption of meat products, chips and beer, and in women, high consumption of 230
convenience foods. A second pattern was identified as a traditional British diet. These are 231
similar to our Processed and Traditional patterns respectively. The remaining two clusters 232
were similar to our Healthy pattern. A study based on an FFQ administered to adults in 233
Ireland (27) found three clusters, a pattern with high consumption of meat products, chips and
234
alcohol, a pattern with high consumption of pasta, rice, brown bread, poultry, fish, fruit and 235
vegetables, and a pattern identified as a traditional Irish diet. These are similar (taking into 236
account cultural differences) to our Processed, Healthy and Traditional patterns respectively. 237
It is also worth noting that a comprehensive review of empirically derived dietary patterns 238
reported that Healthy, Traditional and Less-healthy/Processed patterns were the most 239
12 We have previously extracted three dietary patterns from ALSPAC children at 7 years of age 241
based on FFQ data, using cluster analysis (6). These patterns described a diet with high
242
consumption of processed foods, a plant-based, and a traditional British pattern. The Packed 243
Lunch pattern was not evident in the FFQ cluster analysis and this is mostly likely explained 244
by the fact that foods typically found in packed lunches were not identified separately in the 245
FFQ. Cluster analysis of the diet diary data, which provides much greater detail in dietary 246
intakes and specific foods consumed, thus provided better separation of foods compared to 247
the FFQ. 248
Examining cluster membership over time showed that, while children do change their diet, 249
they are more likely to continue following the same dietary pattern as they did at an earlier 250
age: around half of the children continued to follow the same pattern at a later age. This helps 251
to quantify the extent to which dietary patterns are formed in childhood and continue into 252
adolescence, demonstrating that establishing healthy eating habits as early as possible is 253
important. Further research is necessary to quantify the extent to which dietary patterns 254
established in childhood and adolescence are maintained into adulthood. Other studies of 255
British and Irish adults report similar patterns to those observed in this study (12, 15), 256
suggesting that the underlying dietary patterns are similar between children and adults, and 257
healthy or less healthy eating patterns track from childhood. Not surprisingly, children who 258
remained in the Healthy cluster for at least 2 out of the 3 time points were more likely to have 259
higher educated and older mothers. This is similar to the associations we have repeatedly 260
shown with children scoring higher on a ‘Health conscious’ dietary pattern obtained using 261
Principal Components Analysis (22, 28). The same is true of the processed pattern which by
262
13 A particular advantage of the current study is the large sample size. While, the sample is 264
biased towards higher socioeconomic status, it also has the advantage of multiple time points 265
that allowed longitudinal examination of the data. Furthermore the dietary data was collected 266
from diet diaries, which are considered to be the gold standard for self-reported dietary 267
assessment. Given we observed some differences in the patterns reported here antd those 268
derived using FFQ data, our next steps are to repeat this study using FFQ data. Similar work 269
in other populations and age groups are needed to better understand the tracking of dietary 270
patterns from a life-course perspective. 271
Another popular method of obtaining dietary patterns is principal components analysis 272
(PCA). However, cluster analysis has a potential advantage over PCA when examining 273
longitudinal changes in dietary patterns. Specifically, while both methods can identify 274
changes in the underlying patterns, cluster analysis can more clearly demonstrate dietary 275
changes within individuals even when the patterns themselves change over time. For 276
example, it is highly likely in the ALSPAC population that the Packed Lunch pattern will not 277
persist into adulthood. Using cluster analysis we will be able to identify what happens to the 278
diet of those young adults who belonged to the Packed Lunch cluster in childhood. As far as 279
we are aware, this is the only example of a longitudinal study which has examined dietary 280
patterns over time using cluster analysis. The tracking of childhood diets may be an important 281
factor in the development of adult-onset disease and we intend to perform a similar analysis 282
on the dietary patterns obtained using PCA. Such additional studies are needed to continue 283
moving the literature forward. 284
14
Acknowledgements
286
We are extremely grateful to all the families who took part in this study, the midwives for 287
their help in recruiting them, and the whole ALSPAC team, which includes interviewers, 288
computer and laboratory technicians, clerical workers, research scientists, volunteers, 289
managers, receptionists and nurses. The UK Medical Research Council, the Wellcome Trust, 290
and the University of Bristol provide core support for ALSPAC. This work was supported by 291
the World Cancer Research Fund grant number 2009/23. KN designed the study; AS and KN 292
performed the statistical analysis; KN had primary responsibility for final content. All authors 293
contributed to the interpretation of the data and writing the manuscript and approved the final 294
version. The authors declare no conflict of interest. 295
296
15
References
298
1. Kuh D, Ben-Shlomo Y (2004). A life course approach to chronic disease epidemiology, 299
2nd edn. New York: Oxford University Press. 300
2. Newby PK, Tucker KL (2004). Empirically derived eating patterns using factor or cluster 301
analysis: a review. Nutr Rev 62, 177-203. 302
3. Campain AC, Morgan MV, Evans RW, Ugoni A, Adams GG, Conn JA et al. (2003). 303
Sugar-starch combinations in food and the relationship to dental caries in low-risk 304
adolescents. Eur J Oral Sci 111, 316-325. 305
4. Alexy U, Sichert-Hellert W, Kersting M, Schultze-Pawlitschko V (2004). Pattern of long-306
term fat intake and BMI during childhood and adolescence – results of the DONALD Study. 307
International Journal of Obesity 28, 1203-1209. 308
5. Pryer JA , Rogers S (2009). Dietary patterns among a national sample of British children 309
aged 1 1/2–4 1/2 years. Public Health Nutr 12, 957-966. 310
6. Smith ADAC, Emmett PM, Newby PK, Northstone K (2011). A comparison of dietary 311
patterns derived by cluster and principal components analysis in a UK cohort of children. Eur 312
J Clin Nutr 65, 1102-1109. 313
7. Rasanen M, Lehtinen JC, Niinikoski H, Keskinen S, Ruottinen S, Salminen M et al. 314
(2002). Dietary patterns and nutrient intakes of 7-year-old children taking part in an 315
atherosclerosis prevention project in Finland. J Am Diet Assoc 102 , 518-524. 316
8. Song Y, Joung H, Engelhardt K, Yoo SY, Paik HY (2005). Traditional v. modified dietary 317
16 9. Lee JW, Hwang J, Cho HS (2007). Dietary patterns of children and adolescents analyzed 319
from 2001 Korea National Health and Nutrition Survey. Nutr Res Pract 1, p84-88. 320
10. Knol LL, Haughton B, Fitzhugh EC (2005). Dietary patterns of young, low-income US 321
children. J Am Diet Assoc 105, 1765-1773. 322
11. Ritchie LD, Spector P, Stevens MJ, Schmidt MM, Schreiber GB, Striegel-Moore RH et 323
al. (2007). Dietary patterns in adolescence are related to adiposity in young adulthood in 324
black and white females. J Nutr 137, 399-406. 325
12. Margetts BM, Thompson RL, Speller V, McVey D (1998). Factors which influence 326
‘healthy’ eating patterns: results from the 1993 Health Education Authority health and 327
lifestyle survey in England. Public Health Nutrition 1, 193-198. 328
13. Tsai Y, McGlynn KA, Hu Y, Cassidy AB, Arnold J, Engstrom PF et al. (2003). Genetic 329
susceptibility and dietary patterns in lung cancer. Lung Cancer 41, 269-281. 330
14. Millen BE, Quatromoni PA, Nam B, O’Horo CE, Polak JF, Wolf PA et al. (2004). 331
Dietary patterns, smoking, and subclinical heart disease in women: opportunities for primary 332
prevention from the Framingham Nutrition Studies. J Am Diet Assoc 104, 208-214. 333
15. Crozier SR, Robinson SM, Borland SE, Inskip HM, the SWS Study Group (2006). 334
Dietary patterns in the Southampton Women’s Survey. Eur J Clin Nutr 60, 1391-1399. 335
16. Mikkilä V, Räsänen L, Raitakari OT, Pietinen P, Viikari J (2005). Consistent dietary 336
patterns identified from childhood to adulthood: The Cardiovascular Risk in Young Finns 337
17 17. Northstone K, Emmett PM (2008). Are dietary patterns stable throughout early and mid-339
childhood? A birth cohort study. Br J Nutr 100, 1069-1076. 340
18. Golding J, Pembrey M, Jones R, the ALSPAC Study Team (2001). ALSPAC – The Avon 341
Longitudinal Study of Parent and Children. I. Study methodology. Paediatr Perinat 342
Epidemiol 15 74-87. 343
19. Jones LR, Steer CD, Rogers IS, Emmett PM (2010). Influences on child fruit and 344
vegetable intake: sociodemographic, parental and child factors in a longitudinal cohort study. 345
Pub Health Nutr 13: 1122-1130. 346
20. Cribb VL, Jones LR, Rogers IS, Ness AR and Emmett PM (2011). Is maternal education 347
level associated with diet in 10-year-old children? Public Health Nutr 14, 2037-2048. 348
21. Price GM, Paul AA, Key FB et al. (1995) Measurement of diet in a large national survey: 349
comparison of computerised and manual coding of records in household measures. J Hum 350
Nutr Diet 8, 417–428. 351
22. Northstone K, Emmett P, the ALSPAC Study Team (2005). Multivariate analysis of diet 352
in children at four and seven years of age and associations with socio-demographic 353
characteristics. Eur J Clin Nutr 59, 751-760. 354
23. Gnanadesikan R, Kettenring JR, Tsao SL (1995). Weighting and selection of variables for 355
cluster analysis. J Class 12, 113-136. 356
24.Everitt BS, Landau S, Leese M (2001). Cluster Analysis, 4th edn. London: Arnold. 357
25. Kohler U and Brzinsky-Fay C (2005). Stata tip 25: Sequence index plots. The Stata 358
18 26. Pryer JA, Nichols R, Elliott P, Thakrar B, Brunner E, Marmot M (2001). Dietary patterns 360
among a national random sample of British adults. J Epidemiol Community Health 55, 29-37. 361
27. Villegas R, Salim A, Collins MM, Flynn A, Perry IJ (2004). Dietary patterns in middle-362
aged Irish men and women defined by cluster analysis. Public Health Nutrition 7, 1017-1024. 363
28. North K, Emmett P (2000). Multivariate analysis of diet among three-year old children 364
and associations with socio-demographic characteristics. Eur J Clin Nutr 54, 73-80. 365
19
Table 1. Mean (standard deviation) weight (g/day) of foods consumed across clusters for
367
6837 children aged 7 years.
368 369
Processed Healthy Traditional Packed lunch
Food item n=1991 n=1709 n=1558 n=1579
Full fat milk Reduced fat milk Cheese
Yoghurt, fromage frais Butter, animal fat Margarine Vegetable oil High fibre bread Low fibre bread Special bread
Other flour-based products Breakfast cereal
Rice Pasta
Baked beans, tinned pasta Pizza
Eggs
Coated and fried chicken Poultry
Ham, bacon Red meat Meat pies, pasties Processed meat
Coated and fried white fish White fish, shellfish Tuna, oily fish Vegetarian products Chips Roast potatoes Other potatoes Root vegetables Carrots
Green leafy vegetables Peas, broad beans, sweetcorn Other cooked vegetable dishes Salad, tomatoes
Legumes Soup
20 Processed Healthy Traditional Packed lunch
Food item n=1991 n=1709 n=1558 n=1579
Low energy density sauce High energy density sauce Salty flavouring
Water Fizzy drinks Diet fizzy drinks Squash
Diet squash Fruit juice
Flavoured milk drinks Tea, coffee
9.3 0.6 0.2 99.2 54.7 123.1 79.1 203.1 64.5 18.1 39.8
c
c
c
c
a
a
a
b
c
a
a
(11.3) (2.6) (0.9) (135.1) (112.1) (164.1) (142.3) (222.6) (109.4) (49.7) (90.5)
10.2 1.7 0.4 206.3 29.7 40.6 67.5 119.2 134.6 13.0 18.8
c
a
b
a
b
d
b
d
a
b
b
(12.0) (4.3) (1.1) (215.4) (69.3) (81.7) (124.7) (169.5) (156.4) (41.2) (58.0)
26.4 0.8 0.3 156.5 32.4 82.6 75.5 177.8 76.9 13.3 37.5
a
bc
bc
b
b
c
ab
c
b
b
a
(16.9) (2.6) (1.0) (187.0) (76.6) (127.5) (134.5) (208.2) (119.7) (42.2) (82.5)
12.2 0.9 0.6 109.4 28.5 100.7 69.9 285.4 69.9 13.3 41.4
b
b
a
c
b
b
ab
a
bc
b
a
(12.6) (2.7) (1.6) (160.8) (72.3) (145.1) (131.4) (277.3) (113.5) (44.6) (92.4)
370
abcd When values in the same row share a superscript letter, there is no difference (p < 0.05)
371
between cluster means, by the Tukey-Cramer method. 372
373
The highest and lowest mean in each row are bold and underlined, respectively. 374
21
Table 2. Mean (standard deviation) weight (g/day) of foods consumed across clusters for
376
6972 children aged 10 years.
377 378
Processed Healthy Traditional Packed lunch
Food item n=2078 n=1980 n=1489 n=1425
Full fat milk Reduced fat milk Cheese
Yoghurt, fromage frais Butter, animal fat Margarine Vegetable oil High fibre bread Low fibre bread Special bread
Other flour-based products Breakfast cereal
Rice Pasta
Baked beans, tinned pasta Pizza
Eggs
Coated and fried chicken Poultry
Ham, bacon Red meat Meat pies, pasties Processed meat
Coated and fried white fish White fish, shellfish Tuna, oily fish Vegetarian products Chips Roast potatoes Other potatoes Root vegetables Carrots
Green leafy vegetables Peas, broad beans, sweetcorn Other cooked vegetable dishes Salad, tomatoes
Legumes Soup
22 Processed Healthy Traditional Packed lunch
Food item n=2078 n=1980 n=1489 n=1425
Low energy density sauce High energy density sauce Salty flavouring
Water Fizzy drinks Diet fizzy drinks Squash
Diet squash Fruit juice
Flavoured milk drinks Tea, coffee
11.4 1.2 0.2 118.5 113.6 88.3 58.3 137.7 82.9 23.9 44.1
c
c
c
c
a
a
a
b
c
a
b
(14.6) (3.8) (0.8) (183.2) (175.5) (159.2) (106.7) (167.1) (125.5) (68.4) (98.2)
14.9 2.5 0.3 245.8 46.7 39.5 61.0 87.9 176.0 21.3 37.0
b
a
b
a
c
c
a
b
a
a
b
(17.1) (5.3) (1.0) (276.1) (94.4) (101.0) (113.3) (137.6) (179.4) (58.7) (90.6)
35.7 1.4 0.3 177.6 61.1 71.6 58.0 133.3 108.4 23.4 56.5
a
bc
bc
b
b
b
a
b
b
a
a
(21.7) (3.8) (1.0) (238.8) (118.1) (139.4) (112.4) (166.5) (142.8) (67.0) (121.0)
13.8 1.6 0.8 146.6 68.9 82.4 58.5 185.7 95.5 25.1 61.6
b
b
a
d
b
ab
a
a
bc
a
a
(15.2) (4.0) (1.9) (215.8) (133.8) (154.1) (110.9) (199.8) (135.3) (70.0) (126.8) 379
abcd When values in the same row share a superscript letter, there is no difference (p < 0.05)
380
between cluster means, by the Tukey-Cramer method. 381
382
The highest and lowest mean in each row are bold and underlined, respectively. 383
23
Table 3. Mean (standard deviation) weight (g/day) of foods consumed across clusters for
385
5661 children aged 13 years.
386 387
Processed Healthy Traditional Packed lunch
Food item n=1813 n=1728 n=1108 n=1012
Full fat milk Reduced fat milk Cheese
Yoghurt, fromage frais Butter, animal fat Margarine Vegetable oil High fibre bread Low fibre bread Special bread
Other flour-based products Breakfast cereal
Rice Pasta
Baked beans, tinned pasta Pizza
Eggs
Coated and fried chicken Poultry
Ham, bacon Red meat Meat pies, pasties Processed meat
Coated and fried white fish White fish, shellfish Tuna, oily fish Vegetarian products Chips Roast potatoes Other potatoes Root vegetables Carrots
Green leafy vegetables Peas, broad beans, sweetcorn Other cooked vegetable dishes Salad, tomatoes
Legumes Soup
24 Processed Healthy Traditional Packed lunch
Food item n=1813 n=1728 n=1108 n=1012
Low energy density sauce High energy density sauce Salty flavouring
Water Fizzy drinks Diet fizzy drinks Squash
Diet squash Fruit juice
Flavoured milk drinks Tea, coffee
13.8 1.7 0.2 442.3 144.2 103.0 70.0 126.2 112.0 29.7 68.7
d
c
b
d
a
a
a
c
d
a
b
(19.3) (4.7) (0.7) (379.8) (219.8) (199.7) (150.3) (204.8) (163.3) (85.3) (138.2)
22.3 3.6 0.4 711.9 49.8 36.1 62.0 132.1 189.2 16.8 62.5
b
a
b
a
c
c
a
bc
a
b
b
(27.0) (6.9) (1.2) (498.2) (110.1) (101.9) (134.6) (238.6) (204.7) (55.1) (139.3)
43.4 1.9 0.3 552.9 87.9 60.2 58.0 154.4 162.0 23.2 88.0
a
bc
b
c
b
b
a
b
b
ab
a
(30.3) (4.9) (1.2) (438.5) (169.0) (139.4) (134.1) (254.2) (192.4) (65.7) (168.1)
17.7 2.5 0.6 645.6 96.4 72.1 66.1 233.0 131.9 22.4 87.3
c
b
a
b
b
b
a
a
c
b
a
(21.5) (6.6) (1.9) (484.8) (175.0) (150.5) (160.9) (319.6) (185.3) (67.9) (164.0) 388
abcd When values in the same row share a superscript letter, there is no difference (p < 0.05)
389
between cluster means, by the Tukey-Cramer method. 390
391
The highest and lowest mean in each row are bold and underlined, respectively. 392
25
Table 4. Cross-tabulations between cluster membership at different ages.
394 395
Cluster at 7
Processed Healthy Traditional Packed lunch Total
Cluster at 10
Processed
Healthy
Traditional
Packed lunch
Total
649
276
302
278
1505 (43%)
(18%)
(20%)
(18%)
215
735
217
191
1358 (16%)
(54%)
(16%)
(14%)
307
318
393
203
1221 (25%)
(26%)
(32%)
(17%)
321
233
238
411
1203 (27%)
(19%)
(20%)
(34%)
1492
1562
1150
1083
5287 (28%)
(30%)
(22%)
(21%)
Cluster at 10
Processed Healthy Traditional Packed lunch Total
Cluster at 13
Processed
Healthy
Traditional
Packed lunch
Total
623
277
242
199
1341 (46%)
(21%)
(18%)
(15%)
309
751
272
167
1499 (21%)
(50%)
(18%)
(11%)
326
261
283
203
1073 (30%)
(24%)
(26%)
(19%)
288
236
174
306
1004 (29%)
(24%)
(17%)
(30%)
1546
1525
971
875
4917 (31%)
(31%)
(20%)
(18%)
Cluster at7
Processed Healthy Traditional Packed lunch Total
Cluster at 13
Processed
Healthy
Traditional
Packed lunch
Total
532
252
245
206
1235 (43%)
(20%)
(20%)
(17%)
236
592
207
152
1187 (20%)
(50%)
(17%)
(13%)
275
296
280
173
1024 (27%)
(29%)
(27%)
(17%)
318
247
153
241
959 (33%)
(26%)
(16%)
(25%)
1361
1387
885
772
4405 (31%)
(32%)
(20%)
(18%)
396
Table 5: Adjusteda associations between maternal characteristics and cluster
397
membership over time (each group compared to all other combinations of cluster
398
membership; n=1975)
399
Processed cluster at all 3 timepoints (n=240)
Processed cluster at any 2 timepoints (n=692)
Healthy cluster at any 2 timepoints (n=353)
Healthy cluster at all 3 timepoints (n=714) Gender
26
Processed cluster at all 3 timepoints (n=240)
Processed cluster at any 2 timepoints (n=692)
Healthy cluster at any 2 timepoints (n=353)
Healthy cluster at all 3 timepoints (n=714)
Girl (n=2100) 1.25 (0.94, 1.67) 1.07 (0.89, 1.28) 1.51 (1.25, 1.83) 1.45 (1.12, 1.87)
Ethnicity White (n=3575) Non-white (n=109)
1.00
2.28 (1.11, 4.68)
1.00
1.24 (0.70, 2.19)
1.00
1.38 (0.81, 2.36)
1.00
0.94 (0.45, 1.97)
Maternal age ≤ 24 (n=292) 25 – 30 (n=1157) 30+ (n=1240)
1.00
0.99 (0.64, 1.53) 0.73 (0.46, 1.15)
1.00
1.00 (0.75, 1.35) 0.91 (0.67, 1.23)
1.00
1.29 (0.88, 1.91) 1.94 (1.32, 2.85)
1.00
1.42 (0.75, 2.70) 3.35 (1.80, 6.22)
Maternal educationb < O level (n=616) O level (n=1324) >O Level (n=1786)
1.00
0.94 (0.65, 1.35) 0.51 (0.33, 0.77)
1.00
0.80 (0.62, 1.02) 0.67 (0.52, 0.86)
1.00
1.83 (1.25, 2.69) 4.39 (3.05, 6.35)
1.00
2.33 (1.16, 4.70) 8.83 (4.58, 17.01)
Maternal smoking Never (n=2238) Ever (n=1501)
1.00
0.96 (0.71, 1.30)
1.00
1.00 (0.83, 1.21)
1.00
1.05 (0.86, 1.27)
1.00
1.02 (0.78, 1.34)
Housing tenure
Owned/Mortgaged (n=3240) Council/Housing assoc (n=215) Rented/Other (n=258)
1.00
1.06 (0.60, 1.88) 0.89 (0.48, 1.64)
1.00
1.32 (0.92, 1.91) 1.12 (0.77, 1.64)
1.00
0.69 (0.37, 1.31) 1.43 (0.97, 2.09)
1.00
0.39 (0.09, 1.65) 2.43 (1.51, 3.92)
a each factor adjusted for all other factors in the table
400
b O levels are examinations achieved at the age of 16
27
Figure 1: Sequence Index Plot illustrating changes in cluster membership over time