Evolution of Lesions in Susac Syndrome at
Serial MR Imaging with Diffusion-Weighted
Imaging and Apparent Diffusion
Coefficient Values
Matthew L. White, Yan Zhang, and Wendy R. K. Smoker
BACKGROUND AND PURPOSE:Susac syndrome is a rare disorder consisting of encepha-lopathy, hearing loss, and retinal arteriolar occlusions. The purpose of this study was to evaluate the evolution of lesions in this disease by using serial MR imaging with diffusion-weighted imaging (DWI) and apparent diffusion coefficients (ADCs). Abnormalities in the nonlesional white matter (NLWM) were also analyzed.
METHODS:Serial MR and DWI findings in two patients with Susac syndrome were reviewed retrospectively. ADCs of the lesions and the NLWM were compared with values of the corre-sponding anatomical regions in 16 control subjects.
RESULTS: T2-weighted images, DWIs, and fluid-attenuated inversion-recovery (FLAIR) images demonstrated diffuse small hyperintense lesions predominantly involving the corpus callosum, white matter, cerebral cortex, and deep gray structures. During the whole course in the two patients, 437, 295, and 113 lesions were depicted on FLAIR images, T2-weighted images, and DWIs, respectively. With the aggravation and mitigation of the clinical symptoms, the size and number of the lesions changed over time. Of 65 lesions with measured ADCs, six had restricted ADCs (5.29 – 6.91 ⴛ 10ⴚ4 mm2/s), and 29 had elevated ADCs (8.02–13.5 ⴛ 10ⴚ4 mm2/s). With disease progression, ADCs in the NLWM changed from normal to elevated; this corresponded to the diffuse signal-intensity change seen in the white matter.
CONCLUSION:FLAIR imaging is the most sensitive sequence for detecting lesions of Susac syndrome. DWI is useful in demonstrating the heterogeneous nature of lesions, depicting occult abnormalities in the white matter, elucidating underlying pathologic processes, and conducting patient follow-up.
Susac syndrome is a rare disease that Susac et al first described in 1979 (1). It is characterized by acute or subacute encephalopathy, sensorineural hearing loss, and occlusions of the retinal artery branch caused by a microangiopathy involving the brain, cochlea, and retina. The pathogenesis of this syndrome is un-known. The disease may have a self-limited course, but patients usually have residual cognitive, visual, and/or hearing disability (2, 3).
Brain imaging is part of the routine diagnostic evaluation for suspected Susac syndrome, given the
involvement of the CNS. MR imaging is expected to provide an exquisite evaluation of the lesions of Susac syndrome because microinfarctions are believed to be the basic histologic feature of the lesions (2–5). In addition to T2-weighted and fluid-attenuated inver-sion-recovery (FLAIR) imaging, diffusion-weighted imaging (DWI) and apparent diffusion coefficients (ADCs) have been proved to be sensitive to the his-tologic and physiologic changes associated with brain infarction and are useful in assessing these changes over time (6–9). We therefore hypothesized that DWI and ADCs enable a unique analysis of the lesions in Susac syndrome, which pathologically consist of changes con-sistent with areas of microinfarction.
The purpose of this study was to describe the evo-lution of multiple lesions in patients with Susac syn-drome on serial MR images, with DWIs, ADC values, T2-weighted images, and FLAIR images. Abnormalities in the nonlesional white matter (NLWM) were also analyzed. A number of case reports on Susac syndrome Received June 30, 2003; accepted after revision October 6.
From the Department of Radiology, University of Iowa College of Medicine, Iowa City.
Presented at the 41th annual meeting of the American Society of Neuroradiology, Washington, DC, April–May 2003.
Address reprint requests to Matthew L White, MD, 3959 JPP, Department of Radiology, University of Iowa College of Medicine, Iowa City, IA 52242.
©American Society of Neuroradiology
have described the MR appearance of the brain (2–5, 10–19); however, only a few include the serial MR appearance (3, 4). To our knowledge, DWI and ADCs in patients with Susac syndrome have not been previously described.
Methods
We retrospectively reviewed serial MR findings, including those of DWIs, in two patients with Susac syndrome. Each was imaged four times within 8 or 11 months. ADC values were calculated for 65 noncortical lesions (36 in patient 1, 29 in patient 2) and 64 regions in NLWM. These values were quantitatively compared with ADC values from corresponding anatomic regions in 16 control subjects. An additional 45 cortical lesions were not included in the statistical analysis because of possible partial vol-uming of CSF into the ADC measurements. The institutional review board at our hospital approved this study.
Patient Histories and Clinical Presentations
Patient 1.— A 21-year-old African American woman pre-sented with a 2-week history of encephalopathy. Fluorescein angiography showed an occlusion of the right retinal artery branch. She was treated with steroid therapy and, within 2 weeks, her symptoms moderately improved. The patient was readmitted with recurrent encephalopathy 8 weeks after the initial onset. Fluorescein angiography showed two new occlu-sions of the left retinal artery branch, and audiography dem-onstrated high-frequency hearing loss on the left side. Her condition substantially improved after 2 months of steroid therapy. Over the next 8 months, the patient appeared to have improved, as she was discharged with steroid treatment. An ophthalmologic examination was performed at 9 months from initial onset, and her condition was stable with no new occlu-sion of the retinal artery branch. After that, she failed to keep her clinic appointment.
Patient 2.— A 49-year-old woman presented with acute onset of partial vision loss in the right eye and a 2-week history of headaches. Fluorescein angiography showed an occlusion of the right retinal artery branch and a visible embolus. She was treated with aspirin and discharged home in stable condition about 1 month later. The patient was readmitted with enceph-alopathy at 6 weeks after her initial presentation. Ophthalmo-logic examination showed a new occlusion of the retinal artery branch in her left eye. She was treated with immunosuppressive therapy. About 1 month later, the encephalopathy was notably improved. However, it relapsed 4 months later, at which time ophthalmoscopy showed new occlusions of the retinal artery branch in her left eye. An audiogram demonstrated partial hearing loss in the right ear. After treatment with more-aggres-sive steroid therapy, she had good clinical improvement. At 11 months from initial onset, the patient presented with worsening vision and encephalopathy. She received steroid therapy again and improved somewhat. In the following year, her symptoms recurred repeatedly and mitigated after treatment. After about 2 years from initial onset, the patient had major improvement with no vision or hearing impairment.
Diagnosis of Susac Syndrome.—In both the patients, exten-sive hematologic studies, including autoimmune panels, were unremarkable. Four-vessel cerebral angiograms were normal. In each case, Susac syndrome was diagnosed on the basis of coexistent encephalopathy, retinal artery occlusions, and hear-ing dysfunction. The clinical course, symptoms, auditory find-ings, retinal findfind-ings, and treatments in the two patients are summarized in Table 1.
Image Acquisition
The initial (2 weeks from onset) and third (10 weeks from onset) MR examinations in patient 1 were performed with a
1.5-T superconducting magnet (Magnetom Vision; Siemens, Erlangen, Germany). Conventional MR imaging included an axial T1-weighted spin-echo (SE) sequence (TR/TE, 700/14 or 600/14; matrix, 256⫻512 or 192⫻512; field of view, 24⫻24), an axial T2-weighted fast SE sequence (TR/TE, 3986/99; ma-trix, 264⫻1024 or 308⫻1024; field of view, 24⫻24), and a FLAIR sequence (TR/TE/TI, 9000/105/2700; matrix, 182 ⫻ 256; field of view, 24 ⫻ 24). Before the administration of contrast agent, axial DWIs were acquired by using a single-shot echo-planar imaging sequence (TR/TE, 5400/103; matrix, 96⫻ 200; field of view, 25⫻25). A reference T2-weighted intensity image (b⫽0.0 s/mm2) and three orthogonally oriented DWIs (b⫽1000 s/mm2) were obtained at each transverse section.
The second (8 weeks from onset) and fourth (8 months from onset) MR examinations in patient 1 and the four examinations (2 and 8 weeks, 4 and 11 months) in patient 2 were performed with a 1.5-T superconducting magnet (Signa; GE Medical Sys-tems, Milwaukee, WI). Conventional MR imaging consisted of an axial T1-weighted SE sequence (583/20; matrix, 192⫻256; field of view, 24⫻24), an axial T2-weighted fast SE sequence (3000/100; matrix, 256⫻256; field of view, 24⫻24), and a FLAIR sequence (9002/165/2700; matrix, 182⫻256; field of view, 24 ⫻24). Before the administration of contrast agent, axial DWIs were acquired by using a single-shot echo-planar imaging sequence with a TR/TE of 5000/94.7, a matrix of 128⫻ 128, and a field of view of 32⫻32. A reference T2-weighted intensity image (b ⫽0.0 s/mm2) and a diffusion trace image (b ⫽1000 s/mm2) were obtained at each transverse section. The latter was an image with minimized diffusion anisotropy and created from the average of three orthogonal diffusion directions.
All images were acquired with a section thickness of 5 mm and an intersection gap of 2 mm. Contrast-enhanced axial and coronal T1-weighted images, obtained after injection of gado-pentetate dimeglumine (0.1 mmol/kg), were obtained at the initial and second examinations in patient 1 and at every ex-amination in patient 2.
Sixteen control subjects without neurologic symptoms were also imaged with identical protocols (10 with the GE Medical Systems unit and six with the Siemens unit).
Image Analyses
Lesion location, number, size, signal intensity, and enhance-ment were evaluated. How these findings changed over time were studied. A lesion was defined as a focus of hyperintensity, as depicted on T2-weighted images, FLAIR images, and/or DWIs. Some small hyperintensities, which appeared in a clus-ter patclus-tern (especially in the corpus callosum) were counted as multiple lesions, though some might have been different parts of a single lesion. Because of the lack of clear separation, it was sometimes difficult to determine which were individual lesions or parts of a single lesion.
DWIs were reviewed on a workstation (ADW 4.0; GE Med-ical Systems). ADC values were calculated as follows: ADC⫽ ⫺[ln(S/S0)]/b, where Sis the signal intensity of the region of
interest obtained through three orthogonally oriented DWIs or diffusion trace images,S0is the signal intensity of the region of
by calculating az-score. A significant difference was accepted if thez-score was above 2 or below –2.
ADC values of NLWM were also measured and compared with the mean values of white matter from the control subjects. NLWM was defined as white matter without visible focal ab-normalities on T2-weighted images, FLAIR images, or DWIs. The statistical significance of differences was determined by using the paired t test. Changes in signal intensity in the NLWM were also evaluated.
Results
Lesions at MR Imaging
Patient 1.— The initial MR examination, per-formed 2 weeks after onset of symptoms, demon-strated extensive small T2 hyperintensities in the ce-rebral white matter, corpus callosum, bilateral basal ganglia, bilateral middle cerebellar peduncles, and bilateral cerebellar hemispheres. The lesions were predominantly supratentorial. Particularly distinct was a cluster of lesions in the corpus callosum. On FLAIR images, the lesions were also hyperintense, and most were more conspicuous than on other im-ages. Lesions in the cerebral cortex were not well seen on T2-weighted images and better depicted on FLAIR images (Fig 1A–D). The total number of lesions was at least 57 on T2-weighted images and 68 on FLAIR images. The largest diameter of most le-sions varied from several millimeters to about 10 mm.
The lesions on T1-weighted images, especially those in the corpus callosum, were seen as small hypointen-sities. On contrast-enhanced T1-weighted images, multiple, tiny foci of enhancement were found in the cerebellar hemispheres and basal ganglia bilaterally. Diffuse leptomeningeal enhancement was also noted (Fig 1E). DWIs depicted at least 19 hyperintense lesions in the cerebral white matter, basal ganglia, cerebellum, and corpus callosum (Fig 1F). The sec-ond MR examination, at the time of relapse, was performed 8 weeks after the initial onset of symp-toms. T2 and FLAIR hyperintensities previously seen in the corpus callosum and cerebellar hemispheres were decreased in size and number. Some lesions could not be detected. There was no evident enhance-ment of these small lesions, though leptomeningeal enhancement persisted. Numerous new hyperintense punctate lesions were found in the cerebral cortex, mainly on FLAIR images and DWIs (Fig 2). In ad-dition, several questionable, tiny T2 and FLAIR hy-perintensities appeared in the posterior limbs of the internal capsules. Because of the normal variation of cortical contrast on brain DWIs, separating subtle lesions in the cortex from this normal variation is difficult. Therefore, judgments about the presence of subtle cortical lesions were subjective.
[image:3.603.55.532.69.394.2]On the third MR examination, performed about 2 weeks after the second examination (10 weeks after TABLE 1: Clinical histories and presentations in patients with Susac syndrome
Clinical course Symptoms MR Examination Auditory Findings Retinal Findings Treatment*
Patient 1
Initial admission, 2 wk after onset
Headaches, vomiting, R arm feeling loss, impaired balance, urinary incontinence, dysarthria, decreased attention span, gait ataxia
2 wk after onset Normal R branch retinal artery occlusion
IV SoluMedrol 1 g/d ⫻5, IVIG 0.4 g/d ⫻5, prednisone 60 mg/d (with taper)
Symptom relapse, 8 wk after initial onset
Headaches, cognitive decline, clumsiness, worsened gait ataxia, upper extremity ataxia
8 and 10 wk after initial onset
L high-frequency hearing loss
New L branch retinal artery occlusion
IVIG 0.4 g/d⫻5, prednisone 50 mg/d (with taper) Stable condition,
8–9 mo after initial onset
Difficult in tandem walking, mild dysmetria
8 mo after initial onset
No change No new occlusion Prednisone 20 mg/d
Patient 2
Initial admission, 2 wk after onset
Headaches, R partial vision loss 2 wk after onset Normal R branch retinal artery occlusion
Aspirin
Symptom relapse, 6 wk after initial onset
Headaches, R face and arm numbness
6 wk after initial onset
Normal New L branch retinal artery occlusion
IV methylprednisolone 1 g⫻1, prednisone 80 mg/d (with taper) Symptom relapse, 4
mo after initial onset
L arm parethesias, R extremity weakness, staggering walking
4 mo after initial onset
R partial hearing loss
New R/L branch retinal artery occlusion
IVIG 0.4 g/d⫻5 (monthly basis for 4 consecutive mo), prednisone 60 mg/d (with taper) Worsening
symptoms, 11 mo after initial onset
Worsening in vision, poor concentration, confusion, impaired balance
11 mo after initial onset
No change No change IVIG 0.4 gm/d⫻5 (almost every 6–8 wk for 1 y) Stable condition, 2 y
later
Mild ataxia, poor tandem Normal Normal
FIG 1. Patient 1. Initial MR examination at 2 weeks from the onset of symptoms.
AandB, Axial T2-weighted images show multiple hyperintense lesions involving the corpus callosum and cerebral white matter. CandD, Axial FLAIR images at almost the same levels as inAandBshow hyperintense lesions not only in the corpus callosum and cerebral white matter but also in the cerebral cortex (arrows).
E, Contrast-enhanced axial T1-weighted image shows diffuse leptomeningeal enhancement.
F, Axial DWI shows several hyperintense lesions in the cerebral white matter (arrows), with a cluster of lesions in the corpus callosum.
FIG 2. Patient 1. Second MR examination shortly after relapse of the symptoms (8 weeks from initial onset).
AandB, Axial FLAIR images show that the lesions in the corpus callosum have decreased in size and number compared with those in Figure 1. However, new punctate hyperintense lesions appeared in the cerebral cortex (arrows).
initial onset of symptoms), cortical lesions had obvi-ously decreased in number. However, the question-able, tiny lesions in the posterior limbs of the internal capsules had increased in size and signal intensity. In addition, T2-weighted and FLAIR images showed multiple, small lesions in the thalami, posterior limbs of the internal capsules, corpus callosum, cerebellar hemispheres, and dentate nuclei (Fig 3A and B). These new lesions could not be clearly identified on T1-weighted images. DWIs showed three lesions in the corpus callosum and one in the right caudate head (Fig 3C). The latter was not depicted on either FLAIR or T2-weighted images.
The fourth MR examination, 8 months after initial onset of symptoms, showed volume loss with in-creased prominence of sulci and ventricles (Fig 4). Diffuse, scattered hyperintensities persisted on T2-weighted and FLAIR images, though they were fewer in number and decreased in size. No lesions were detected on DWIs.
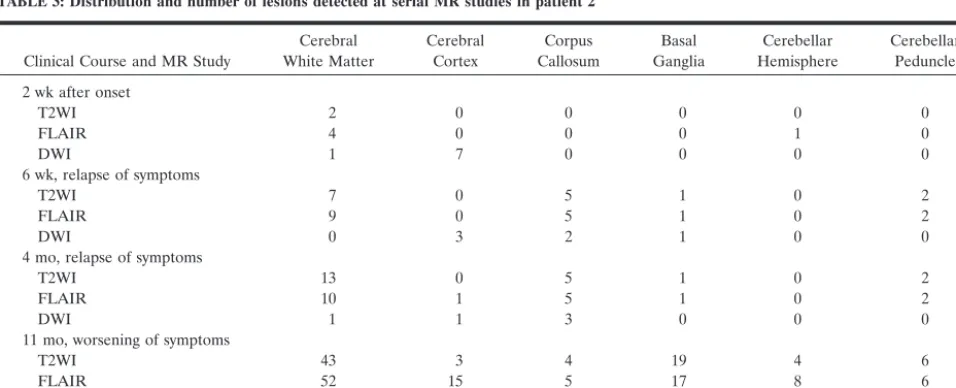
Patient 2.— On the initial MR examination, per-formed 2 weeks after onset of symptoms, T2-weighted and FLAIR images showed several small lesions scat-tered in the white matter and the cerebellar hemi-sphere. Seven cortical lesions depicted on DWIs were not found on either FLAIR or T2-weighted images. On the second and third MR examinations, when clinical symptoms recurred, the number of lesions increased, and new lesions appeared in the corpus callosum and basal ganglia. The fourth MR examina-tion was performed 11 months after the first. The patient had worsening of symptoms, and the number of lesions in the white matter, cortex, basal ganglia, and cerebellum increased dramatically. The ventricles also enlarged slightly, suggesting the development of mild brain atrophy. Diffuse leptomeningeal enhance-ment was noted. Tables 2 and 3 summarize the dis-tribution and number of lesions on the serial MR examinations, respectively.
ADC Values of Lesions
ADCs were calculated for 65 lesions, which were detected as hyperintensities on DWIs in both pa-tients. These values were compared with mean ADC values from corresponding anatomic regions in 16 control subjects, in whom the mean ADCs were 6.60– 7.70⫻10⫺4mm2/s for one imaging unit (GE Medical
Systems) and 6.98–7.84 ⫻ 10⫺4mm2/s for the other
(Siemens).
FIG 3. Patient 1. Third MR examination at 2 weeks following relapse of the symptoms (10 weeks from initial onset).
AandB, Axial FLAIR images show multiple hyperintense lesions in the basal ganglia and thalami bilaterally, as well as in the left cerebellar peduncle and left dentate nucleus. A questionable small lesion is seen in the cortex (arrowinA).
C, Axial DWI shows a hyperintense lesion in the right caudate head (arrow), which was not depicted by either FLAIR or T2-weighted images (not shown).
In addition to the results described next, 45 cortical lesions were also measured in the two patients (32 in patient 1 and 13 in patient 2). Most of these lesions had increased ADC values, which might have been inaccu-rate because of partial-volume effects with the CSF.
Patient 1.— Of the 19 lesions measured on the first examination, four (two in the corpus callosum, one in the white matter, and one in the cerebellar
hemi-sphere) had restricted ADCs (5.29–6.71 ⫻
10⫺4mm2/s) withz-scores⬍⫺2, three (all in the
cor-pus callosum) had elevated ADCs (9.55–9.76 ⫻ 10⫺4mm2/s) withz-scores ⬎2, and 12 (six in the
cor-pus callosum, three in the basal ganglia, one in the white matter, and two in the cerebellar hemisphere) had ADCs in the normal range withz-scores⬍2 and ⬎⫺2. Of the 13 lesions measured on the second examination, 11 (eight in the corpus callosum and three in the white matter) had elevated ADCs (8.58– 13.50⫻10⫺4mm2/s), and two had ADCs in the
nor-mal range (one in the basal ganglia and one in the white matter). Among the four lesions measured on the third examination, two (one in the corpus callo-sum and one in the basal ganglia) had restricted ADCs (5.45 and 6.91 ⫻ 10⫺4mm2/s), one (in the
corpus callosum) had elevated ADCs (9.86 ⫻
10⫺4mm2/s), and one (in the corpus callosum) had
ADC values in normal range. On the last examina-tion, no ADC values were measured because DWIs showed no hyperintense foci.
Patient 2.— The 29 measured lesions included one in the cerebral white matter from the first examina-tion, three (two in the corpus callosum and one in the basal ganglia) from the second examination, four (three in the corpus callosum and one in the right hemispheric white matter) from the third examina-tion, and 21 (seven in the corpus callosum, five in the basal ganglia, seven in the cerebral white matter, and two in the cerebellar peduncle) from the fourth exami-TABLE 2: Distribution and number of lesions detected at serial MR studies in patient 1
Clinical Course and MR Study
Cerebral White Matter
Cerebral Cortex
Corpus Callosum
Basal Ganglia
Cerebellar Hemisphere
Cerebellar Peduncle 2 wk after onset
T2WI 18 0 22 5 4 8
FLAIR 22 15 20 5 2 4
DWI 2 0 11 3 3 0
8 wk, relapse of symptoms
T2WI 28 0 14 4 0 6
FLAIR 31 37 15 5 0 1
DWI 4 32 9 1 0 0
10 wk, relapse of symptoms
T2WI* 13 0 16 20 4 1
FLAIR 32 6 17 23 11 1
DWI 0 0 5 1 0 0
8 mo, stable condition
T2WI 4 0 7 3 0 1
FLAIR 2 0 3 3 0 1
DWI 0 0 0 0 0 0
Note.—T2WI indicates T2-weighted imaging.
[image:6.603.54.540.71.264.2]* Some small lesions could not be identified because of motion artifact.
TABLE 3: Distribution and number of lesions detected at serial MR studies in patient 2
Clinical Course and MR Study
Cerebral White Matter
Cerebral Cortex
Corpus Callosum
Basal Ganglia
Cerebellar Hemisphere
Cerebellar Peduncle 2 wk after onset
T2WI 2 0 0 0 0 0
FLAIR 4 0 0 0 1 0
DWI 1 7 0 0 0 0
6 wk, relapse of symptoms
T2WI 7 0 5 1 0 2
FLAIR 9 0 5 1 0 2
DWI 0 3 2 1 0 0
4 mo, relapse of symptoms
T2WI 13 0 5 1 0 2
FLAIR 10 1 5 1 0 2
DWI 1 1 3 0 0 0
11 mo, worsening of symptoms
T2WI 43 3 4 19 4 6
FLAIR 52 15 5 17 8 6
DWI 7 2 7 5 0 2
[image:6.603.57.535.310.504.2]nation. No lesion had a restricted ADC value. Of the 13 lesions with elevated ADCs (8.02–10.50⫻10⫺4mm2/s),
12 were found on the fourth examination (three in the corpus callosum, four in the basal ganglia, and five in the white matter), and one (in the corpus callosum) was found on the second examination.
Abnormalities of NLWM
In both patients, T2-weighted and FLAIR images on the last examinations showed extensive and con-fluent, mildly increased signal intensity throughout the deep NLWM (Fig 4). Also on the third examina-tion of patient 1, minimally increased signal intensity was observed near the bodies of the lateral ventricles. Mean ADC values of the NLWM were elevated on the second, third, and fourth examinations in patient 1 (8.02–8.44⫻10⫺4mm2/s) and on the fourth
exam-ination in patient 2 (7.92⫻10⫺4mm2/s). ADCs were
significantly different from the mean ADCs in white matter in the control subjects (7.20⫻10⫺4mm2/s GE
unit, 7.35 ⫻ 10⫺4mm2/s Siemens unit; P ⬍ .05 for
both patients).
Discussion
T2-weighted MR images usually show multiple, small hyperintense lesions in patients with Susac syn-drome. The lesions are predominately supratentorial, with a predilection for the corpus callosum, though they can also be found in the cerebellum and mid-brain (2–5, 10–19). On the basis of the clinicopatho-logic findings, it is known that the gray matter is often involved in Susac syndrome (2–5, 13). However, some have reported that T2-weighted images usually show lesions, which appear mainly in the white matter be-cause of the normally increased signal intensity of the gray matter (2) and of the CSF in the sulci; these features can prevent the differentiation of lesions in those areas. In comparison, FLAIR images are more sensitive in depicting the lesions in the gray matter (Figs 1 and 2, Tables 2 and 3) and should be included in routine examinations. In our cases, T2-weighted and FLAIR images demonstrated findings character-istic of diffuse, small hyperintense lesions. The lesions were in the supratentorial white matter and gray mat-ter, the deep gray structures, and the cerebellum. A cluster of lesions was noted in the corpus callosum.
We found contrast enhancement in some lesions and in the leptomeninges (Fig 1E). Acute or subacute lesions and leptomeninges with enhancement have also been reported in previous articles (3, 10, 14, 16). Therefore, contrast-enhanced T1-weighted images should be used routinely in the diagnosis of Susac syndrome. Moreover, enhancing lesions and leptome-ninges could be used as a guide for more accurate biopsy.
In patient 1, multiple, new cortical lesions were found shortly after symptoms relapsed; this was fol-lowed by the appearance of basal ganglia lesions about 2 weeks later (Table 2). These findings are consistent with the fact that gray matter is often
involved in Susac syndrome (2–5, 13), and they also demonstrate that lesions do not always appear syn-chronously. The previous lesions improved or par-tially disappeared over time, and brain atrophy oc-curred by the time of the fourth examination. In patient 2, characteristic MR findings of Susac syn-drome were not found initially. With disease progres-sion, the lesions increased. The multiple lesions mainly appeared 11 months later when the symptom became worse (Table 3).
Susac syndrome often has a chronic relapsing course punctuated by frequent remissions and exacerbations for 1–2 years (3, 10, 11). Imaging findings on timely MR examination could be well correlated with changes in the clinical symptoms. The syndrome is also thought to be due to microinfarction. In nine previous cases (1–5, 13, 17), brain biopsy was performed in the ce-rebral gray matter and white matter or corpus callo-sum. Multiple microinfarctions, with sclerosis of the media and adventitia of small pial and cortical vessels, were characteristic pathologic findings. Microinfarc-tion is attributed to arteriolar occlusions.
DWI is a useful method for depicting ischemic lesions. Many previous reports have described changes in ADC and signal intensity in ischemic le-sions over time (6–9). DWI and ADC values enable a unique analysis of the lesions in Susac syndrome, which are thought to be microinfarctions. In this study, DWIs were not as sensitive as T2-weighted and FLAIR images in the overall detection of lesions in the white matter, corpus callosum, basal ganglia, and cerebellum. However, the hyperintense lesions de-tected on DWIs provide novel insight into the patho-physiology of the disease by enabling an evaluation of the molecular diffusion of water in these lesions. DWIs demonstrated more lesions in the cortex than did T2-weighted images. Overall, FLAIR images demonstrated more cortical lesions than did DWIs; however, on a couple of individual examinations, DWIs were superior to the FLAIR images for dem-onstrating cortical lesions. The clear demonstration of cortical lesions is important for diagnosis and fol-low-up because of the frequent involvement of the cortex in Susac syndrome.
lesions and the values expected in ischemic infarction, another observation incompatible with typical infarc-tion was that some previous lesions could not be detected at follow-up MR imaging. Resolution of lesions was also mentioned in a previous study (10). Therefore, we cannot exclude other pathologic origins, besides infarction, that might cause the lesions of Susac syndrome. Further study is needed to elucidate the meaning of ADC changes in lesions of Susac syndrome. Although experience with DWI of Susac syndrome is limited at this point, attention to the ADC changes may be helpful in determining the stage of lesions.
In both patients, T2-weighted and FLAIR images showed extensive and confluent, minimally increased signal intensity throughout the deep NLWM at 8 and 11 months after symptom onset. Moreover, ADC val-ues became elevated over time in the NLWM. The reason is unknown. Given the presence of arteriolar occlusions in Susac syndrome, a global perfusion or oxygenation disturbance might occur with disease progression. Consequently, the white matter could be in a condition of chronic hypoxic-ischemia that leads to the changes in signal intensity and ADC values.
One limitation of this study is that the ADC changes over time could not be evaluated for specific lesions. The daily time course of ADC changes was not studied because MR examinations were not per-formed that frequently. Further studies in different facilities are necessary before the DWI features can be conclusively established in Susac syndrome.
The most problematic differential diagnosis for Susac syndrome, based on MR imaging is multiple sclerosis (MS). In MS, symptoms usually appear at 20–40 years of age, with a female preponderance. MS also shows T2 hyperintensities in the corpus callosum and white matter. However, the typical findings are ovoid or oblong plaques at the callososeptal interface, with perivenular extension into the deep white mat-ter. Moreover, in contrast with lesions in Susac syn-drome, which commonly involve the cortex (2–5, 10, 12–14), cortical MS plaques are rarely identified with MR imaging (20). Most MS plaques demonstrate increased diffusion on DWI. Rarely, the lesions have restricted diffusion (21). A minority of lesions in Susac syndrome have restricted diffusion; however, in our experience, restricted diffusion is seen in a greater proportion of Susac lesions than in MS plaques. If MR images in a patient with encephalop-athy show multiple lesions of the corpus callosum and cerebral cortex, Susac syndrome should be included in the differential diagnosis, especially when the le-sions demonstrate restricted ADC values.
In summary, we present serial brain MR findings in two patients with Susac syndrome. To our knowledge, this is the first study in which DWI and lesional ADC changes were evaluated in patients with Susac syn-drome. Although the imaging appearance and ADC values in lesions were mixed and nonspecific, we think that DWI is useful in demonstrating the heteroge-neous nature of the lesions, depicting occult abnor-malities in the white matter, in elucidating the
under-lying pathologic processes, and in conducting patient follow-up. Our findings suggest that some lesions in Susac syndrome may not represent areas of microin-farction, as detected pathologically. This possibility is based on the finding of a few lesions with restricted diffusion, even when a patient is promptly imaged in relation to symptom recurrence. Further study is needed to establish the time course of ADC changes and to interpret the pattern of changes.
References
1. Susac JO, Hardman JM, Selhorst JB.Microangiopathy of the brain and retina.Neurology1979;29:313–316
2. Monteiro ML, Swanson RA, Coppeto JR, Cuneo RA, DeArmond SJ, Prusiner SB.A microangiopathic syndrome of encephalopathy, hearing loss, and retinal arteriolar occlusions.Neurology1985;35: 1113–1121
3. O’Halloran HS, Pearson PA, Lee WB, Susac JO, Berger JR. Mi-croangiopathy of the brain, retina, and cochlea (Susac syndrome). A report of five cases and a review of the literature.Ophthalmology 1998;105:1038–1044
4. Heiskala H, Somer H, Kovanen J, Poutiainen E, Karli H, Haltia M. Microangiopathy with encephalopathy, hearing loss and retinal arteriolar occlusions: two new cases.J Neurol Sci1988;86:239–250 5. Barker RA, Anderson JR, Meyer P, Dick DJ, Scolding NJ. Mi-croangiopathy of the brain and retina with hearing loss in a 50 year old woman: extending the spectrum of Susac’s syndrome.J Neurol Neurosurg Psychiatry1999;66:641–643
6. Warach S, Gaa J, Siewert B, Wielopolski P, Edelman RR.Acute human stroke studied by whole brain echo planar diffusion-weighted magnetic resonance imaging.Ann Neurol1995;37:231– 241
7. Schwamm LH, Koroshetz WJ, Sorensen AG, et al.Time course of lesion development in patients with acute stroke. Serial diffusion-and hemodynamic-weighted magnetic resonance imaging.Stroke 1998;29:2268–2276
8. Ahlhelm F, Schneider G, Backens M, Reith W, Hagen T.Time course of the apparent diffusion coefficient after cerebral infarc-tion.Eur Radiol2002;12:2322–2329
9. Romero JM, Schaefer PW, Grant PE, Becerra L, Gonzalez RG. Diffusion MR imaging of acute ischemic stroke.Neuroimaging Clin N Am2002;12:35–53
10. Saw VP, Canty PA Green CM, et al.Susac syndrome: microangi-opathy of the retina, cochlea and brain.Clin Experiment Ophthal-mol2000;28:373–381
11. Yellin MW, Johnson TW.A case of Susac syndrome.J Am Acad Audiol2000;11:484–488
12. Murata Y, Inada K, Negi A.Susac syndrome.Am J Ophthalmol 2000;129:682–684
13. Bogousslavsky J, Gaio J, Caplan LR, et al.Encephalopathy, deaf-ness and blinddeaf-ness in young women: a distinct retinocochleocere-bral arteriolopathy?J Neurol Neurosurg Psychiatry1989;52:43–46 14. Ayache D, Plouin-Gaudon I, Bakouche P, Elbaz P, Gout O.
Mi-croangiopathy of the inner ear, retina, and brain (Susac syn-drome): report of a case.Arch Otolaryngol Head Neck Surg2000; 126:82–84
15. Li HK, Dejean BJ, Tang RA.Reversal of visual loss with hyper-baric oxygen treatment in a patient with Susac syndrome. Ophthal-mology1996;103:2091–2098
16. Petty GW, Matteson EL, Younge BR, McDonald TJ, Wood CP. Recurrence of Susac syndrome (retinocochleocerebral vasculopa-thy) after remission of 18 years.Mayo Clin Proc2001;76:958–960 17. Vila N, Graus F, Blesa R, Santamaria J, Ribalta T, Tolosa E. Microangiopathy of the brain and retina (Susac’s syndrome): two patients with atypical features.Neurology1995;45:1225–1226 18. Notis CM, Kitei RA, Cafferty MS, Odel JG, Mitchell JP.
Microan-giopathy of brain, retina, and inner ear.J Neuro-Ophthalmol1995; 15:1–8
19. Bateman ND, Johnson IM, Gibbin KP.Susac’s syndrome: a rare cause of fluctuating sensorineural hearing loss.J Laryngol Otol 1997;111:1072–1074
20. Osborn AG. Diagnostic Neuroradiology. St Louis: Mosby–Year Book 1994;755–761