1044
MS
Case Report
Clinical Use of Diffusion-Tensor Imaging for Diseases
Causing Neuronal and Axonal Damage
Aziz M. Ulug˘, David F. Moore, Aviva S. Bojko, and Robert D. Zimmerman
Summary: Diffusion-tensor imaging is an emerging
tech-nique that can supply microscopic structural information
about tissue in vivo. With this technique it is possible to
measure the amount of anisotropy of water diffusion within
tissues and to assess the degree to which directionally
or-dered tissues have lost their normal integrity. This study
was performed in four patients to evaluate the feasibility
of applying this technique in clinical situations in which
there is known or suspected damage to white matter tracts.
MR diffusion imaging uses the incoherent
mo-tion of water molecules for tissue contrast. The
dis-placement caused by the incoherent motion during
imaging is on the order of micrometers. In routine
practice, diffusion imaging is used to assess overall
changes in the degree of diffusion
(diffusion-weighted imaging and apparent diffusion
coeffi-cient maps). With these techniques, the effects of
tissue anisotropy are intentionally eliminated. At
this scale, the motion of water molecules is affected
by the tissue microstructure, which in turn
deter-mines the degree of anisotropy. It is possible to
obtain diffusion-sensitive images (diffusion-tensor
imaging) in which this directional information is
measured. This technique can therefore be used to
study white matter fiber tracts, which are highly
ordered and have distinct directions.
Description of the Technique
Subjects were studied with a 1.5-T whole-body MR unit equipped with high-performance gradients (GE Echospeed, Milwaukee, WI) using the manufacturer-supplied quadrature head coil. In addition to the standard imaging protocols (T1-weighted, T2-(T1-weighted, fluid-attenuated inversion-recovery [FLAIR], and contrast-enhanced T1-weighted sequences), we used a diffusion-tensor pulse sequence previously developed and reported by one of the authors, which can measure the diffusion in any arbitrary direction (1, 2) and is based on a single-shot, multisection, spin-echo, echo-planar imaging pulse sequence. Imaging parameters for the diffusion protocol in-cluded 6000/100 (TR/TE), a 128 3128 matrix, 3- to
5-mm-Received September 30, 1998; accepted after revision February 22, 1999.
From the Departments of Radiology (A.M.U., R.Z.) and Neurology (D.F.M., A.S.B.), Cornell University Medical Col-lege-New York Presbyterian Hospital, New York.
Address reprint requests to Aziz M. Ulug˘, PhD, Department of Radiology, Box 141, Cornell University Medical College, 1300 York Ave, New York, NY 10021.
qAmerican Society of Neuroradiology
thick interleaved data acquisition, with approximately 30 sec-tions to cover the whole brain. Using this sequence, we collected the diffusion-weighted images in six or seven direc-tions (x, y, z, x1y, x1z, y1z, x1y1z) in order to calculate the six independent components of the diffusion tensor. The max-imum b-value used with a single gradient was 84,000 s/cm2.
The data acquisition time for the diffusion part of the exami-nation ranged from 5 to 10 minutes depending on the number of diffusion-weighted images (eight to 28) acquired.
The images were transferred to a workstation (Sun Micro-systems, Mountain View, CA). Using a multivariate fitting rou-tine written in C, we calculated six diffusion maps correspond-ing to the six independent elements of the diffusion tensor. From these diffusion maps, we calculated an orientationally invariant average diffusion map (Dav 5Trace { }/3) and anD
orientationally invariant anisotropy map using anisotropy in-dex UAsurf. This anisotropy index is calculated by comparing
the Dav with the Dsurf, which is a new diffusion constant ob-tained from the surface of the diffusion ellipsoid (3). The an-isotropy index is defined in terms of diffusion constants as follows:
2
Dsurf
UAsurf5
!
1
212
where DavDav5(Dxx1Dyy1D )/3zz and
Dsurf5{(D Dxx yy1D Dxx zz1D Dyy zz2D Dxy xy
1/2
2D Dxz xz2D D )/3}yz yz
The diffusion anisotropy index UAsurfis scaled from 0 to 1,
where 0 corresponds to isotropic diffusion and 1 to fully an-isotropic diffusion. We compared the measured diffusion con-stant and the anisotropy values of the diseased tissue with val-ues obtained from healthy volunteers and, where appropriate, compared them with the patient’s contralateral side.
Case Reports
Case 1
A 50-year-old patient with amyotrophic lateral sclerosis (ALS) confirmed by electromyography and EL ESCORIAL criteria (4), was imaged. Routine pre- and postcontrast MR findings were normal, with the exception of a small left-sided frontal white matter focus of hyperintensity, consistent with a nonspecific focus of demyelination.
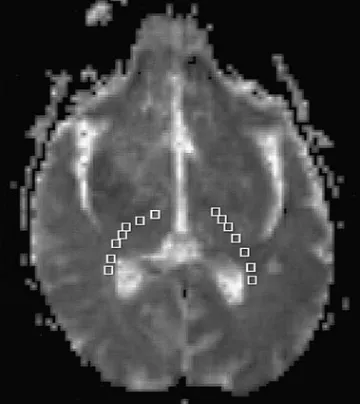
Figure 1 shows the average diffusion constant map (Dav)
with regions of measurements indicated by boxes. Table 1 summarizes the diffusion measurements. The diffusion aniso-tropy map revealed decreased anisoaniso-tropy in the anterior aspect of the posterior limb of the internal capsule (PLIC) (just pos-terior to the genu) bilaterally in the area of the corticospinal tract (CST). The diffusion anisotropy measurement (UAsurf) of
FIG1. Diffusion map Davshows the regions of interest (boxes)
[image:2.612.84.265.60.262.2]in the PLIC and adjacent white matter. Regions of interests were placed from posterior to anterior. Results of the measurements are summarized in Table 1.
TABLE 2: Average (6SD) measurements following corticospinal white matter tract in patient (case 2) with wallerian degeneration sec-ondary to right hemispheric stroke 18 months after ictus (diffusion anisotropy index [UAsurf] is normalized between 0 and 1)
Ipsilateral
Dav(1025cm2/s) UAsurf
Contralateral
Dav(1025cm2/s) UAsurf
Above pyramidal decussion Spinal cord
0.9860.20 1.4361.03
0.1760.15 0.5160.12
0.8060.13 1.3060.19
[image:2.612.62.541.467.627.2]0.2360.16 0.4660.17
TABLE 1: Diffusion tensor measurements of the posterior limb of the internal capsule (PLIC) and adjacent white matter in ALS patient*
Region of Interest
Left Side
Dav(1025cm2/s) UAsurf
Right Side
Dav(1025cm2/s) UAsurf
Posterior 1 2 3 4 5 6 Anterior 7
0.71 0.68 0.60 0.72 0.62 0.66 0.64
0.24 0.15 0.21 0.16 0.11 0.09 0.10
0.86 0.76 0.75 0.73 0.54 0.50 0.90
0.24 0.23 0.16 0.15 0.10 0.16 0.12 Average6SD (regions 1 to 7)
Average6SD for posterior horn of PLIC and adjacent white matter (regions 1, 2, 3) Average6SD for anterior parts of PLIC
(regions 5, 6, 7)
0.6660.04
0.6660.06
0.6460.02
0.1560.06
0.2060.04
0.1060.01
0.7260.15
0.7960.06
0.6560.22
0.1660.05
0.2160.04
0.1260.03
* Normal values for this region are Dav50.6960.03 1025cm2/s and anisotropy index UAsurf50.1960.03 (3).
was 0.20 on the left side and 0.21 on the right side. The normal diffusion anisotropy of the PLIC and adjacent white matter, previously measured in five volunteers using the same pulse sequence (3), was 0.1960.03. The 50% bilateral decrease of the diffusion anisotropy in the anterior portion of the PLIC is consistent with microscopic damage, with loss of the normal directionality of water movement.
Average diffusion constant measurements were not infor-mative. The Dav measured from the left PLIC and adjacent
white matter was 0.6660.04 1025cm2/s. There were no
sig-nificant differences between the posterior and the anterior por-tions of the PLIC. On the right, Davwas slightly greater (0.72
6 1.5 1025 cm2/s), with a larger deviation of diffusion
con-stants. Our previous study showed that normal Davin the PLIC and adjacent white matter is 0.6960.30 1025cm2/s (3).
Case 2
A 71-year-old patient with a large infarct of the right middle cerebral artery distribution was imaged 18 months after the onset of infarction. Hyperintensity typical of wallerian degen-eration was seen on long-TR images extending through the posterior limb of the right internal capsule through the right cerebral peduncle and the right ventral pons along the expected course of the right CST. The Dav and diffusion anisotropy UAsurfof the CST were measured from the PLIC to the
cer-vical spinal cord (15 axial sections, 12 in the brain and three in the spinal cord at 75 mm). At each level, the right side was compared with the left in the expected location of the CST. The data are tabulated in Table 2 and displayed graphically in Figure 2. Figure 3 is a sagittal image showing the locations of the axial sections.
The fiber tracts superior to the spinal cord on the right (ip-silateral to the stroke) had decreased diffusion anisotropy as compared with the left side. The mean diffusion anisotropy, obtained by averaging the measurements superior to the spinal cord, was 0.17 for the ipsilateral side and 0.23 for the contra-lateral side (26% decrease). Below the pyramidal tract decus-sation, in the spinal cord, the average diffusion anisotropy from the three inferior sections was 0.51 on the right (ipsilateral to the infarct) and 0.46 on the left (contralateral), corresponding to a 10% decrease of diffusion anisotropy of the contralateral fiber tract. The signal-to-noise ratio was decreased in the cer-vical cord as compared with the brain, reflecting the small size of the cord and the signal drop-off at the inferior portion of the imaging coil.
[image:2.612.66.543.681.739.2]FIG 2. Diffusion anisotropy measurements following the corti-cospinal fiber tract in case 2. Measurements from 16 sections are shown. Sections are 5 mm thick with no gap between sec-tions. Section 1 is the most inferior section. The diffusion an-isotropy decreased bilaterally in the pons (sections 7–10) and parts of the medulla (sections 5 and 6) (see Fig 3 for the locations of the axial sections).
FIG3. Sagittal MR image shows the locations of the axial sec-tions of Figure 2.
FIG4. Case 3.
A, T2-weighted MR image shows a sub-acute hematoma in the right basal ganglia with associated vasogenic edema.
B, T2-weighted echo-planar image (the B0image from the diffusion sequence) at
the next most inferior section shows the caudal edge of the hematoma. Note the slightly increased signal of the PLIC bilat-erally (arrows).
C, An average diffusion map (Dav)
re-veals increased diffusion in the vasogenic edema adjacent to the hematoma. The right and left PLIC show no evidence of abnormal diffusion.
D, Diffusion anisotropy map (UAsurf)
re-veals hyperintensity in normal white matter tracts, including the splenium of the corpus callosum, optic radiations, and left PLIC (arrows). This increased signal represents the high degree of anisotropy of normal white matter tracts. The right PLIC is not visible owing to decreased anisotropy.
even when there were only small changes in T2 signal abnor-mality and no anatomic changes.
The diffusion anisotropy of the pons was smaller than in the rest of the CST. This may be the result of the fact that trans-verse pontine fibers crossed through the CST, reducing the ef-fect of the dominant superior-inferior direction of the small-scale incoherent water motion in the measured voxels (5).
Case 3
A 38-year-old patient with a large, right, putamenal hem-orrhage was imaged 3 weeks after the event. Standard MR images (T1-weighted, FLAIR, T2-weighted, and gradient-echo) showed a subacute hematoma with associated vasogenic edema (Fig 4). Foci of hyperintensity were present on the right side of the brain stem on T2-weighted and FLAIR images, compatible with early wallerian degeneration.
TABLE 3: Average (6SD) measurements following corticospinal white matter tract in patient (case 3) with early wallerian degeneration secondary to right putaminal hemorrhage 3 weeks after ictus (diffusion anisotropy index [UAsurf] is normalized between 0 and 1)
Ipsilateral
Dav(1025cm2/s) UAsurf
Contralateral
Dav(1025cm2/s) UAsurf
Above pyramidal decussion Spinal cord
0.8460.20 0.9460.16
0.1160.08 0.3160.26
0.8160.12 0.8360.23
0.1560.06 0.2060.09
In this case of early wallerian degeneration, the right ipsi-lateral CST had a lower diffusion than the contraipsi-lateral side, but the change in Dav (4% increase) was minimal (Fig 4C). Our findings suggested that the fiber tract was damaged (an-isotropy was low) and gliosis had not yet developed (Davwas
not dramatically increased).
Case 4
A 13-year-old patient with progressive bulbar paralysis was imaged. Work-up excluded all other known causes of the clin-ical findings and a diagnosis of Fazio-Londe syndrome was made. Standard MR imaging findings were normal except for bilateral hypointensity on T2-weighted images in the globus pallidus, consistent with calcium or mineral deposition.
Using the diffusion-tensor imaging pulse sequence, we ob-tained 21 diffusion-weighted images with seven gradient di-rections for every MR section of 3 mm. The diffusion constant obtained from 25 measurements showed that Dav (1.1 60.4
1025cm2/s) was elevated, which may be consistent with gliosis
that has been reported on postmortem examinations (6) in this rare disorder. The average diffusion anisotropy from 25 mea-surements was slightly increased (UAsurf50.3960.17),
per-haps a result of the thinner sections, which decrease tissue heterogeneity in the imaged voxels.
Discussion
Over the past several years, MR imaging
tech-niques have been developed that take advantage of
various biochemical and/or microscopic features of
normal and pathologic tissue. In diffusion-weighted
imaging, differences in self-diffusion of water
mol-ecules produce contrast between normal and
patho-logic tissue, in particular, acute infarctions. With
this technique, the effects of the normal cellular
organization of highly ordered tissues, such as
white matter, can cause alterations in the rate of
self-diffusion that produce changes in signal
inten-sity on diffusion-weighted images that can be
mis-taken for disease processes. Therefore, the effects
of tissue anisotropy are eliminated with standard
diffusion-weighted imaging sequences by
averag-ing acquisitions with diffusion-sensitive gradients
applied in three directions (x, y, and z).
It is also possible to directly assess the effects
of anisotropic diffusion. This information may be
used to create maps of the direction of white matter
tracts or to determine the degree of anisotropy that
is present. In order to produce maps of the degree
and/or the direction of anisotropy, it is necessary
to obtain images with diffusion-sensitive gradients
applied in more than the three directions used in
routine diffusion-weighted imaging (at least six
di-rections). Data are obtained with gradients applied
singly, in pairs, and in combination (gradients
ap-plied in x, y, and z planes simultaneously), which
allows us to calculate the direction and degree of
anisotropy. By comparing the diffusion anisotropy
with known normal values or with unaffected,
nor-mal portions of the same brain, it is possible to
assess the degree to which tissues have maintained
or lost their normal degree of organization. This
technique, known as diffusion-tensor imaging,
should prove to be most efficacious in evaluating
processes that affect the most anisotropically
or-dered portions of the brain, the white matter tracts.
As we demonstrated in this series of patients, the
information supplied by diffusion-tensor imaging is
unique and cannot be obtained from other imaging
techniques. ALS is a disease that can affect upper
motor neurons, and therefore abnormalities in the
CST can be detected on routine MR studies in
some but not all cases. In the patient with ALS
studied in this series, no abnormalities were noted
on routine MR images, but a focal decrease in the
extent of anisotropy in the CST was seen within
the internal capsule. In the two patients with
wal-lerian degeneration, the entire CST inferior to the
area of damage had decreased anisotropy. This
de-crease extended caudally along the brain stem and
then crossed to the contralateral spinal cord below
the medullary decussation.
The fourth patient in this series, a 13-year-old,
had a rare disorder known as Fazio-Londe
syn-drome, in which there is destruction of brain stem
cranial nerve nuclei. Pathologic studies in these
pa-tients reveal neuronal loss and gliosis of the nuclei.
Generalized atrophy and volume loss in the brain
and spinal cord are seen less often and to a variable
extent. The diffusion MR findings in our patient
reflected this pathologic process. Although the
rou-tine imaging findings were normal, there was
evi-dence of an increase in the average diffusion
co-efficient, suggestive of gliosis, without remarkable
changes in diffusion anisotropy.
in signal-to-noise ratio and higher-resolution
ex-aminations should overcome these problems,
al-though
imaging
time
may
increase
as
a
consequence.
Conclusion
We believe that the use of diffusion-tensor
im-aging and production anisotropy maps can assist in
diagnosing and determining the extent of diseases
that cause fiber damage and neuronal degeneration.
References
1. Ulug˘ AM, Barker PB, Bryan RN, van Zijl PCM. Diffusion tensor
imaging of the human brain. Presented at the annual meeting of
the Society of Magnetic Resonance, Nice, 1995
2. Ulug˘ AM, Bakht O, Bryan RN, van Zijl PCM. Mapping of
hu-man brain fibers using diffusion tensor imaging. Presented at
the annual meeting of the International Society for Magnetic Res-onance in Medicine, New York, 1996
3. Ulug˘ AM, van Zijl PCM. Orientation-independent diffusion
im-aging without tensor diagonalization: anisotropy definitions based on physical attributes of the diffusion ellipsoid. J Magn
Reson Imaging (in press)
4. Brooks BR. El ESCORIAL World Federation of Neurology
criteria for diagnosis of amyotrophic lateral sclerosis. J Neurol
Sci 1994;128(Suppl):96–107
5. Pierpaoli C, Barnett A, Virta A, Penix L, Chen R. Diffusion MRI
of wallerian degeneration: a new tool to investigate neural con-nectivity in vivo? Presented at the annual meeting of the
Inter-national Society for Magnetic Resonance in Medicine, Sydney, 1998;1267
6. McShane MA, Boyd S, Harding B, Brett EM, Wilson J.
![TABLE 3: Average (� SD) measurements following corticospinal white matter tract in patient (case 3) with early wallerian degenerationsecondary to right putaminal hemorrhage 3 weeks after ictus (diffusion anisotropy index [UAsurf] is normalized between 0 and 1)](https://thumb-us.123doks.com/thumbv2/123dok_us/1137207.634304/4.612.68.540.85.142/measurements-following-corticospinal-wallerian-degenerationsecondary-hemorrhage-anisotropy-normalized.webp)