The nature of cardiovascular responses to exercise in tunas (family Scombridae, tribe Thunnini) has remained largely speculative. Until recently, the difficulty in working with these highly active, pelagic fishes has prevented detailed physiological measurements under the controlled swimming conditions necessary to examine responses to changes in muscle oxygen demand. However, the high metabolic rate of the tuna and its numerous cardiorespiratory adaptations for enhanced oxygen uptake and delivery, compared with other fishes studied, have resulted in considerable interest in their cardiac performance (reviewed in Brill and Bushnell, 1991; Farrell, 1991; Bushnell and Jones, 1994).
Previous studies on tuna cardiovascular physiology have been conducted on anesthetized, paralyzed and spinally blocked fish (Stevens, 1972; Breisch et al. 1983; Brill, 1987; Lai et al. 1987; White et al. 1988; Bushnell et al. 1990; Bushnell and Brill, 1992; Jones et al. 1993; Keen et al. 1995) or on tunas swimming at slow, uncontrolled speeds (Jones et al. 1986, 1993; Bushnell and Brill, 1991). However, swimming
is a constant and integral factor in tuna biology. Along with many morphological adaptations for efficient swimming, tunas conserve metabolically produced heat in aerobic swimming musculature and must swim continuously for ram gill ventilation and to maintain hydrostatic equilibrium (Magnuson, 1978; Dewar et al. 1994). In addition to meeting the oxygen delivery requirements of a high standard metabolic rate, the cardiorespiratory system must adjust to meet the elevation in oxygen demand as velocity increases during sustained swimming.
Many anatomical and biochemical features of the tuna heart are indicative of a heightened cardiorespiratory capacity and suggest that their cardiac function may differ from that of other fishes. The relative heart size of tunas is 3–10 times that of other teleosts, and the tuna heart has an extensive coronary circulation that delivers oxygenated blood to both the compact and spongy myocardia (Tota, 1978; Farrell and Jones, 1992). Tunas have a relatively high percentage of compact myocardium, and the myocardial fibers appear to be arranged JEB0747
Cardiac performance in the yellowfin tuna (Thunnus
albacares, 673–2470 g, 33–53 cm fork length, FL) was
examined in unanesthetized fish swimming in a large water tunnel. Yellowfin tuna were fitted with either electrocardiogram electrodes or a transcutaneous Doppler blood-flow probe over the ventral aorta and exposed to changes in swimming velocity (range 0.8–2.9 FL s−−1) or to an acute change in temperature (18–28 °C). Heart rates (fH) at 24±1 °C (30–130 beats min−−1) were lower on average than previous measurements with non-swimming (restrained) tunas and comparable with those for other active teleosts at similar relative swimming velocities. Although highly variable among individuals, fHincreased with velocity (U, in FL s−−1) in all fish (fH=17.93U+49.93, r2=0.14, P<0.0001). Heart rate was rapidly and strongly affected by temperature (Q10=2.37).
Blood flow measurements revealed a mean increase in relative cardiac output of 13.6±3.0 % with exercise (mean velocities 1.23–2.10 FL s−−1) caused by an 18.8±5.4 % increase in fHand a 3.9±2.3 % decrease in stroke volume. These results indicate that, unlike most other fishes, cardiac output in yellowfin tuna is regulated primarily through increases in fH. Acute reductions in ambient temperature at slow swimming velocities resulted in decreases in cardiac output (Q10=1.52) and fH(Q10=2.16), but increases in stroke volume (Q10=0.78). This observation suggests that the lack of an increase in stroke volume during exercise is not due to the tuna heart operating at maximal anatomical limits.
Key words: heart rate, stroke volume, cardiac output, temperature, swimming, exercise, tuna, Thunnus albacares.
Summary
Introduction
HEART RATE AND STROKE VOLUME CONTRIBUTIONS TO CARDIAC OUTPUT IN
SWIMMING YELLOWFIN TUNA: RESPONSE TO EXERCISE AND TEMPERATURE
KEITH E. KORSMEYER1,*, N. CHIN LAI1,2, ROBERT E. SHADWICK1 ANDJEFFREY B. GRAHAM1 1Center for Marine Biotechnology and Biomedicine, and Marine Biology Research Division, Scripps Institution of
Oceanography, University of California San Diego, La Jolla, CA 92093-0204, USA and 2Veterans Administration Medical Center, Research Division – Cardiology 111A, 3350 La Jolla Village Drive, San Diego, CA 92161, USA
Accepted 1 May 1997
to maximize pumping efficiency (Sanchez-Quintana and Hurle, 1987; Farrell and Jones, 1992). In addition, the hearts of tunas have high levels of myoglobin and aerobic enzyme activities (Giovane et al. 1980; Dickson, 1995). Unlike that of other fishes, the tuna myocardium has a significant dependence on intracellular Ca2+ stores, which may permit rapid contraction frequencies (Keen et al. 1992; Tibbits and Kashihara, 1992). These morphological and biochemical features support the potential of the tuna for extraordinary heart rates, cardiac outputs and blood pressures compared with those of other fishes (Lai et al. 1987; Brill and Bushnell, 1991; Jones et al. 1993; Bushnell and Jones, 1994).
Despite these findings, measurements of cardiac variables from swimming fish are few, and there are no data on their responses to exercise, resulting in controversy over the basic function and potential performance of the tuna heart. Reported heart rates (fH) from paralyzed and spinally blocked, restrained tunas are high and cover a wide range compared with values for other teleosts (90–240 beats min−1) (Brill, 1987; Bushnell et al. 1990; Brill and Bushnell, 1991), while fHin swimming tunas has been found to be significantly lower (averaging approximately 70 beats min−1, and in some fish as low as 35 beats min−1; Bushnell and Brill, 1991). Despite these data from swimming fish, the overwhelming fH data from non-swimming tunas has resulted in continued emphasis on the high heart rates of tuna, with ‘normal’ values reported as between 90 and 130 beats min−1 (Brill and Bushnell, 1991; Farrell, 1991; Bushnell and Jones, 1994). Recent work on spinally blocked tunas also suggests that these earlier results may have overestimated routine fHvalues (Keen et al. 1995). The wide range of heart rates observed in both swimming and non-swimming tunas has led to the conclusion that ‘obviously, heart rate does not appear to correlate well with the fish’s level of activity’ (Jones et al. 1993).
Fewer data are available on cardiac stroke volume (VS) in tunas, and currently there are two disparate hypotheses of in vivo cardiac function in these fishes. On the basis of the performance of in vitro perfused tuna hearts, Farrell (1991) and Farrell et al. (1992) concluded that the tuna heart normally operates at near maximal stroke volume and therefore cannot increase VSduring exercise. The large range of heart rates reported for tunas, therefore, would account for all the modulation of cardiac output necessary to achieve maximal oxygen consumption (Farrell et al. 1992). This is in contrast to most other fishes, which increase VS by an equal or greater extent than fH in order to elevate cardiac output (Farrell and Jones, 1992).
An alternative hypothesis is that, in a manner similar to other fishes, VSincreases twofold, along with elevations in fH, during exercise in tunas (Bushnell and Jones, 1994). This view is based on the wide range of stroke volumes measured in different tuna species under various experimental conditions (anesthetized, spinalized or swimming slowly).
In addition to the changes in oxygen demand with swimming velocity, the cardiovascular system of tunas must maintain adequate performance during rapid changes in ambient temperature. Many tunas make regular excursions between the
warm surface waters and the cooler waters of the upper thermocline, spanning approximately 10 °C (Holland et al. 1990). Although the red muscle of tuna is protected against the full effect of ambient temperature changes by vascular counter-current heat exchangers (Dewar et al. 1994), the heart is not. A failure to maintain cardiac output during drops in ambient temperature may result in a disparity between oxygen demand and delivery to the warm muscles of tunas.
This paper reports a two-part study examining in vivo cardiac function in unanesthetized, unrestrained yellowfin tuna [Thunnus albacares (Bonnaterre)] swimming in a large water tunnel under varying levels of exercise and ambient temperature. In the first part (study I), only fHwas measured, without the use of anesthesia or invasive surgery that might have influenced the results of earlier studies, in order to obtain baseline values with which more invasive experiments could be compared. In the second part (study II), relative changes in cardiac output were measured in swimming yellowfin tuna fitted with a pulsed-Doppler flow probe.
Together, these data provide an indication of routine heart rates in swimming yellowfin tuna and show how fH and VS meet the changes in oxygen demand associated with swimming velocity and acute changes in ambient temperature that may be encountered during normal vertical excursions.
Materials and methods Experimental animals and equipment
Yellowfin tuna (673–2470 g, 33–53 cm fork length, FL) were purchased from local commercial fishermen and maintained at ambient temperature (24–26 °C) in large outdoor tanks (76 000 l) at the Kewalo Research Facility, Honolulu, Hawaii, USA (Southwest Fisheries Science Center Honolulu Laboratory, National Marine Fisheries Service, National Oceanic and Atmospheric Administration) (Nakamura, 1972). The tuna were fed once daily, ad libitum, with chopped squid and fish, but food was withheld for at least 20 h prior to experiments to allow for gut clearance (Magnuson, 1969). All fish were healthy, feeding and had been in captivity for at least l week but not more than 6 weeks.
Experiments were conducted using the large (3000 l) water tunnel described by Dewar and Graham (1994). The swimming section was 113 cm long and 32.5 cm high, and the width was adjusted to either 22.5 cm or 28 cm depending on fish size. Ambient oxygen content and temperatures were continuously monitored with a YSI (Yellow Springs Instruments) temperature-compensated oxygen probe (5450/5758, model 54A meter) mounted in a flow-through cuvette, and a thermocouple within the water tunnel connected to a Physi-Temp digital thermometer (model BAT-12), respectively. Swimming velocities were corrected for the solid-blocking effect of the fish as described by Bell and Terhune (1970).
Handling and instrumentation Study I
Graham (1994), and instrumentation and procedures for experiments in this study are only described briefly here. Thirteen yellowfin tuna (945±57 g, 38.3±0.7 cm FL) were instrumented with electrocardiogram (ECG) electrodes (30 gauge insulated wire) to monitor fH. The tuna were quickly dip-netted from the holding tank, placed ventral side up in a water-filled, padded, plastic trough and ventilated with sea water. One electrode was inserted subcutaneously adjacent to the ventricle, and a second electrode wire was placed caudally, below the pectoral fin. The electrodes were held in place near the insertion point by small fish hooks (Mustad no. 15) attached to the wire (Bushnell and Brill, 1991). The pre-braided electrode wires were then looped through the skin near the insertion of the second dorsal fin and self-tied in position. This procedure was completed in 1–3 min. Once the electrodes were in place, the fish was rushed in the plastic trough to the water tunnel where it was lowered into the swimming section.
The ECG wires were connected to a pre-amplifier (Grass model P15D) and the signal was recorded with a computer data acquisition system (486 PC-compatible, Axotape and Cyberamp, Axon Instruments).
Study II
Seven yellowfin tuna (1768±131.3 g, 46.2±1.4 cm FL) were fitted with a transcutaneous Doppler blood-flow probe over the ventral aorta. Anesthesia procedures were similar to those described in Jones et al. (1986). Tuna were quickly dip-netted from the holding tank and rapidly subdued in a plastic bag of oxygenated sea water containing 1.0 g l−1 tricaine methanesulfonate (Finquel, Argent Chemical Laboratories) buffered with NaHCO3 or Trizma buffer (Sigma, T-1503). After approximately 1 min, the tuna was prepared for surgery by transferring it to a chamois leather cradle where it was ventilated with a reduced concentration of anesthetic (0.057–0.100 g l−1) in cooled, oxygenated sea water (approximately 24 kPa O2, 23 °C).
The Doppler blood-flow probe was attached transcutaneously because it is non-invasive, reducing stress and surgical time. The subminiature piezoelectric transducer
(Titronics Medical Instruments, Iowa City, Iowa, USA) was mounted with silicone cement to a patch of latex rubber (approximately 1.5 cm×1.5 cm and 1 mm in thickness). This patch was glued (transducer side down) to the epithelial lining of the gill cavity, directly over the ventral aorta, with Vetbond tissue adhesive (3M) (Bushnell et al. 1990). The Doppler probe leads were sutured in place, along the side of the fish, and trailed off the second dorsal fin. The attachment procedure was completed in 10–20 min.
Following surgery, the anesthetic was diluted with fresh sea water until the fish exhibited the return of tail and fin movements. At this point, the tuna was carefully lowered into the swimming section of the water tunnel, and the ventilation hose was removed. The tuna was gently held mid-stream (water speed 40–70 cm s−1) to maintain sufficient ventilation until swimming ability returned (approximately 20 min). The probe leads were fed through an open slot in the hatch of the swimming section.
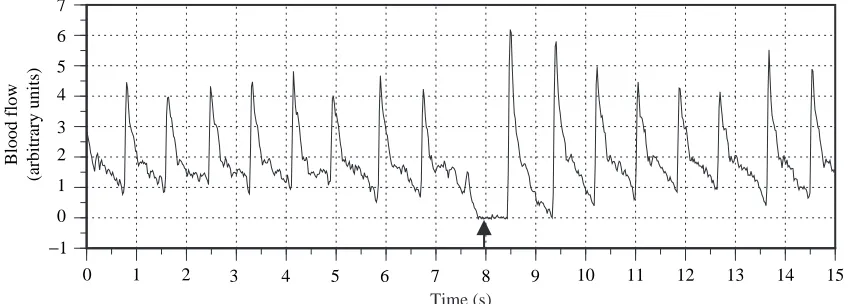
The blood-flow probe was driven by a directional, pulsed-Doppler flowmeter (model 545C-4, Bioengineering, The University of Iowa). The instantaneous blood flow signal (Fig. 1) was digitized at 50 Hz and recorded to computer hard disk (Axotape and Cyberamp, Axon Instruments). Zero flow was verified during brief, spontaneous periods of bradycardia (Fig. 1). Attempts to calibrate the flow probe post mortem were unsuccessful; therefore, cardiac output is reported as a relative measurement.
Experimental protocol Study I
[image:3.609.90.514.557.709.2]Between 1.5 and 2 h was allowed for the fish to acclimate to the water tunnel, and water velocity was adjusted to find a steady swimming speed for the fish (between 0.9 and 1.9 FL s−1). Following acclimation to the water tunnel, water velocity was increased stepwise by 5–15 cm s−1. Upon reaching the new velocity, fH was recorded during 5 min of steady swimming or until the fish could no longer maintain its position in the water tunnel. After a series of velocity increases, velocity was reduced to a resting level (1.0–1.9 FL s−1), which was
Fig. 1. Instantaneous blood flow trace from a swimming yellowfin tuna (1.73 FL s−1). The arrow indicates verification of zero flow during
spontaneous bradycardia.
Time (s)
10 11 12 13 14 15
0 1 2 3 4 5 6 7 8 9
7
6
5 4
3
2
1
0 −1
Blood flow
maintained until fHstabilized. This procedure was followed by additional velocity tests or, for four yellowfin, by acute changes in temperature.
Acute temperature change experiments (approximately 1 °C min−1) were conducted by rapidly introducing hot (40 °C) or cold (2 °C) sea water from external reservoirs into the water tunnel until the desired experimental temperature was achieved. Temperature was first reduced from 24 to 18 °C and then increased to 28 °C (±1 °C). Limited velocity tests were conducted at each temperature.
Study II
Following surgery and the return of swimming ability, the water velocity was adjusted to find a steady swimming speed for the fish (between 0.8 and 1.5 FL s−1). Two hours was allowed for recovery from anesthesia and acclimation to the water tunnel, following which velocity was increased as described in study I.
For six fish, the velocity test was followed by an acute change in temperature, as described in study I. Temperature was first reduced from 25 to 18 °C (in two initial experiments the temperature was reduced to only 20 °C) and then increased to 28 °C (±1 °C). Blood-flow recordings were made over 10 min at each temperature at a constant swimming velocity.
Data analysis Study I
Digitized ECG records were analyzed by a Turbo Pascal program to identify the position of the QRS complexes. QRS identification was presented graphically to verify correct triggering. An additional program calculated fH(beats min−1) by counting the number of QRS complexes over 1 min intervals.
For fH and velocity data, least-squares linear regressions were applied to each fish, and a combined regression was calculated from pooled data for all fish. Regressions were tested for significance using regression analysis of variance (ANOVA). Comparison of fH–velocity regressions among individual fish was made using analysis of covariance (ANCOVA) and a post-hoc multiple-comparison test. For fH measured at different temperatures, Q10 values were determined from the mean fHrecorded at the same velocities. Q10 values between 18–24 °C and 24–28 °C were compared using a paired t-test.
Study II
Heart rate and relative cardiac output were determined by counting the peaks in blood flow and averaging instantaneous flow over 1 min intervals, respectively (DADiSP Worksheet, DSP Development Corporation). Relative VSwas calculated by dividing relative cardiac output by fH. Because the transcutaneous Doppler flow probe measures blood velocity, changes in cardiac output and VSwere calculated assuming that the cross-sectional area of the ventral aorta was constant. Although the increases in mean blood pressure during exercise (Korsmeyer et al. 1997) will increase the vessel cross-sectional
area, potentially resulting in an underestimation of the change in flow, this change is predicted to be less than 5 % on the basis of the pressure–volume and pressure–diameter curves obtained from yellowfin ventral aortae (Bushnell et al. 1992; R. E. Shadwick, unpublished observations).
Because of the large variability in the initial and range of velocities among fish during the exercise tests, statistical differences were determined for each fish on the basis of multiple measurements at each velocity. Significant differences from values at the lowest velocity were tested using ANOVA and a post-hoc multiple-comparison test. For the temperature tests, mean values for each fish at each temperature were combined and compared using Friedman’s repeated-measures ANOVA. Because data for only two fish were available at 20 °C, these data were not included in the statistical analysis.
A fiducial limit of 5 % was used for all statistical tests. Mean values are reported with standard error of the mean (S.E.M.) unless otherwise noted.
Results
Study I Exercise
Linear regressions of fH and velocity for 13 yellowfin at 24±1 °C are shown in Fig. 2A, with the combined regression for all fish presented in Fig. 2B. Heart rate in fishes has often been described as increasing exponentially with fish swimming speed (Priede, 1974; Priede and Tytler, 1977; Scharold and Gruber, 1991; Lucas, 1994). However, we found that a linear regression provided a better fit on the basis of the r2 values for yellowfin in this study. In addition, polynomial regressions were not significant in the majority of cases; therefore, the linear model is used throughout. All individual regressions had highly significant positive slopes (P<0.0001, r2=0.38–0.82). Heart rate varied considerably among individuals and there were significant differences in the rate of increase with velocity. However, the results of the multiple comparison of slopes were ambiguous in that distinct groups of fish with similar slopes were not found. Elevations (i.e. the fH values over the measured range of velocities) were significantly different among regressions of common slope.
The combined regression of fHon velocity (U, in FL s−1) for pooled data was also highly significant (P<0.0001, N=885):
fH= 17.93U + 49.93 .
Owing to the variability in fH among fish, however, the coefficient of determination (r2=0.14) was much lower than for individual regressions. The low r2 value indicates that the combined regression cannot be used as a predictor of heart rate for individual fish. However, the regression can be used to estimate the mean fH for the population of yellowfin, as indicated by the 95 % confidence limits (Fig. 2B).
regression of fHon velocity and body mass found no effect of mass over the range in this study (673–1415 g).
Temperature
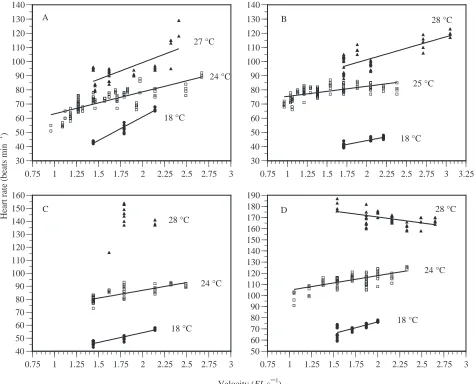
Heart rate responded rapidly (within 1 min) and closely matched changes in ambient temperature (Fig. 3). The effects of temperature and velocity on the fHof all four yellowfin are shown in Fig. 4. At the low (18 °C) and high (27–28 °C) temperatures used in this study, most fish showed significant increases in fHwith velocity, similar to the response at 24 °C (Fig. 4). However, the fH–velocity regression at 28 °C for one fish (Fig. 4C) did not differ significantly from zero, and that for another (Fig. 4D) was negative (P<0.0001). The lack of significance of the 28 °C regression (Fig. 4C) is probably due to insufficient data over a range of velocities. However, these data could be used for calculation of Q10. In the one fish with the negative regression (Fig. 4D), fH rose briefly to a maximum of 205 beats min−1 (for less than 1 min) immediately after the increase in temperature to 28 °C, and
30 40 50 60 70 80 90 100 110 120 130
0.75 1 1.25 1.5 1.75 2 2.25 2.5 2.75 3
30 40 50 60 70 80 90 100 110 120 130
0.75 1 1.25 1.5 1.75 2 2.25 2.5 2.75 3
A
B
Velocity (FL s−1)
H
ea
rt
r
at
e (
b
ea
ts
m
in
−
1 )
Fig. 2. Effect of swimming velocity (U) on heart rate (fH) in yellowfin tuna. (A) Least-squares
regressions of heart rate on swimming velocity for 13 yellowfin tuna at 24±1 °C. All regressions were significant (P<0.0001). (B) Combined regression from data for all 13 fish (fH=17.93U+49.93, P<0.0001, r2=0.14, N=885). Dashed lines are 95 %
[image:5.609.255.570.71.697.2]confidence limits. Points are heart rate recorded over 1 min intervals. Note that multiple points occupying the same location are not indicated.
Fig. 3. Response of heart rate (circles) to acute decrease in ambient temperature (solid line) in a swimming yellowfin tuna (1.4 FL s−1). Heart rate values were recorded over 1 min intervals.
Time (min) Heart rate
Temperature
0 10 20 30 40 50 60 70 80 90
16 18 20 22 24 26 28 30 32
0 5 10 15 20
A
m
b
ie
n
t t
em
p
er
at
u
re
(
°C
)
H
ea
rt
r
at
e (
b
ea
ts
m
in
−
then declined despite increases in velocity. Although the slopes of the fH–velocity regressions at different temperatures were significantly different in some of the fish, there was no consistent trend.
Over the two temperature ranges, 18–24 °C (25 °C for one fish) and 24–28 °C (27 °C for one fish), Q10 was not significantly different (mean Q10=2.37±0.17).
Study II Exercise
Fig. 5 shows the effects of velocity on relative cardiac output (V.b), relative fH and relative VS in seven yellowfin. Heart rate accounted for all of the increase in cardiac output during exercise. The mean initial swimming speed was 1.23±0.08 FL s−1, increasing to 2.10±9.3 FL s−1. Heart rate increased by an average of 18.8±5.4 %, from 67.7±7.1 to 80.5±9.3 beats min−1. Stroke volume decreased by 3.9±2.3 %, resulting in an increase in cardiac output of only 13.6±3.0 %.
The effects of exercise on VS varied among individual fish, with significant decreases in four (Fig. 5A,C,E,G), no change in two (Fig. 5B,D) and an initial increase in one, although at the highest velocity it was not significantly different from the initial value (Fig. 5F). The percentage change in VSat maximal velocities in each fish was negatively correlated with the percentage change in fH(r=−0.829, P<0.02).
Temperature
The effects of temperature on relative cardiac output (V.b), relative fH and relative VS in six yellowfin tuna are shown in Fig. 6. Changes in both cardiac output and fH were directly related to temperature, while stroke volume was inversely related. Q10 values for cardiac output, fH and VS were not significantly different over the two temperature ranges (paired t-test) and averaged 1.52±0.08, 2.16±0.25 and 0.78±0.07, respectively. The Q10for fHin this study is not significantly different from that in study I (unpaired t-test).
30 40 50 60 70 80 90 100 110 120 130 140
0.75 1 1.25 1.5 1.75 2 2.25 2.5 2.75 3 30 40 50 60 70 80 90 100 110 120 130 140
0.75 1 1.25 1.5 1.75 2 2.25 2.5 2.75 3 3.25
40 50 60 70 80 90 100 110 120 130 140 150 160
0.75 1 1.25 1.5 1.75 2 2.25 2.5 2.75 3 50 60 70 80 90 100 110 120 130 140 150 160 170 180 190
0.75 1 1.25 1.5 1.75 2 2.25 2.5 2.75 3 27 °C
24 °C
18 °C
25 °C 28 °C
18 °C
18 °C
18 °C 24 °C
24 °C 28 °C
28 °C
A B
C D
Velocity (FL s−1)
H
ea
rt
r
at
e (
b
ea
ts
m
in
−
[image:6.609.65.540.74.458.2]1 )
Discussion
Exercise Heart rate (study I)
Previously reported heart rates for non-swimming tunas are high compared with values for other teleosts and cover a wide range (Table 1). We have found, however, that fHin swimming
yellowfin is generally lower than expected on the basis of these earlier studies, particularly if the fH–velocity relationship (Fig. 2B) is extrapolated to zero velocity. In addition, heart rates measured in this study are lower than those reported by Jones et al. (1993) (see Table 2) for slowly swimming (velocities not reported) yellowfin, which may be due to the Velocity (FL s−1)
0.85 0.9 0.95 1 1.05 1.1 1.15 1.2 1.25
1 1.2 1.4 1.6 1.8 2 2.2 2.4 V Vs
*
* *
*
*
*
*
*
*
0.85 0.9 0.95 1 1.05 1.1 1.15 1.2 1.251 1.2 1.4 1.6 1.8 2 2.2 2.4
*
*
*
*
*
0.85 0.9 0.95 1 1.05 1.1 1.15 1.2 1.251 1.2 1.4 1.6 1.8 2 2.2 2.4
*
*
*
*
*
*
* *
*
*
* * *
0.85 0.9 0.95 1 1.05 1.1 1.15 1.2 1.251 1.2 1.4 1.6 1.8 2 2.2 2.4
*
*
*
*
*
*
*
0.85 0.9 0.95 1 1.05 1.1 1.15 1.2 1.251 1.2 1.4 1.6 1.8 2 2.2 2.4
*
*
*
*
*
0.8 0.9 1 1.1 1.2 1.3 1.4 1.50.8 1 1.2 1.4 1.6 1.8 2 2.2 2.4
*
*
*
*
*
*
*
*
*
*
*
*
*
*
0.85 0.9 0.95 1 1.05 1.1 1.15 1.2 1.251 1.2 1.4 1.6 1.8 2 2.2 2.4
*
* *
*
*
* *
*
*
*
*
*
*
*
A C E G B D F . f R el at iv e c h an g eVelocity (FL s−1) b
[image:7.609.191.568.72.648.2]H
Fig. 5. Relative changes in heart rate (fH, j), cardiac output (V.b, s) and stroke volume (VS, m) with
added stress caused by the towing of multiple cannulae in that study. However, the mean fH reported by Bushnell and Brill (1991) for yellowfin swimming in a circular tank at an average velocity of 1.2 FL s−1 was 67.9 beats min−1, which is very similar to the fHpredicted for this velocity from the combined regression in Fig. 2B (71.4 beats min−1). Bushnell and Brill
(1991) suggest that the higher heart rates measured in non-swimming, spinally blocked tunas may reflect over-ventilation in those preparations. In addition, it may be that swimming tunas are less stressed than restrained fish. These differences suggest that physiological variables measured in non-swimming tunas should not be considered equivalent to a ‘resting’ state.
Although generally lower than other measurements for tunas, there was considerable variability in fH among individuals (Fig. 2A). Significant inter-individual differences in fHhave also been found in other teleosts and elasmobranchs (Priede and Tytler, 1977; Scharold et al. 1989; Scharold and Gruber, 1991; Lucas, 1994). The individual variability in fHin the present study may be due to unknown differences in either physical condition or in response to handling stress. A similar amount of variability was reported by Bushnell and Brill (1991) for yellowfin swimming at slow, voluntary speeds in a circular tank, suggesting that this variability is not an artifact caused by swimming in a water tunnel.
Despite considerable individual differences in fH, each fish in study I showed a significant increase in fH with velocity. Although this relationship suggests that fH may be a useful estimator of changes in velocity or metabolic rate for potential telemetry studies (Lucas, 1994), the large variability in fH between individuals at a given velocity precludes estimation for a single fish (Fig. 2A). It may be, however, that the individual differences in fHare correlated with differences in metabolic rate at a given velocity (Dewar and Graham, 1994), and actual measurements of oxygen consumption along with fHare needed to resolve this problem.
The heart rates for yellowfin reported in this study are not 0.6
0.7 0.8 0.9 1 1.1 1.2 1.3 1.4 1.5
15 20 25 30
Vs
f . V
Temperature (°C)
*
*
*
*
*
*
R
el
at
iv
e c
h
an
g
e
H
b
Fig. 6. Mean relative changes in heart rate (fH, j), cardiac output (V
. b,
s) and stroke volume (VS, m) with acute changes in ambient
temperature in six yellowfin tuna at constant swimming velocities. Mean values at 25 °C were normalized to a value of 1.0 for each fish. Mean swimming velocity and initial heart rate at 25 °C were
1.40±0.10 FL s−1and 72.3±10.4 beats min−1, respectively. Sample size
at each temperature are: N=6 at 25 and 28 °C, N=2 at 20 °C, and N=4
at 18 °C. Error bars are S.E.M. *indicates a significant difference from
[image:8.609.68.269.75.240.2]the value at 25 °C.
Table 1. Heart rate and stroke volume measurements from non-swimming (anesthetized, paralyzed or spinally blocked) tunas and in vitro heart preparations
Mean fH Mean VS Mass T
Species (beats min−1) (ml kg−1) Condition (kg) (°C) References
Yellowfin 132 (90–160) − Paralyzed 1.4 25 Brill (1987)
96.7 1.3 Spinally blocked 1.4 25 Bushnell and Brill (1992)
137.6 0.87 In vitro perfused heart, 1.96 25 Farrell et al. (1992)
maximum
112 (86–139) 0.67 (0.43–0.95) Anesthetized 1.4 25 Jones et al. (1993)
75.5 − Spinally blocked 1.59 25 Keen et al. (1995)
Skipjack 70 (46–168) − Anesthetized 1.7 23–25 Stevens (1972)
230 (191–237) − Paralyzed 0.63 25 Brill (1987)
125.9 1.1 Spinally blocked 1.64 25 Bushnell and Brill (1992)
154 0.68 In vitro perfused heart, 1.32 25 Farrell et al. (1992) maximum
79.4 − Spinally blocked 1.12 25 Keen et al. (1995)
Kawakawa 206 (175–253) − Paralyzed 1.3 25 Brill (1987)
Albacore 120 (60–150) − Paralyzed 10.3 20–24 Breisch et al. (1983)
87 (50–120) 0.32 (0.21–0.48) Anesthetized 9.1 16.5 Lai et al. (1987)
115 (69–150) 0.38 (0.25–0.79) Anesthetized 9.3 21.9 White et al. (1988)
Skipjack (Katsuwonus pelamis), kawakawa (Euthynnus affinis), yellowfin (Thunnus albacares), albacore (T. alalunga).
very different from those reported for other active teleosts, such as rainbow trout (Oncorhynchus mykiss) or Atlantic salmon (Salmo salar). Heart rates for these species at 1.0 and 2.0 FL s−1are presented in Table 2 for comparison and are very similar to the results for yellowfin despite a 9 °C difference in temperature. The measured fH reported for one yellowtail (Seriola quinqueradiata, Carangidae) at 24 °C increased from approximately 80 to 100 beats min−1 with an increase in swimming velocity from approximately 1.0 to 2.6 FL s−1 (Hanyu et al. 1979), a similar response to that of the yellowfin (Fig. 2B). It appears, therefore, that during routine aerobic activity yellowfin have heart rates similar to those of other active fishes, despite their capacity for much higher contraction frequencies.
Stroke volume (study II)
Although Keen et al. (1995) suggested that the use of a Doppler flow probe resulted in elevated heart rates in tunas, we did not find this to be the case in our study. The fH values measured in the present study are generally lower than those from both non-swimming and swimming tunas for which stroke volume has also been measured (Tables 1, 2). Although the recovery time from anesthesia was relatively short (2 h), fH values were very similar to those from study I in which the fish were never anesthetized (for a discussion of recovery from anesthesia, see Korsmeyer et al. 1997). For example, at the mean initial (1.23 FL s−1) and maximal (2.10 FL s−1) velocity, fH values averaged 67.7 and 80.5 beats min−1, respectively. These values compare favorably with 72.0 and 87.6 beats min−1 determined from the fH–velocity regression from study I (Fig. 2B).
While fHincreased in all fish at higher swimming velocities, as in study I, VS either did not change or declined (Fig. 5). Thus, heart rate was sufficient to increase cardiac output,
despite opposing changes in VS. The relative changes in fHand VS were negatively correlated; the fish with the largest increases in fHexhibited the largest decreases in VS (Fig. 5). This can be explained by the influence of filling time on end-diastolic volume, limiting stroke volume at higher contraction frequencies.
The results for yellowfin tuna support the hypothesis of Farrell (1991) and Farrell et al. (1992) that cardiac output is increased primarily through fH. This is different from most other fish species studied, in which increases in cardiac output during exercise occur through the contributions of elevations in both VSand fH. Depending on species and acclimation temperature, VSaccounts for 30–80 % of the increases in cardiac output in other teleosts (Farrell, 1991; Kolok and Farrell, 1994). However, another group of fishes, the red-blooded Antarctic nototheniids, appears to regulate cardiac frequency to a much greater extent than volume (Axelsson et al. 1992). Preliminary VSmeasurements on swimming yellowfin suggested that, as in most other fishes, stroke volume increased with exercise (Korsmeyer et al. 1993; Graham et al. 1994). However, further examination revealed significant increases in VS during recovery from anesthesia that masked the effects of exercise if velocity was increased too soon after surgery (<1.5 h, K. E. Korsmeyer, N. C. Lai, R. E. Shadwick and J. B. Graham, unpublished observations). Although stroke volume may increase in some circumstances (Fig. 5F), the present study indicates that fHis the most important contributor to increased cardiac output during exercise in the yellowfin tuna.
[image:9.609.49.568.85.271.2]The use of a transcutaneous Doppler flow probe in this study, while limiting surgery and anesthesia time, prevented reliable calibration for determining absolute values of VS. Previous measurements of VSin tunas under various conditions cover a twofold range (Tables 1, 2). The high variability in fH suggests that VSmay be equally variable among individual fish. Table 2. Heart rate and stroke volume measurements from swimming tunas and other teleosts
fH VS Velocity Fork length T
Species (beats min−1) (ml kg−1) (FL s−1) (cm) (°C) References
Yellowfin 67.9 − 1.2 46.1 25 Bushnell and Brill (1991)
108.8 − NA NA (1.4 kg) 25 Jones et al. (1993)
67.9 − 1.0 38.3 24 Present study
85.8 − 2.0 38.3 24 Present study
101.9 − 2.9 38.3 24 Present study
Skipjack 80–240 − NA NA 25 Kanwisher et al. (1974)
76.8 − 1.6 44.7 25 Bushnell and Brill (1991)
Kawakawa 128 0.54 1.3 46 25 Jones et al. (1993)
Rainbow trout 57.2 − 1.0 23.0–28.2 15 Priede (1974)
89.4 − 2.0 23.0–28.2 15 Priede (1974)
Atlantic salmon 60.3 − 1.0 50.7 15 Lucas (1994)
81.3 − 2.0 50.7 15 Lucas (1994)
Skipjack (Katsuwonus pelamis), kawakawa (Euthynnus affinis), yellowfin (Thunnus albacares), rainbow trout (Oncorhynchus mykiss), Atlantic salmon (Salmo salar).
The absolute range of stroke volume and cardiac output in swimming tunas remains to be determined.
Acute temperature change
In most ectotherms, the decrease in fH with temperature is accompanied by a decrease in total metabolic rate; however, tuna red (aerobic) muscle metabolism will not be affected to the same degree as cardiac metabolism. Yellowfin maintain excess red muscle temperatures (the difference between muscle and ambient temperature) of 1–5 °C through the use of vascular counter-current heat exchangers (retia mirabilia) (Dewar et al. 1994; Dickson, 1994). In addition, the insulating effect of the retia attenuates red muscle heat loss when the fish moves into cooler waters (Dewar et al. 1994). Although blood delivered to the red muscle is warmed by counter-current exchange in the retia, these same structures cool the venous blood returning to the heart (Brill et al. 1994). Because of the efficiency of the retial heat exchangers, and venous return from areas of the body that were never heated, the temperature of the mixed venous blood entering the lumen of the heart is unlikely to be more than a few tenths of a degree above ambient (Graham, 1973; Neill et al. 1976). In addition, the heart is located close to the surrounding water and is fed by a coronary blood supply that is in thermal equilibrium with ambient conditions in the gill.
Heart rate (study I)
The rapid response of heart rate to ambient temperature changes (Fig. 3) suggests that the temperature of the heart quickly comes into equilibrium with the ambient water. This is also indicated by the Q10for fH(2.37) which, despite the elevated muscle temperatures of swimming yellowfin, is similar to the Q10reported for paralyzed non-swimming tunas and other ectothermic fishes (2–3; Brill, 1987; Farrell and Jones, 1992). Despite the temperature effects, fH increased with exercise at 18 °C, and at 27–28 °C in some fish, similar to the response at 24 °C (Fig. 4). The variability in the fH response at 28 °C suggests that this temperature is approaching the upper thermal limit for yellowfin of this size (Sund et al. 1981).
Stroke volume (study II)
As in the response to exercise, changes in fHhad the greatest influence on cardiac output in yellowfin tuna during acute temperature change (Fig. 6), with a Q10of 2.16. The lower Q10 for cardiac output (1.52) reflects the opposing changes in stroke volume.
An inverse relationship between fH and VS during acute temperature change has been demonstrated with in vitro fish hearts (Graham and Farrell, 1985; Yamamitsu and Itazawa, 1990). As changes in temperature do not directly affect myocardial force development (Driedzic and Gesser, 1994), the opposing changes in VSreflect alterations in filling time. In vivo cardiac responses to acute temperature change in teleosts show that heart rate typically dominates changes in cardiac output with little change in stroke volume (Stevens et al. 1972;
Cech, 1976), and this agrees with our results from the yellowfin.
The Q10measured for cardiac output (1.52) is similar to the Q10for total oxygen consumption in swimming yellowfin (1.67; Dewar and Graham, 1994), suggesting that changes in cardiac output can compensate fully for variations in metabolic rate due to temperature change. It should be noted, however, that the Q10 of oxygen consumption was determined at relatively slow velocities (approximately 1 FL s−1) and after 30 min of acclimation to allow for stabilization of red muscle temperature (Dewar and Graham, 1994). During the rapid drops in temperature experienced during a dive through the thermocline, excess red muscle temperature will be greater, approaching a new equilibrium temperature at a rate much slower than at the heart (Holland et al. 1992; Dewar et al. 1994). The rapid drop in cardiac output may limit oxygen delivery to the warmed red muscle, particularly at higher swimming velocities, when aerobic muscle metabolism will have the greatest contribution to total oxygen consumption (Korsmeyer et al. 1996).
Cardiac performance in yellowfin tuna
Although the lower than expected heart rate in swimming tuna indicates an even greater scope for increases in fH than previously thought, the increases in fH with exercise in yellowfin are similar to those in other active fishes and are not extraordinary. This is particularly surprising given that, unlike other fishes, stroke volume in tuna did not contribute to elevating cardiac output.
Although it has been suggested that VS is maximal, and therefore relatively fixed, at 25 °C in tuna (Farrell, 1991; Farrell et al. 1992), decreases in fH with decreasing temperature were accompanied by an increase in VS(Fig. 6). This indicates that the anatomical limits of ventricular volume had not been reached (i.e. there is a preload reserve). These results differ from the response to hypoxia in spinalized yellowfin, in which bradycardia occurred with no increase in VS(Bushnell et al. 1990; Bushnell and Brill, 1992). The lack of a stroke volume change in spinalized tunas may be due to the higher heart rates, and therefore reduced filling time, caused by that preparation. However, preliminary results suggest that, despite lower heart rates, VS does not increase during hypoxia in swimming tuna either (Korsmeyer et al. 1996). The increase in peripheral vascular resistance during hypoxia (Bushnell and Brill, 1992) may limit stroke volume by reducing filling pressure.
extraordinary (Tables 1, 2; Farrell et al. 1992). The cardiac hypertrophy in tunas is due to a thicker myocardium with a high percentage of compacta, which appears to be an adaptation for rapid pressure development. This is in contrast to the hemoglobinless icefish (Channichthyidae), in which an equally large, but entirely trabeculated (spongy type) heart generates a very high VS at low pressures and heart rates (Agnisola and Tota, 1994).
For free-swimming tuna, it is not clear what conditions may initiate exceptionally high heart rates (>120 beats min−1; Tables 1, 2). The intrinsic fH in yellowfin at 25 °C is 119 beats min−1 (Keen et al. 1995) and even at swimming velocities over 2.5 FL s−1, fH is normally below this level (Fig. 2). The increases observed during prolonged exercise, therefore, can be achieved solely through reduced vagal inhibition. However, exceptionally high heart rates, above intrinsic values, must be achieved through increased levels of circulating catecholamines or by direct sympathetic nervous stimulation. This adrenergic stimulation may also serve to maintain or increase stroke volume by increasing myocardial contractility during intense exercise or stress.
We thank Dr R. W. Brill, F. Archer, D. Curren, T. Knower, J. Nauen, G. Spencer, R. Sumida, S. Yano, the captain and crew of the F/V Corsair, and the staff of the NMFS Kewalo Research Facility for their assistance. We also thank N. Aguilar, S. Katz, R. H. Rosenblatt, G. N. Somero, R. Shabetai and several anonymous reviewers for helpful comments on earlier versions of this manuscript. This research was supported by the National Science Foundation (OCE91-03739), the Achievement Rewards for College Scientists Foundation, Inc. (K.E.K.) and a VAMC merit grant (N.C.L.).
References
AGNISOLA, C. ANDTOTA, B. (1994). Structure and function of the fish cardiac ventricle: Flexibility and limitations. Cardioscience 5, 145–153.
AXELSSON, M., DAVISON, W., FORSTER, M. E. AND FARRELL, A. P. (1992). Cardiovascular responses of the red-blooded Antarctic fishes Pagothenia bernachii and P. borchgrevinki. J. exp. Biol. 167, 179–201.
BELL, W. H. ANDTERHUNE, L. D. B. (1970). Water tunnel design for
fisheries research. Fish. Res. Bd Can. Tech. Rep. 195, 1–69. BREISCH, E. A., WHITE, F., JONES, J. AND LAURS, R. M. (1983).
Ultrastructural morphometry of the myocardium of Thunnus alalunga. Cell Tissue Res. 233, 427–438.
BRILL, R. W. (1987). On the standard metabolic rates of tropical tunas,
including the effect of body size and acute temperature change. Fishery Bull. Fish Wldl. Serv. U.S. 85, 25–35.
BRILL, R. W. AND BUSHNELL, P. G. (1991). Metabolic and cardiac
scope of high energy demand teleosts, the tunas. Can. J. Zool. 69, 2002–2009.
BRILL, R. W., DEWAR, H. ANDGRAHAM, J. B. (1994). Basic concepts
relevant to heat transfer in fishes and their use in measuring the physiological thermoregulatory abilities of tunas. Env. Biol. Fish. 40, 109–124.
BUSHNELL, P. G. ANDBRILL, R. W. (1991). Responses of swimming
skipjack (Katsuwonus pelamis) and yellowfin (Thunnus albacares) tunas to acute hypoxia and a model of their cardiorespiratory function. Physiol. Zool. 64, 787–811.
BUSHNELL, P. G. AND BRILL, R. W. (1992). Oxygen transport and cardiovascular responses in skipjack (Katsuwonus pelamis) and yellowfin tuna (Thunnus albacares) exposed to acute hypoxia. J. comp. Physiol. B 162, 131–143.
BUSHNELL, P. G., BRILL, R. W. AND BOURKE, R. E. (1990). Cardiorespiratory responses of skipjack tuna (Katsuwonus pelamis), yellowfin tuna (Thunnus albacares) and bigeye tuna (Thunnus obesus) to acute reductions of ambient oxygen. Can. J. Zool. 68, 1857–1865.
BUSHNELL, P. G. AND JONES, D. R. (1994). Cardiovascular and respiratory physiology of tuna: adaptations for support of exceptionally high metabolic rates. Env. Biol. Fish. 40, 303–318. BUSHNELL, P. G., JONES, D. R. ANDFARRELL, A. P. (1992). The arterial
system. In Fish Physiology, vol. 12A (ed. W. S. Hoar, D. J. Randall and A. P. Farrell), pp. 89–139. San Diego: Academic Press.
CECH, J. J. (1976). Cardiovascular responses of winter flounder,
Pseudopleuronectes americanus (Walbaum), to acute temperature increase. Can. J. Zool. 54, 1383–1388.
DEWAR, H. AND GRAHAM, J. B. (1994). Studies of tropical tuna
swimming performance in a large water tunnel. I. Energetics. J. exp. Biol. 192, 13–31.
DEWAR, H., GRAHAM, J. B. AND BRILL, R. W. (1994). Studies of
tropical tuna swimming performance in a large water tunnel. II. Thermoregulation. J. exp. Biol. 192, 33–44.
DICKSON, K. A. (1994). Tunas as small as 207 mm fork length can elevate muscle temperatures significantly above ambient water temperature. J. exp. Biol. 190, 79–93.
DICKSON, K. A. (1995). Unique adaptations of the metabolic biochemistry of tunas and billfishes for life in the pelagic environment. Env. Biol. Fish. 42, 65–97.
DRIEDZIC, W. R. AND GESSER, H. (1994). Energy metabolism and contractility in ectothermic vertebrate hearts: hypoxia, acidosis and low temperature. Physiol. Rev. 74, 221–258.
FARRELL, A. P. (1991). From hagfish to tuna: a perspective on cardiac function in fish. Physiol. Zool. 64, 1137–1164.
FARRELL, A. P., DAVIE, P. S., FRANKLIN, C. E., JOHANSEN, J. A. AND
BRILL, R. W. (1992). Cardiac physiology in tunas. I. In vitro
perfused heart preparations from yellowfin and skipjack tunas. Can. J. Zool. 70, 1200–1210.
FARRELL, A. P. AND JONES, D. R. (1992). The heart. In Fish Physiology, vol. 12A (ed. W. S. Hoar, D. J. Randall and A. P. Farrell), pp. 1–88. San Diego: Academic Press.
GIOVANE, A., GRECO, G., MARESCA, A. AND TOTA, B. (1980). Myoglobin in the heart ventricle of tuna and other fishes. Experientia 36, 219–220.
GRAHAM, J. B. (1973). Heat exchange in the black skipjack and the blood-gas relationship of warm-bodied fishes. Proc. natn. Acad. Sci. U.S.A. 70, 1964–1967.
GRAHAM, J. B., DEWAR, H., LAI, N. C., KORSMEYER, K. E., FIELDS, P.
A., KNOWER, T., SHADWICK, R. E., SHABETAI, R. ANDBRILL, R. W.
(1994). Swimming physiology of pelagic fishes. In Mechanics and Physiology of Animal Swimming (ed. L. Maddock, Q. Bone and J. M. V. Rayner), pp. 63–74. Cambridge: Cambridge University Press.
GRAHAM, M. ANDFARRELL, A. (1985). The seasonal intrinsic cardiac performance of a marine teleost. J. exp. Biol. 118, 173–183.
HANYU, I., TSUKAMOTO, K., YAMAMORI, K., NGAN, P. V., FURUKAWA,
information from swimming fish. Bull. Jap. Soc. Sci. Fish. 45, 1261–1265.
HOLLAND, K. N., BRILL, R. W. AND CHANG, R. K. C. (1990). Horizontal and vertical movements of yellowfin and bigeye tuna associated with fish aggregating devices. Fishery Bull. Fish. Wildl. Serv. U.S. 88, 493–507.
HOLLAND, K. N., BRILL, R. W., CHANG, R. K. C., SIBERT, J. R. AND FOURNIER, D. A. (1992). Physiological and behavioral thermoregulation in bigeye tuna (Thunnus obesus). Nature 358, 410–412.
JONES, D. R., BRILL, R. W. ANDBUSHNELL, P. G. (1993). Ventricular
and arterial dynamics of anaesthetised and swimming tuna. J. exp. Biol. 182, 97–112.
JONES, D. R., BRILL, R. W. ANDMENSE, D. C. (1986). The influence
of blood gas properties on gas tensions and pH of ventral and dorsal aortic blood in free-swimming tuna, Euthynnus affinis. J. exp. Biol. 120, 201–213.
KANWISHER, J., LAWSON, K. AND SUNDNES, G. (1974). Acoustic telemetry from fish. Fishery Bull. Fish. Wildl. Serv. U.S. 72, 251–255.
KEEN, J. E., AOTA, S., BRILL, R. W., FARRELL, A. P. ANDRANDALL,
D. J. (1995). Cholinergic and adrenergic regulation of heart rate and ventral aortic pressure in two species of tropical tunas, Katsuwonus pelamis and Thunnus albacares. Can. J. Zool. 73, 1681–1688.
KEEN, J. E., FARRELL, A. P., TIBBITS, G. F. ANDBRILL, R. W. (1992).
Cardiac physiology in tunas. II. Effect of ryanodine, calcium and adrenaline on force–frequency relationships in atrial strips from skipjack tuna, Katsuwonus pelamis. Can. J. Zool. 70, 1211–1217.
KOLOK, A. S. ANDFARRELL, A. P. (1994). Individual variation in the
swimming performance and cardiac performance of northern squawfish, Ptycholchellus oregonensis. Physiol. Zool. 67, 706–722. KORSMEYER, K. E., DEWAR, H., LAI, N. C. ANDGRAHAM, J. B. (1996). Tuna aerobic swimming performance: physiological and environmental limits based on oxygen supply and demand. Comp. Biochem. Physiol. 113B, 45–56.
KORSMEYER, K. E., LAI, N. C., KNOWER, T., DEWAR, H., SHADWICK,
R. E. AND GRAHAM, J. B. (1993). Cardiovascular function in
swimming yellowfin tuna (Thunnus albacares). Am. Zool. 33, 44A.
KORSMEYER, K. E., LAI, N. C., SHADWICK, R. E. ANDGRAHAM, J. B. (1997). Oxygen transport and cardiovascular responses to exercise in the yellowfin tuna Thunnus albacares. J. exp. Biol. 200, 1987–1997.
LAI, N. C., GRAHAM, J. B., LOWELL, W. R. ANDLAURS, R. M. (1987).
Pericardial and vascular pressures and blood flow in the albacore tuna, Thunnus alalunga. Exp. Biol. 46, 189–192.
LUCAS, M. C. (1994). Heart rate as an indicator of metabolic rate and
activity in adult Atlantic salmon, Salmo salar. J. Fish Biol. 44, 889–903.
MAGNUSON, J. J. (1969). Digestion and food consumption by skipjack tuna (Katsuwonus pelamis). Trans. Am. Fish. Soc. 98, 379–392. MAGNUSON, J. J. (1978). Locomotion by scombrid fishes:
hydromechanics, morphology and behavior. In Fish Physiology, vol. 7 (ed. W. S. Hoar and D. J. Randall), pp. 239–313. New York: Academic Press.
NAKAMURA, E. L. (1972). Development and uses of facilities for studying tuna behavior. In Behavior of Marine Animals, vol. 2 (ed. H. E. Winn and B. L. Olla), pp. 245–277. New York: Plenum Press.
NEILL, W. H., CHANG, R. K. C. ANDDIZON, A. E. (1976). Magnitude
and ecological implications of thermal inertia in skipjack tuna, Katsuwonus pelamis (Linnaeus). Env. Biol. Fish. 1, 61–80. PRIEDE, I. G. (1974). The effect of swimming activity and section of
the vagus nerves on heart rate in rainbow trout. J. exp. Biol. 60, 305–319.
PRIEDE, I. G. AND TYTLER, P. (1977). Heart rate as a measure of metabolic rate in teleost fishes; Salmo gairdneri, Salmo trutta and Gadus morhua. J. Fish Biol. 10, 231–242.
SANCHEZ-QUINTANA, D. AND HURLE, J. M. (1987). Ventricular myocardial architecture in marine fishes. Anat. Rec. 217, 263–273. SCHAROLD, J. ANDGRUBER, S. H. (1991). Telemetered heart rate as a measure of metabolic rate in the lemon shark, Negaprion brevirostris. Copeia 1991, 942–953.
SCHAROLD, J., LAI, N. C., LOWELL, W. R. ANDGRAHAM, J. B. (1989). Metabolic rate, heart rate and tailbeat frequency during sustained swimming in the leopard shark Triakis semifasciata. Exp. Biol. 48, 223–230.
STEVENS, E. D. (1972). Some aspects of gas exchange in tuna. J. exp.
Biol. 56, 809–823.
STEVENS, E. D., BENNION, G. R., RANDALL, D. J. ANDSHELTON, G. (1972). Factors affecting arterial pressures and blood flow from the heart in intact, unrestrained lincod, Ophiodon elongatus. Comp. Biochem. Physiol. 43A, 681–695.
SUND, P. N., BLACKBURN, M. ANDWILLIAMS, F. (1981). Tunas and
their environment in the Pacific ocean: a review. Oceanogr. mar. Biol. A. Rev. 19, 443–512.
TIBBITS, G. F. ANDKASHIHARA, H. (1992). Myocardial sarcolemma isolated from skipjack tuna, Katsuwonus pelamis. Can. J. Zool. 70, 1240–1245.
TOTA, B. (1978). Functional cardiac morphology and biochemistry in
Atlantic bluefin tuna. In The Physiological Ecology of Tunas (ed. G. D. Sharp and A. E. Dizon), pp. 89–112. New York: Academic Press.
WHITE, F. C., KELLY, R., KEMPER, S., SCHUMACKER, P. T.,
GALLAGHER, K. R. ANDLAURS, R. M. (1988). Organ blood flow haemodynamics and metabolism of the albacore tuna Thunnus alalunga (Bonnaterre). Exp. Biol. 47, 161–169.