Olfactory neurons display a complex cellular phenotype characterized by the expression of specific odor receptor (OR) genes and by the appropriate synaptic targeting of second-order neurons in the brain. Large numbers of putative OR genes have been identified in various species; estimates from fish to mammals range from 100 to 1000 OR genes per individual (Buck and Axel, 1991; Levy et al. 1991; Parmentier et al. 1992; Ngai et al. 1993b; Korsching et al. 1993; Baier and Korsching, 1994; Freitag et al. 1995; Ayer-Le Lievre et al. 1995; Barth et al. 1996; Byrd et al. 1996). Two recent studies indicated that neurons expressing a given OR gene project their axons to one or two spatially conserved glomerular targets in the olfactory bulb (Ressler et al. 1994; Vassar et al. 1994); an earlier study showed that insect olfactory neurons project to spatially conserved glomerular domains defined by the odorant specificities of the neurons (Hannson et al. 1991, 1992). These studies substantiate many other reports that have suggested a topographic organization between olfactory neurons and the
olfactory bulb (Stewart et al. 1979; Greer et al. 1981; Lancet et al. 1982; Laing et al. 1985; Astic et al. 1987; Panhuber and Laing, 1987; Royet et al. 1987, 1989; Guthrie et al. 1993; Kauer and Cinelli, 1993; Stewart and Brunjes, 1993; Baier et al. 1994). A particularly interesting feature of this organization is that adult neurons expressing a given OR phenotype do not reside in spatially conserved positions in the olfactory epithelium, but rather are distributed in apparently random fashion among neurons expressing other OR genes (Ngai et al. 1993a; Ressler et al. 1993; Strotmann et al. 1992, 1994; Vassar et al. 1993). Nevertheless, the axons of these randomly distributed neurons project to spatially conserved glomeruli in the olfactory bulb (Ressler et al. 1994; Vassar et al. 1994).
Three general mechanisms have been discussed to explain the specification of olfactory neuron phenotype (Ngai et al. 1993b; Chess et al. 1994): (1) phenotype may be specified in response to extrinsic positional cues from the periphery; (2) phenotype may be specified in response to target JEB0495
Olfactory neurons have a complex phenotype characterized by their expression of a specific odor receptor (OR) gene and their targeting of an equally specific locus in the olfactory bulb. In the adult fish, olfactory neurons expressing specific ORs are broadly distributed in the epithelium, intermingling with neurons expressing other OR phenotypes. This distributed adult pattern has led to the suggestion that olfactory neuron phenotype is determined by a stochastic process, independent of external positional cues. However, when the fish olfactory system is established during embryogenesis it is simple in its organization, with few olfactory neurons and an olfactory epithelium that has not yet folded into the adult morphology. It is possible that positional cues might act in the embryo to establish an initial population and pattern of olfactory neuron phenotypes and that subsequent morphogenesis and neuronal addition lead to the randomized distribution of neurons. To test this possibility, we examined the spatial patterns of olfactory
neurons expressing specific OR genes in 48 h embryos, a time of relative simplicity in the developing olfactory epithelium. Three-dimensional plots of neuron distributions were made, and comparisons of OR expression patterns were made between right and left epithelia, between individual animals and between different OR genes. The patterns of OR gene expression were not conserved in these comparisons. Mathematical analysis of 21 epithelia for the degree of order in the distribution of olfactory neurons argued strongly that the neurons expressing given ORs are randomly distributed in the 48 h embryos. These results are consistent with those observed from adult tissue and support models suggesting that extrinsic positional cues do not have a major role in specifying olfactory neuron phenotypes.
Key words: odor receptor, pattern formation, zebrafish, embryogenesis, gene expression, Danio rerio.
Summary
Introduction
SPATIAL PATTERNS OF OLFACTORY NEURONS EXPRESSING SPECIFIC ODOR
RECEPTOR GENES IN 48-HOUR-OLD EMBRYOS OF ZEBRAFISH DANIO RERIO
RICHARD G. VOGT1,*, SARA M. LINDSAY1, CHRISTINE A. BYRD2 ANDMING SUN1
1Department of Biological Sciences, University of South Carolina, Columbia, SC 29208, USA and
2Department of Biological Sciences, Western Michigan University, Kalamazoo, MI 49008, USA
Accepted 31 October 1996
interactions/feedback from the olfactory bulb; or (3) phenotype may be specified by some stochastic process that is intrinsic to the neuron itself. Peripheral cues have been dismissed primarily because of the apparently random distribution of adult olfactory neurons expressing specific OR genes and the difficulty of resolving such a pattern by the action of extrinsic positional information (Ngai et al. 1993a; Ressler et al. 1993; Strotmann et al. 1992, 1994; Vassar et al. 1993). Target feedback has been dismissed in part because, in some species, OR expression appears to precede the embryonic formation of target mitral cells and glomeruli (Vassar et al. 1994; Strotmann et al. 1995; Sullivan et al. 1995; Ayer-Le Lievre et al. 1995; Leibovici et al. 1996). An intrinsic stochastic mechanism is thus favored because of the apparent absence of reliable extrinsic signals to determine neuronal phenotype (Ngai et al. 1993a; Chess et al. 1994; Lewin, 1994; Ressler et al. 1994; Vassar et al. 1994).
The published observations of apparently random distribution of neurons expressing specific OR genes have been based only on adult tissue; it remains possible that the adult pattern results from a more highly ordered embryonic condition when the olfactory tissue is less morphologically complex. One of the more thorough examinations of the spatial pattern of OR expression was performed in adult catfish (Ngai et al. 1993a,b). The positions of neurons expressing specific OR genes were compared between two adjacent lamellar faces of the olfactory rosette; the patterns did not overlap and the neuronal positions were interpreted therefore as being non-conserved (Ngai et al. 1993a). While adjacent lamellar faces might be viewed as homologous structures, they are in the strict sense different regions of a highly folded epithelium; neurons in different faces could be responding to different positional cues. Furthermore, when the fish olfactory system is first established during embryonic and juvenile development, it is much simpler in its organization, and the olfactory epithelium has not yet folded into the adult morphology. It remains possible that the complex distributed pattern observed in adults results from a more highly ordered condition in the embryo.
To test whether embryos, like adults, show random spatial patterns of OR expression, we observed the distributions of olfactory neurons expressing specific OR genes in 48 h zebrafish embryos reared at 28 °C. Previous work (Barth et al. 1996; Byrd et al. 1996) on zebrafish reared at 26 °C showed that single neurons expressing OR genes could be detected between 30 and 38 h postfertilization, and that by approximately 50 h small constellations of neurons expressing given OR genes could be detected. From embryo to adult, the olfactory epithelium grows and undergoes dramatic morphological change; in general, the numbers of olfactory neurons expressing a given OR gene increases steadily (Hansen and Zeiske, 1993; Barth et al. 1996; Byrd et al. 1996). A 48 h embryo is about the earliest stage when a complex pattern of neurons can be observed that is at the same time simple enough to analyze readily. Three-dimensional plots of the positions of neurons expressing specific OR genes were made. Positions of neurons were compared between right and
left olfactory epithelia and between different individuals. In addition, neuronal positions within individual epithelia were mathematically analyzed for the degree of uniformity in their distribution. We found that the positions of neurons expressing specific OR genes were not conserved in right and left epithelia, nor were they conserved between individuals; furthermore, the distribution patterns within individual epithelia were statistically random. These results are consistent with those observed from adult catfish (Ngai et al. 1993a) and support models suggesting that extrinsic positional cues do not have a major role in specifying olfactory neuron phenotypes.
Materials and methods
Animals
Embryos of Danio rerio were obtained from an established breeding stock maintained in 75.8 l aquaria at 28 °C on 16 h:8 h L:D cycle (lights on at 07:00 h); breeding stock were initially obtained from a local pet shop. A common filtration system and flow-through water supply served several aquaria and a nursery. Aquaria bottoms were covered with marbles the night before an anticipated embryo collection; embryos were collected by aspiration (Westerfield, 1993). Embryos were allowed to develop in the same aquarium water and conditions as their parents. A nursery tank received aquarium water from the common filtration system via two inputs: one subsurface, and several above-water drip outlets constructed from a drip irrigation system purchased from a local garden supplier. Beakers (1 l) with screened bottoms (250µm Nitex mesh) were immersed in water in the nursery tank and situated beneath drip outlets (drip rate was 4 l h−1); embryos were allowed to develop in these beakers. In this study, all work was carried out on embryos collected and fixed in the late morning of the second day postfertilization (i.e. approximately 48 h embryos). The data presented are from a single fertilization group; the experiment was repeated, using a second fertilization group, with consistent results.
In situ hybridization analysis of odorant receptor expression Three previously described putative OR gene clones were used as probes for in situ hybridization studies: ZF-1A, ZF-1I and ZF-39 (Byrd et al. 1996). Each clone was derived from a heterogeneous 520 bp polymerase chain reaction (PCR) product of amplified zebrafish genomic DNA; products were cloned into pBluescript II (SK+) (Stratagene) at the EcoRI site. Antisense digoxigenin-incorporated (Boehringer-Mannheim) RNA probes were synthesized and subsequently alkaline-degraded to approximately 150 base length as previously described (Byrd et al. 1996).
100 ng ml−1 for each probe. Final staining required a 4 h
incubation at 37 °C. Staining was halted by transferring tissue to a pre-chilled (4 °C) stopping solution (10 mmol l−1
Tris–HCl, 1 mmol l−1EDTA, pH 8.0); stain was stable in this
solution for several days.
Hybridizations were performed on groups of 20 embryos for each probe condition; each hybridization set was repeated with consistent results. Positional analysis was performed on 15 embryos (five with probe ZF-1A, three with probe ZF-1I and five with probe ZF-39, and two with a mixture of all three probes). Variation between individuals was observed in the numbers of positively hybridizing neurons within each group (see Fig. 2; Table 1). The individuals chosen for analysis were judged to be representative; no individual showed spatial conservation of expression pattern between right and left epithelia.
For the adult rosette shown in Fig. 1B, several 6-month-old adult fish (progeny of our breeding stock) were anesthetized in cold water (4 °C), their heads were isolated and the epithelial coverings of the olfactory rosettes were partially removed. The tissue was fixed overnight in 4 % PFA in PBS at 4 °C and treated as above. Heads were hybridized with individual probes at concentrations of 100 ng ml−1. Following final staining, the
rosettes were dissected from the heads, dehydrated to 100 % ethanol, and cleared in a 1:2 mixture of benzyl alcohol (Sigma) and benzyl benzoate (Sigma). Rosettes were positioned upside down in a depression microscope slide in clearing solution and photographed in bright field through a 10×objective (UPlanFl, Olympus, MX 60 microscope equipped with a 2.5× photographic ocular). Optical sections were photographed every 10µm throughout the depth range of positively staining neurons (approximately 200µm); staining was homogeneous throughout the range.
Positional analysis of odorant receptor expression patterns in embryos
Individual embryos were embedded in a small droplet of low-melting-point agarose (SeaKem) on the surface of a standard microscope slide. The embryos were positioned ventral side up, with stained cells of both right and left olfactory epithelia in the same plane of sharpest focus. At 48 h, the embryos’ heads curve ventrally, orienting the plane of the olfactory epithelia parallel to the ventral position of the embryo. Embryos were photographed under dark field through a 20× objective (UPlanFl, 2.5× photographic ocular; color transparencies). Optical sections were photographed at the level of the soma, where nuclei were most discernible within a ring of stained cytoplasm; micrometer positions on the focus knob were noted, providing the z-coordinates of the individual neurons indicated in Figs 3 and 4. Typically 2–4 optical sections were required and photographed for each specimen.
Color transparencies (35 mm) were digitized using a Nikon Coolscan film scanner, uniform areas were scanned from each transparency at 2700 dots per inch (dpi) resolution; these images were processed using Adobe Photoshop and printed as black-and-white transparencies using a Kodak ColorEase dye
sublimation printer. Final image sizes were 6″×3″at 300 dpi; the full 6″ width represented 338µm. Such an image set is shown in Fig. 3.
To obtain the x- and y-coordinates for Fig. 4 and Table 1, the black-and-white transparencies for a given individual were overlaid on a light box to obtain correct alignment, and registration holes were created using a syringe needle. Coordinate positions were obtained by placing the transparency over graph paper and reading numerical positions from the graph paper (0.25″ graph paper units represented 14.08µm); the x=0 position was placed in the symmetrical midpoint between left and right eyes. Neurons of the left olfactory epithelia were thus given negative x values while neurons of the right epithelia were given positive x values. The z-coordinate positions were taken (in µm) directly from the focusing knob micrometer on the microscope. Identities of positively staining cells were confirmed from blue-stained cells on the original color transparencies.
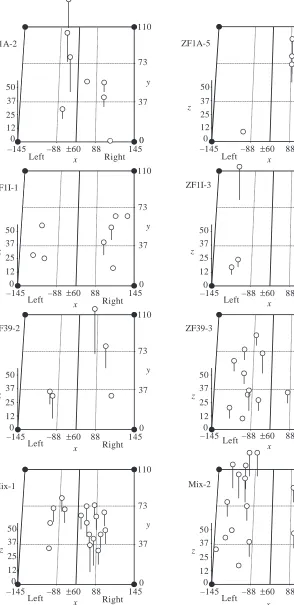
The plots shown in Fig. 4 were created using SAS Graph for OS/2 (6.08; SAS Institute, Cary, NC) and Corel Draw. Minimal y and z values are set at 0µm. For the x values, a standard 120µm mid-region (x-origin ± 60µm) was removed from each graph in order to condense the figure; such a mid-region is included in Fig. 3, and the effect of its omission can be seen in plot 1A-5 in Fig. 4. Positions of neurons are represented as three-dimensional balloon plots; the x- and y-coordinates are indicated by the base of the ‘sticks’, while the z-coordinates are indicated by the length of the ‘sticks’ (i.e. height of balloon). The plots are tilted at 45 ° to allow best observation of all three coordinates.
Clark and Evans analysis of randomness in neuron distribution
The distribution of neurons expressing ORs was analyzed using the Clark and Evans (1954) test for deviation from randomness. This technique, which is standard for assessing patterns based on maps of individuals in a population (Krebs, 1989), is based on measurements of the distance between nearest neighbors. For every neuron that expressed ORs, we calculated the straight-line distance (c) to each of its neighbors, using the Pythagorean theorem, a2+b2=c2, where a is the
difference between x-coordinates of adjacent points and b is difference between y-coordinates of adjacent points. The minimum distance defines the nearest neighbor. We then calculated the mean distance to the nearest neighbor, rA, for
the neurons in each map; right and left olfactory epithelia were analyzed separately. For a population that has a random spatial pattern, the expected distance to the nearest neighbor is:
rE = 1/2√ρ , (1)
where ρis the density of individuals. The index of aggregation is calculated by:
R = rA/rE. (2)
approaches an upper limit of approximately 2.15. The Clark and Evans test determines the significance of deviation from randomness as follows (see Krebs, 1989):
Z = (rA– rE)/sr, (3)
where Z is the standard normal deviate, sris the standard error
[image:4.595.196.562.439.761.2]of the expected distance to the nearest neighbor (=0.26136/√nρ), n is the number of individuals in the study area and ρ is the density of individuals in the study area. If |Z|>1.96, then we reject the null hypothesis of random spacing, with 95 % confidence.
In our calculations, the study area was 7931µm2, the
rectangular area defined by minimum and maximum x,y-coordinates of neurons expressing ORs. For each map of neurons, we calculated an index of aggregation, R, and tested for deviation from randomness as above.
Results
Spatial patterns of OR gene expression in adult and embryonic (48 h) zebrafish
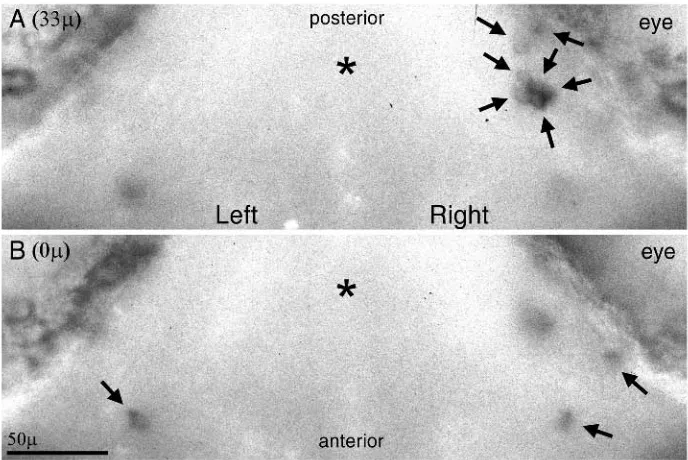
The number of neurons expressing a specific OR gene increases dramatically from embryo to adult. Fig. 1A,B compares the expression pattern of a single OR gene (ZF-1I) in a 48 h embryo and a 6-month-old adult. In Fig. 1A, the embryonic epithelium is visible as a small oval patch; three neurons expressing ZF-1I are visible. In Fig. 1B, an optical
section through an adult rosette reveals a more or less homogeneous scattering of positively hybridizing neurons distributed throughout the rosette. In this particular rosette, positively hybridizing neurons were homogeneously distributed through a depth of 200µm; the optical section shown is from approximately 100µm depth, and stained neurons ranging through approximately 20µm depth are visible. Equivalent results were observed using probes ZF-1A and ZF-39.
The embryonic pattern of neurons expressing specific OR genes differs between right and left olfactory epithelia. This can be seen clearly in Fig. 1C,D which compares the right and left epithelia of a 48 h embryo hybridized with a mixture of probes ZF-1A, ZF-1I and ZF-39. All of the positively hybridizing cells in the left epithelium (Fig. 1D) are visible in the figure; however, there were additional cells visible in a lower optical plane of the right epithelium (Fig. 1C) which can only be seen in this figure as very faint blurs near the eye.
Three-dimension positional analysis of neurons expressing specific OR genes in 48 h embryos
To examine further the spatial organization of neurons expressing OR genes, the patterns of positively hybridizing neurons were compared among groups of individuals. The x-, y- and z-coordinate positions of stained neurons were determined from optical sections of olfactory epithelia of 13 individuals hybridized with single probes and of two
individuals hybridized with a mixture of all three probes. The numerical distribution of stained neurons per epithelium under the single probe conditions is shown in Fig. 2. An example of one such embryo is shown in Fig. 3.
The coordinate data obtained from optical sections were used to construct three-dimensional plots of positively hybridizing neurons. Plots were made for 15 embryos; plots of eight representative embryos are shown in Fig. 4. The planar positions (i.e. x,y) of cells ranged over an area of approximately 8000µm2(approximately 110µm×70µm). This
area represents the approximate size of the 48 h olfactory epithelium. Individual neurons of 10µm diameter, the approximate size of the 48 h olfactory neurons, would occupy approximately 1 % of this epithelial area, indicating the presence of approximately 100 olfactory neurons at this developmental stage. The depth of neurons (z) ranged over approximately 40µm depending on the specific data set. Some of this range may be due to a slightly tilted orientation of the embryos in the agarose, creating a slight wedge effect (e.g. Mix-2 in Fig. 4). However, the embryonic epithelium itself is approximately 30µm deep, and the positions of neuronal cell bodies are known to range throughout this depth (Byrd and Brunjes, 1995; Barth et al. 1996; Byrd et al. 1996).
Several features are evident from the three-dimensional plots. First, the positions of neurons expressing specific OR genes were visibly non-conserved either between right and left epithelia or between individual embryos (Fig. 4). Second, neurons expressing a given OR gene typically appeared singly, although such neurons appearing in clusters was not uncommon (Table 1). Specifically, of 85 neurons observed in 13 individuals hybridized with single probes, 22 neurons appeared as pairs; one cluster of five neurons was observed (IA-5, right). Neurons were scored as paired or clustered if cell centers were 1 cell diameter or 10µm apart. Third, as the number of neurons expressing a given OR gene increased, that neuronal phenotype became more distributed throughout the
epithelium. Finally, hybridizations with a mixture of all three probes showed a proportionally greater number of stained cells relative to hybridizations using only single probes.
Clark and Evans analysis of randomness in the distributions of neurons expressing specific OR genes
To determine the degree of randomness in the neuronal distribution patterns, we performed a Clark and Evans analysis. This is a standard method used in ecological studies for assessing spatial pattern in the distributions of individuals in a population; an index of aggregation is determined which describes the degree of dispersion in a distribution. An index value of 1 indicates a non-even or random distribution; index
6
5
4
3
2
1
0
Number of epithelia
0 1 2 3 4 5 6 7 8 9 10
[image:5.595.62.298.96.253.2]Neurons per epithelium
Fig. 2. Numerical distribution of positively hybridizing neurons per epithelium. Epithelia were from the 13 individuals hybridized with single probes and analyzed in this study. Right and left epithelia are considered separately; comparisons between right and left epithelia are presented in Table 1.
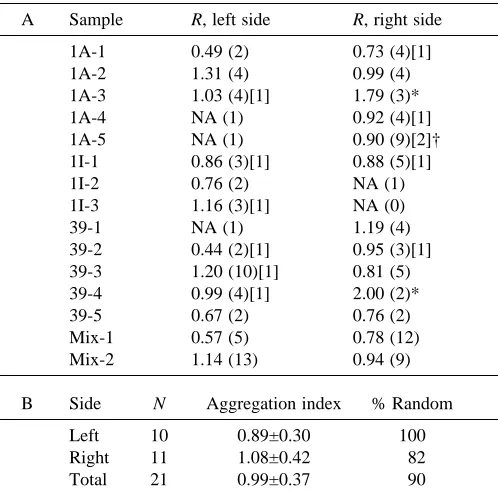
Table 1. Zebrafish olfactory neuron expression: indices of aggregation
A Sample R, left side R, right side
1A-1 0.49 (2) 0.73 (4)[1]
1A-2 1.31 (4) 0.99 (4)
1A-3 1.03 (4)[1] 1.79 (3)*
1A-4 NA (1) 0.92 (4)[1]
1A-5 NA (1) 0.90 (9)[2]†
1I-1 0.86 (3)[1] 0.88 (5)[1]
1I-2 0.76 (2) NA (1)
1I-3 1.16 (3)[1] NA (0)
39-1 NA (1) 1.19 (4)
39-2 0.44 (2)[1] 0.95 (3)[1] 39-3 1.20 (10)[1] 0.81 (5) 39-4 0.99 (4)[1] 2.00 (2)*
39-5 0.67 (2) 0.76 (2)
Mix-1 0.57 (5) 0.78 (12) Mix-2 1.14 (13) 0.94 (9)
B Side N Aggregation index % Random
Left 10 0.89±0.30 100
Right 11 1.08±0.42 82
Total 21 0.99±0.37 90
Clark and Evans indices of aggregation (R) were calculated to determine the spatial distribution of olfactory neuronal phenotype in 48 h zebrafish embryos.
(A) R values are given for each epithelium; values close to 1 indicate a random distribution; values close to 2 indicate an even (over-dispersed) distribution.
Numbers in parentheses are the number of cells; numbers in brackets are the numbers of clusters.
*The distribution of cells was statistically non-random; in all other cases, the distribution of cells was random.
†There were two clusters, one cluster of five cells; all other clusters were made up of two cells only.
NA, not applicable, the index could not be calculated for fewer than two cells.
(B) Summary of olfactory neuron expression patterns.
Mean (±S.D.) indices of aggregation are given for right, left and all epithelia (only single probe data are included).
[image:5.595.318.567.295.543.2]values approaching 2 indicate increasingly ordered non-random distributions. Clark and Evans analyses were performed on 25 epithelia from 13 single-probe and two mixed-probe individuals (Table 1). Indices of aggregation were generally close to 1, indicating random distributions of neurons expressing ORs in the epithelium. In only two of the 25 epithelia did we obtain values suggesting statistically non-random distributions.
Discussion
Spatial patterns of OR phenotype
Many sensory systems show a topography in their spatial organization that relates to some property of the sensory signal (e.g. Sperry, 1963, vision; Suga, 1978, auditory; Catania et al. 1993, somatosensory). Olfactory systems seem to be uniquely complex in having a large choice of sensory neuron phenotypes defined by the expression of one of 100–1000 different odor receptor genes (e.g. Ngai et al. 1993a); other sensory systems show considerably less complexity in receptor gene diversity. Olfactory systems also appear to be topographically organized; neurons of a given OR phenotype converge on spatially conserved sites in the brain (Hansson et al. 1992; Ressler et al. 1994; Vassar et al. 1994). Interestingly, in the periphery, neurons of a given OR phenotype appear to be randomly distributed, intermingling with neurons expressing different ORs (Ngai et al. 1993a). This peripheral organization may be evolutionarily selected to match the randomly distributed odor molecules the system is designed to detect. What mechanisms govern this spatial organization and the selection of olfactory neuron phenotype? When we initiated our study, a prevailing hypothesis was that olfactory neuronal phenotype is determined by an intrinsic stochastic process independent of extrinsic cues from the periphery or target feedback from the olfactory bulb (Chess et al. 1994). This hypothesis was based,
in part, on the observation that adult olfactory neurons are randomly distributed within the olfactory epithelium (Ngai et al. 1993a). We set out to observe whether this random distribution already existed in the embryonic epithelium.
We examined the spatial pattern of neurons expressing ORs in 30 olfactory epithelia from 15 individual animals using whole-mount in situ hybridization. In all, 124 positively hybridizing neurons were observed, 85 from individuals hybridized with single probes. The numbers of cells expressing a single OR phenotype per epithelium in this population of animals ranged primarily between one and five; two epithelia showed 9 and 10 stained neurons, respectively, as indicated in Fig. 2 and Table 1. Based on an estimate of the area of the 48 h olfactory epithelia and the size of a single olfactory neuron, there may be approximately 100 olfactory neurons at this developmental stage, and thus a given OR phenotype may represent between 1 % and 5 % of expressed phenotypes at this stage. This range is consistent with estimates that there are 25–100 OR genes in zebrafish (Korsching et al. 1993; Barth et al. 1996) and the observation that some of these OR genes are reserved to be expressed later in development (Barth et al. 1996).
[image:6.595.215.559.97.327.2]The distribution patterns of embryonic olfactory neurons expressing single OR genes appears to be non-conserved between epithelia or individuals (Fig. 4) and random within an olfactory epithelium (Table 1), at least for the three OR genes examined. These data can be interpreted as suggesting that the phenotype of embryonic olfactory neurons is not specified by extrinsic positional cues. Extrinsic peripheral cues might exist in two forms. First, there might be some externally produced field of signals whose complexity cells ‘read’ and respond to by expressing the appropriate phenotype. Support for this possibility is weak for olfactory neurons because the spatial patterns of the neuronal phenotype are random within an epithelium and are not conserved between individuals; thus,
the cells do not appear to be responding to any consistent field. Second, there might be neighbor interactions such as those seen in the emergence of one neuron from a proneural cluster in Drosophila melanogaster, where cells compete to inhibit
their neighbors from acquiring the desired phenotype (Jan and Jan, 1994, 1995). Support for this possibility is also weak. In our study, 22 of 85 neurons occurred as pairs expressing the same phenotype; one cluster was observed consisting of five
ZF1A-2 ZF1A-5 ZF1I-1 ZF1I-3 ZF39-2 ZF39-3 Mix-1 Mix-2 50 73 0 0 ±60 12 25 37 50
–145 –88 88 145
37 y Right Left x z 110 z 73 0 0 ±60 12 25 37 50
–145 –88 88 145
37 y Right Left x 110 73 0 0 ±60 12 25 37 50
–145 –88 88 145
37 y Right Left x z 110 73 0 0 ±60 12 25 37 50
–145 –88 88 145
37 y Right Left x z 110 73 0 0 ±60 12 25 37 50
–145 –88 88 145
37 y Right Left x z 110 73 0 0 ±60 12 25 37 50
–145 –88 88 145
37 y Right Left x z 110 73 0 0 ±60 12 25 37
–145 –88 88 145
37 y Right Left x z 110 73 0 0 ±60 12 25 37 50
–145 –88 88 145
[image:7.595.63.357.158.763.2]37 y Right Left x z 110
neurons expressing the same phenotype. Thus, contact between neurons expressing a given OR seems to occur sufficiently often to suggest that nearest-neighbor inhibition is not working strongly in this system to influence olfactory neuron phenotype, at least at this early stage of development.
The possibility is intriguing that the selection of OR phenotype proceeds in a truly random fashion and that the homogeneous intermingling of neurons expressing different OR genes is a simple consequence of such random determination. Extrinsic signals might still act secondarily to refine or respecify olfactory neuron phenotype. Certainly such refinement occurs in the visual system with respect to changes in synaptic connections in the optic tectum (e.g. Goodman and Shatz, 1993); the corollary in the olfactory system would be the possible refinement of synaptic connections in the olfactory bulb. Unfortunately, there is as yet little concrete information regarding whether olfactory neurons can be influenced to reselect a different OR gene, guided perhaps through neighbor interactions or target feedback, or whether neurons can communicate their OR phenotype to any cells besides their targets or other neurons of the same OR phenotype. Our observation of occasional clustering of cells of a given OR phenotype suggests these cells are not inhibiting local phenotypes or influencing OR gene selection during embryogenesis in the zebrafish.
There are several possible extrinsic processes which could account for the apparently random patterns observed in this and other studies; the chief problems with these include the requirement that an external signal field be maintained throughout growth and morphological change of the epithelium, and the requirement for a cellular mechanism capable of resolving an extrinsic signal into a large number of phenotypic options. For example, our technique detects OR mRNA only when it reaches a sufficient level; this time of detection temporally follows the molecular events which select and activate the expression of specific genes. Furthermore, we examined embryos at least 12–18 h after the earliest observed activation of OR gene expression (Barth et al. 1996; Byrd et al. 1996). It is possible that an extrinsically determined spatial pattern has been activated but is merely latent and arbitrary in its temporal expression, thus giving the impression of randomly distributed phenotypes at the time of observation. However, the production of neurons and their requirement to select a phenotype is continuous and is not restricted to a time of early development. Such a mechanism of early specification would seem problematic to sustain within a growing and morphologically changing epithelium.
External signals which create chaotic or complex patterns that appear random might also result in the apparently random distributions of neuronal phenotypes. While such a mechanism might be sustained through growth and morphological change, it seems problematic in requiring cellular mechanisms for resolving the external signal into 100 or more phenotypic options (i.e. selection of one of 100 OR genes). Such a problem may be simplified by reducing the numbers of OR genes that must be selected by restricting their expression to discrete
spatial zones (e.g. Sullivan et al. 1995) or by temporally regulating specific classes of OR genes (Barth et al. 1996). Nevertheless, a significant number of OR genes must still be selected to be expressed in the random pattern commonly observed, and a cell would still need to resolve the signal into a large number of phenotypic options.
A third possibility is that the random patterns we observed in the embryos are the consequence of genetic variation; these embryos were the progeny of a genetically diverse stock of adults. However, if an extrinsic mechanism were functioning under these conditions, one might still anticipate that the right and left epithelia of individual embryos would show a greater conservation of pattern than we observed; there are no obvious asymmetries in right and left olfactory tissue of juvenile or adult zebrafish to suggest that the neuronal distribution patterns would be selected to be asymmetrical. Furthermore, genetic variation cannot account for the apparently random distribution described in adult catfish, since this description was based on patterns within one individual (Ngai et al. 1993a).
Apparently random distributions might also occur if neurons were to migrate to random positions after becoming extrinsically specified; however, this would, again, require a cell to resolve the signal into a large number of phenotypic options prior to migration. Finally, the occasional neuronal clusters we observed could represent clonally derived cells of one phenotype rather than the random neighboring appearance of phenotypically identical neurons; the appearance of single cells could then result from subsequent migrations from these clonal centers. Presumably though, as the epithelium grows, multiple clonal centers would develop, a condition that would, again, require the maintenance of a multidimensional external signal field as well as cellular mechanisms capable of resolving the signal into a large number of phenotypic options. Nevertheless, while clonal production of neuronal phenotypes seems weakly supported at this time, it is certainly worth investigating as methods of cell lineage marking and genetic manipulation become more routine in zebrafish.
neurons of the same phenotypes and follow them to the appropriate targets. While other possibilities exist, an intrinsic stochastic process which randomly selects neuronal phenotype seems sufficient for initiating such development. Such a process may be required where a large number of related phenotypes must be expressed in a distributed and intermingling fashion, as in the case of the olfactory epithelium. Furthermore, an essentially random process of phenotype selection seems to be consistent with the truly random distribution of the chemical signal that the olfactory system is designed to detect. That is, one could argue that evolutionary selection pressures have guided the peripheral organization of the olfactory system towards randomness in accordance with the properties of the environmental signal, while maintaining a highly ordered arrangement at the level of first synapse in accordance with the anatomical requirements of sensory integration.
Chess et al. (1994) have proposed a mechanistic model for determining olfactory neuron phenotype that involves intrinsic stochastic processes acting on genes that are already restricted to expression within the spatial domain or subdomains of the olfactory epithelium. In mammals, OR genes are known to reside in clusters on several chromosomes; there is as yet no such information available for fish. The proposed mechanism for a stochastic process requires the random selection of a specific OR gene from a cluster of OR genes, possibly via the physical rearrangement of a cis-regulatory site to an appropriate location by the selected gene (Chess et al. 1994). This scheme is supported by examples of several systems in which either gene rearrangement or distant cis-acting elements act as mechanisms to select one of many genes to be expressed in a cell, thus establishing cellular phenotype: for example, beta-hemoglobin; variable regions in immunoglobulin; and red/green opsins. However, as Chess et al. (1994) point out for these examples, no single mechanism dominates, and thus it is not possible to generalize a mechanism from the examples. Furthermore, OR genes residing in clusters located on different chromosomes are expressed in the same spatial domain in the epithelium (Chess et al. 1994). Neurons within a specified domain thus select among OR genes located on different chromosomes. trans-acting elements would therefore seem additionally necessary to regulate and perhaps silence genes residing on different chromosomes so that only a single OR phenotype can emerge in the neuron.
Barth et al. (1996) have recently modified the stochastic model by observing in zebrafish that some classes of OR genes may be temporally restricted in their expression patterns, suggesting that this temporal restriction may lead to spatial restrictions. Temporal restriction could simplify the problem of OR gene selection during early development by reducing the numbers of genes available to be selected. These authors suggest the possibility that temporal regulation might act at the level of the gene cluster, but that genes of a given cluster might then be subject to some stochastic selection mechanism as suggested by Chess et al. (1994). Nevertheless, within a few weeks postfertilization, the full repertoire of OR genes is
available for expression (Barth et al. 1996), giving new olfactory neurons a full range of phenotypic options. These temporal observations are particularly interesting as they point to developmental events in the life history of an organism that might influence OR gene expression postembryonically, such as sexual maturation, metamorphosis in Amphibia, and smoltification and home-stream olfactory imprinting in salmon.
Studies in Drosophila indicate that the phenotype of a sensory neuron can be selected through hierarchical processes in response to extrinsic cues, including those involving nearest-neighbor competitions (e.g. Ghysen and Dambly-Chaudiere, 1993; Jan and Jan, 1994, 1995; Zipursky and Rubin, 1994). However, these studies compare broadly different classes of sensory cells, phenotype differences within a cell lineage or role determination in a small and defined cluster of cells. The selection of subtly different neuronal phenotypes in the olfactory system seems to be considerably more complex in the range of phenotype available (i.e. the large number of OR genes) and in the apparently random intermingling of multiple phenotypes. This olfactory organization may exist for insects as well as vertebrates; olfactory sensilla that respond to diverse plant volatiles are probably arrayed in a similarly distributed and intermingling fashion in the antenna (Lee and Strausfeld, 1990; Boeckh et al. 1985; Vogt, 1995). We might assume that the determination of the olfactory neuron phenotype precedes other events, leading to the selection of an OR gene and the targeting of an appropriate site in the developing brain. However, OR gene and target site are coordinated by some mechanism (Hansson et al. 1993; Ressler et al. 1994; Vassar et al. 1994). Recently, it has been suggested that the OR proteins may also act as cell surface signals in the axonal membranes, contributing either to pathfinding to the bulb or to target recognition at the bulb (Ressler et al. 1994; Singer et al. 1995). This could imply a hierarchy in the expression of olfactory neuron phenotype: first phenotype is selected; then phenotype is expressed by activation of a specific OR gene; and finally the OR protein regulates the selection and expression of the target phenotype.
Whatever the mechanism establishing olfactory neuron phenotype proves to be, our study shows that the apparently random distribution of neurons of specific phenotype is a condition that already exists in the embryo. This random organization may merely be a developmental requirement for regulation of a large number of similar but distinct phenotypes. Alternatively, a random distribution may be the result of evolutionary selection pressures shaping the olfactory epithelium into a topographic map of the randomized spatial organization that characterizes the signal it detects.
University of South Carolina (Venture Fund, R.G.V.) and the National Institutes of Health (NICDC DC-00588, R.G.V.). S.M.L. was supported by a postdoctoral fellowship from the National Institutes of Health (NRSA 5F32NS09695). C.A.B. was supported by the National Institutes of Health (NICHD HD-07323).
References
ASTIC, L., SAUCIER, D. AND HOLLEY, A. (1987). Topographic relationships between olfactory receptor cells and glomerular foci in the rat olfactory bulb. Brain Res. 424, 144–152.
AYER-LELIEVRE, C., LAPOINTE, F. ANDLEIBOVICI, M. (1995). Avian olfactory neurogenesis. Biol. Cell 84, 25–34.
BAIER, H. AND KORSCHING, S. (1994). Olfactory glomeruli in the zebrafish form an invariant pattern and are identifiable across animals. J. Neurosci. 14, 219–230.
BAIER, H., ROTTER, S. AND KORSCHING, S. (1994). Connectional topography in the zebrafish olfactory system: Random positions but regular spacing of sensory neurons projecting to an individual glomerulus. Proc. natn. Acad. Sci. U.S.A. 91, 11646–11650. BARTH, A. L., JUSTICE, N. J. ANDNGAI, J. (1996). Asynchronous onset
of olfactory receptor expression in the developing zebrafish olfactory system. Neuron 16, 23–34.
BOECKH, J., KAISSLING, K.-E. AND SCHNEIDER, D. (1965). Insect olfactory receptors. Cold Spring Harbor Symp. quant. Biol. 30, 263–280.
BUCK, L. ANDAXEL, R. (1991). A novel multigene family may encode odorant receptors: A molecular basis for odor recognition. Cell 65, 175–187.
BYRD, C. A. ANDBRUNJES, P. C. (1995). Organization of the olfactory system in the adult zebrafish: Histological, immunohistochemical and quantitative analysis. J. comp. Neurol. 358, 247–259. BYRD, C. A., VOGT, R. G., JONES, J. AND BRUNJES, P. C. (1996).
Ontogeny of odorant receptor gene expression in the zebrafish, Danio rerio. J. Neurobiol. 29, 445–458.
CATANIA, K. C., NORTHCUTT, R. G., KASS, J. H. ANDBECK, P. D. (1993). Nose stars and brain stripes. Nature 364, 493.
CHESS, A., SIMON, I., CEDAR, H. AND AXEL, R. (1994). Allelic inactivation regulates olfactory receptor gene expression. Cell 78, 823–834.
CLARK, P. J. AND EVANS, F. C. (1954). Distance to the nearest neighbor as a measure of spatial relationships in populations. Ecology 35, 445–453.
FARBMAN, A. I. ANDSQUINTO, L. M. (1985). Early development of olfactory receptor cell axons. Dev. Brain Res. 19, 205–213. FREITAG, J., KRIEGER, J., STROTMANN, J. ANDBREER, H. (1995). Two
classes of olfactory receptors in Xenopus laevis. Neuron 15, 1383–1392.
GHYSEN, A. ANDDAMBLY-CHAUDIERE, C. (1993). The specification of sensory neuron identity in Drosophila. BioEssays 15, 293–298. GONG, Q. ANDSHIPLEY, M. T. (1995). Evidence that pioneer olfactory
axons regulate telencephalon cell cycle kinetics to induce the formation of the olfactory bulb. Neuron 14, 91–101.
GOODMAN, C. S. AND SHATZ, C. J. (1993). Developmental mechanisms that generate precise patterns of neuronal connectivity. Cell 72/Neuron 10 (Suppl.), 77–98.
GREER, C. A., STEWART, W. B., KAUER, J. S. ANDSHEPHERD, G. M. (1981). Topographical and laminar localization of 2-deoxyglucose uptake in rat olfactory bulb induced by electrical stimulation of olfactory nerves. Brain Res. 217, 279–293.
GUTHRIE, K. M., ANDERSON, A. J., LEON, M. ANDGALL, C. (1993). Odor induced increases in c-fos mRNA expression reveal an anatomical ‘unit’ for odor processing in olfactory bulb. Proc. natn. Acad. Sci. U.S.A. 90, 3329–3333.
HANSEN, A. AND ZEISKE, E. (1993). Development of the olfactory organ in the zebrafish, Brachydanio rerio. J. comp. Neurol. 333, 289–300.
HANSSON, B. S., CHRISTENSEN, T. A. ANDHILDEBRAND, J. G. (1991). Functionally distinct subdivision of the macroglomerular complex in the antennal lobe of the male sphinx moth Manduca sexta. J. comp. Neurol. 312, 264–278.
HANSSON, B. S., LJUNGBERG, H., HALLBERG, E. AND LOFSTEDT, C. (1992). Functional specialization of olfactory glomeruli in a moth. Science 256, 1313–1314.
JAN, Y. N. AND JAN, L. Y. (1994). Genetic control of cell fate specification in Drosophila peripheral nervous system. A. Rev. Genet. 28, 373–393.
JAN, Y. N. ANDJAN, L. Y. (1995). Maggot’s hair and bug’s eye: role of cell interactions and intrinsic factors in cell fate specifications. Neuron 14, 1–5.
KAUER, J. S. AND CINELLI, A. R. (1993). Are there structural and functional modules in the vertebrate olfactory bulb? Microsc. Res. Tech. 24, 157–167.
KORSCHING, S., BAIER, H., WELKER, R., SCHWARZ, S. ANDWETH, F. (1993). Towards the coding strategy of the zebrafish olfactory system: A combined anatomical/molecular biological approach. Soc. Neurosci. Abstr. 19, 14.
KREBS, C. J. (1989). Ecological Methodology. New York: Harper & Row Publishers.
LAING, D. G., PANHUBER, H., PITTMAN, E. A., WILLCOX, M. E. AND EAGLESON, G. K. (1985). Prolonged exposure to an odor or deodorized air alters the size of mitral cells in the olfactory bulb. Brain Res. 336, 81–87.
LANCET, D., GREER, C. A., KAUER, J. S. ANDSHEPHERD, G. M. (1982). Mapping of odor-related neuronal activity in the olfactory bulb by high-resolution 2-deoxyglucose autoradiography. Proc. natn. Acad. Sci. U.S.A. 79, 670–674.
LEE, J.-K. ANDSTRAUSFELD, N. J. (1990). Structure, distribution and number of surface sensilla and their receptor cells on the olfactory appendage of the male moth Manduca sexta. J. Neurocytol. 19, 519–538.
LEIBOVICI, M., LAPOINTE, F., ALELLA, P. AND AYER-LELIEVRE, C. (1996). Avian olfactory receptors: differentiation of olfactory neurons under normal and experimental conditions. Dev. Biol. 174, 118-131.
LEVY, N. S., BAKALYAR, H. A. AND REED, R. R. (1991). Signal transduction in olfactory neurons. J. Steriod Biochem. molec. Biol. 39, 633–637.
LEWIN, B. (1994). On neuronal specificity and the molecular basis of perception. Cell 79, 935–943.
NGAI, J., CHESS, A., DOWLING, M. M., NECLES, N., MACAGNO, E. R. AND AXEL, R. (1993a). Coding of olfactory information: Topography of odorant receptor expression in the catfish olfactory epithelium. Cell 72, 667–680.
NGAI, J., DOWLING, M. M., BUCK, L., AXEL, R. AND CHESS, A. (1993b). The family of genes encoding odorant receptors in the channel catfish. Cell 72, 657–666.
PANHUBER, H. ANDLAING, D. G. (1987). The size of mitral cells is altered when rats are exposed to an odor from their day of birth. Dev. Brain Res. 34, 133–140.
LEFORT, A., EGGERICKX, D., LEDENT, C., MOLLEREAU, C., GERARD, C., PERRET, J., GROOTEGOED, A. AND VASSART, G. (1992). Expression of members of the putative olfactory receptor gene family in mammalian germ cells. Nature 355, 453–455.
RESSLER, K. J., SULLIVAN, S. L. AND BUCK, L. B. (1993). A zonal organization of odorant receptor gene expression in the olfactory epithelium. Cell 73, 597–609.
RESSLER, K. J., SULLIVAN, S. L. ANDBUCK, L. B. (1994). Information coding in the olfactory system: Evidence for a stereotyped and highly organized epitope map in the olfactory bulb. Cell 79, 1245–1255.
ROYET, J. P., JOURDAN, F., PLOYE, H. AND SOUCHIER, C. (1989). Morphometric modification associated with early sensory experience in the rat olfactory bulb. II. Stereological study of the population of olfactory glomeruli. J. comp. Neurol. 289, 594–609. ROYET, J. P., SICARD, G., SOUCHIER, C. AND JOURDAN, F. (1987). Specificity of spatial patterns of glomerular activation in the mouse olfactory bulb: computer-assisted image analysis of 2-deoxyglucose autoradiograms. Brain Res. 417, 1–11.
SINGER, M. S., SHEPHERD, G. M. ANDGREER, C. A. (1995). Olfactory receptors guide axons. Nature 377, 19–20.
SPERRY, R. W. (1963). Chemoaffinity in the orderly growth of nerve fiber patterns and connections. Proc. natn. Acad. Sci. U.S.A. 50, 703–710.
STEWART, J. S. ANDBRUNJES, P. C. (1993). Spatial organization and plasticity of the primary and secondary olfactory projections in goldfish. Brain Res. 628, 243–253.
STEWART, W. B., KAUER, J. S. AND SHEPHERD, G. M. (1979). Functional organization of rat olfactory bulb analyzed by the 2-deoxyglucose method. J. comp. Neurol. 185, 715–734.
STROTMANN, J., WANNER, I., HELFRICH, T., BECK, A. ANDBREER, H.
(1994). Rostro-caudal patterning of receptor expressing neurons in the rat nasal cavity. Cell Tissue Res. 278, 11–20.
STROTMANN, J., WANNER, I., HELFRICH, T. AND BREER, H. (1995). Receptor expression in olfactory neurons during rat development: In situ hybridization studies. Eur. J. Neurosci. 7, 492–500. STROTMANN, J., WANNER, I., KRIEGER, J., RAMING, K. ANDBREER, H.
(1992). Expression of odorant receptors in spatially restricted subsets of chemosensory neurons. Neuroreport 3, 1053–1056. SUGA, N. (1978). Specialization of the auditory system for reception
and processing of species-specific sounds. Fedn Proc. Fedn Am. Socs exp. Biol. 37, 2342–2354.
SULLIVAN, S., BOHM, S., RESLER, K. J., HOROWITZ, L. F. ANDBUCK, L. B. (1995). Target-independent pattern specification in the olfactory epithelium. Neuron 15, 779–789.
VASSAR, R., CHAO, S. K., SITCHERAN, R., NUÑEZ, J. M., VOSSHALL, L. B. AND AXEL, R. (1994). Topographic organization of sensory projections to the olfactory bulb. Cell 79, 981–991.
VASSAR, R., NGAI, J. AND AXEL, R. (1993). Spatial segregation of odorant receptor expression in the mammalian olfactory epithelium. Cell 74, 309–318.
VOGT, R. G. (1995). Molecular genetics of moth olfaction: a model for cellular identity and temporal assembly of the nervous system. In Molecular Model Systems in the Lepidoptera (ed. M. R. Goldsmith and A. S. Wilkins), pp. 341–367. Cambridge: Cambridge University Press.
WESTERFIELD, M. (1993). The Zebrafish Book. University of Oregon: Institute of Neuroscience.