Before bone fractures as a result of imposed strains being more than it can bear, there is usually a stage in which microcracking occurs. The microcracking increases the compliance of the bone material, and so increasingly larger deformations are produced for a given increase in load, giving the load/deformation curve a flat top. The ability to undergo large strains, and hence large deformations, by microcracking allows the bone to absorb a considerable amount of energy before fracture (Schaffler et al., 1994; Martin et al., 1996). The ability to microcrack is an important pre-requisite of a bone being tough (Currey et al., 1997; Zioupos et al., 1994).
The types of microcracking observed in bone loaded in tension or in compression are quite different (Tschantz and Rutishauser, 1967; Currey and Brear, 1974; Carter and Hayes, 1977). In compression, the cracks are relatively long, straight, start at obvious stress-concentrators, such as blood channels, and are generally oriented at approximately 30–40 ° to the long axis of the bone. Two extreme types of tensile microcracks are reported in the literature; one type is long (approximately 100µm), is often orientated with the grain of the bone and is associated with planes of weakness such as cement lines and inter-lamellar boundaries (Carter and Hayes, 1977; Vashishth
et al., 1997; Courtney et al., 1996). The other type of tensile crack is tiny (2–10µm where they can be measured), and the cracks form diffuse flame-like arrays orientated roughly normal to the direction of stress (Schaffler et al., 1994; Fazzalari et al., 1998; Zioupos and Currey, 1994). This type of cracking cannot easily be observed using standard Fuchsin staining techniques and conventional light microscopy (Burr and Hooser, 1995), although it may show up as regions of ‘diffuse staining’ (Burr et al., 1997).
Tensile microcracks, seen under laser scanning confocal microscopy (LSCM), usually have a fractal character, in that at low magnification they appear as arrays of rather diffuse cracks and at higher magnification these diffuse cracks are resolved into arrays of cracks, all of which are diffuse, and so on. A difficulty resulting from this fractal character of tensile microcracking is that it is extremely difficult to quantify, because it is not possible to characterise single microcracks or to count them. In this study, we adopt an alternative method, which is to quantify, using LSCM, the amount of light emitted from specimens that have been loaded to greater and greater extents.
The development of microcracking in single specimens of bone has not been examined previously, because the standard JEB1650
During locomotion, the anterior cortex of the equine radius is loaded predominantly in tension, the posterior predominantly in compression. The anterior cortex is relatively strong in tension, the posterior in compression. We investigated the pattern of failure of specimens from the two cortices using laser scanning confocal microscopy.
All specimens were loaded in four-point bending to increasingly higher loads. We quantified the amount of diffuse microcracking on the tensile side of these specimens by observing the amount of light emitted under laser illumination. The amount of light emitted agreed well with subjective estimates of the amount of microcracking. Tensile microcracks first appeared at a strain of approximately 0.004, and all specimens showed
considerable growth in microcrack density once the tensile strain had passed approximately 0.008.
In specimens from the posterior cortex, there was little compressive microcracking, and such cracks as were present were small and diffuse. These specimens failed on the tensile side first. In specimens from the anterior cortex, compression cracks were more numerous, longer and less diffuse, and specimens failed initially in compression.
The patterns of failure in the bone tissues of the two cortices are what would be expected assuming they were adapted to the mode of loading to which they are usually subjected.
Key words: horse, bone, microcracking, mechanical adaptation, tension, compression, stress, strain.
Summary
Introduction
THE DEVELOPMENT OF MICROCRACKING AND FAILURE IN BONE DEPENDS ON
THE LOADING MODE TO WHICH IT IS ADAPTED
GWENDOLEN C. REILLY* ANDJOHN D. CURREY‡
Department of Biology, University of York, PO Box 373, York YO10 5YW, UK
*Present address: Institute of Biomedical Engineering, University and Swiss Federal Institute of Technology, Gloriastrasse 35, 8092 Zürich, Switzerland
‡Author for correspondence (e-mail: [email protected])
method of observing microcracks in bone involves the thin sectioning of specimens (Burr and Stafford, 1990). However, experiments have been performed in which groups of specimens have been cycled in fatigue to differing amounts of stiffness loss and microcracking observed. Burr et al. (1998) examined specimens fatigued over a range of stiffness losses, using conventional light microscopy, and observed more microcracks in loaded specimens (compared with unloaded controls) only after a modulus loss of 15 %, after which microcracking increased with stiffness loss. Schaffler et al. (1996) noted ‘diffuse comminuted’ damage under confocal microscopy in specimens fatigued to 18 % modulus loss or greater; however, stiffness losses below these values were not investigated.
As well as attempting to quantify the amount of microcracking during tensile loading, the present study also examines another phenomenon: the difference in the pattern of fracture of parts of bone that seem to be adapted either to tensile or to compressive loading. The bone in question is the radius of the horse. This bone has a gentle anterior curvature and, as a result, the curvature interacts with longitudinal forces imposed during locomotion to produce bending, so that the anterior cortex is loaded in tension and the posterior cortex is loaded in compression (Rubin and Lanyon, 1982; Biewener et al., 1983a,b). Riggs et al. (1993a,b) showed that this difference in loading pattern is associated with differences in histology. The anterior (or cranial) cortex remodels rather little, and such secondary osteons as are formed have a predominantly longitudinal orientation of the mineral and collagen. The posterior (or caudal) cortex remodels considerably, and the secondary osteons so formed have a much more transverse orientation of the mineral and the collagen (Riggs et al., 1993a; Mason et al., 1995). This difference in the arrangement of the tissue was confirmed by Fratzl et al. (1996) using small-angle X-ray scattering.
These histological differences in the two cortices are, in turn, associated with differences in mechanical properties (Riggs et al., 1993b). In particular, the anterior bone has a higher
Young’s modulus than the posterior bone whether loaded in tension or in compression; the anterior bone is stronger in tension than the posterior bone; the posterior cortical bone is stronger in compression than the anterior bone. Schryver (1978) showed that specimens from the anterior cortex were stiffer and stronger in bending (Table 1).
The present study had two separate purposes. One was to examine qualitatively and quantitatively the development of microcracking in bone as it became more and more damaged. The other was to investigate the failure behaviour of bone material that is apparently adapted to different loading regimes.
Materials and methods
In the present experiments, we loaded specimens from the anterior and posterior cortices of an equine radius in bending. Bending specimens of rectangular cross section experience stresses that are mirror images of each other, either side of the neutral plane, except that one side is loaded in tension, the other in compression. Bone was obtained from an 11-year-old Thoroughbred cross gelding (Equus caballus L.) that was destroyed because it was suffering from intractable colic. The bones were removed after death at the Department of Veterinary Clinical Studies, University of Liverpool, UK. Using an Exakt diamond-bladed bandsaw, we cut cuboidal specimens, approximately 50 mm×4 mm×2 mm, from the mid diaphysis of the left radius, tangentially to the long axis of the bone, so that the long axis was approximately parallel to the longitudinal grain of the bone. Four specimens from the anterior cortex and four from the posterior cortex were ground to the required dimensions using progressively finer grades of wetted carborundum paper. Finally, specimens were polished wet using a fine-grade alumina powder. Specimen dimensions were measured to the nearest 0.01 mm.
[image:2.609.42.559.561.680.2]All specimens were stained in Ringer’s solution (BDH Laboratory Supplies, prepared according to the formula given in Ministry of Health memo 139/Foods) and a water-soluble Na+salt of Fluorescein overnight (18 h). They were then kept
Table 1. Mechanical properties of bone material from the anterior and posterior cortices of the equine radius
Cortex Loading mode in life Tension1 Compression1 Bending2 Bending3
Young’s modulus (GPa) Anterior Tension 22.1±2.1 18.6±2.8 20.1 21.1±1.0 (40) (13) (48) (4) Posterior Compression 15.0±2.5 15.3±2.2 16.2 15.5±1.0
(40) (13) (48) (4)
Ultimate stress (MPa) Anterior Tension 161±18.0 185±9.9 249 232±16.3 (40) (13) (48) (4) Posterior Compression 105±16.0 217±13.3 217 203±20.4
(40) (13) (48) (4)
Data from Riggs et al. (1993b)1, Schryver (1978)2and from the present study3.
Values are means ±S.D. (N) (no standard deviations, available for the data of Schryver, 1978).
frozen at −20 °C until required for testing. Before being tested, they were thawed in Ringer’s solution and then placed in Fluorescein stain for a further 10 min before the first light reading was taken. Specimens were examined at, and just below, the surface for the presence of cracks using a confocal microscope. They were then loaded in four-point bending to a low load (20–25 N) in an Instron 1122 table-top testing machine using a 1 kN load cell. Loading took place in a water bath containing Ringer’s solution and Fluorescein. The inner loading points were 8 mm apart and the outer points were 32 mm apart. The loading rate was 1 mm min−1. This rather low rate was necessary in order that the loading of the bone could be controlled precisely. Specimens were orientated so that the side that came from nearer the periosteum was in tension.
The specimens were removed from the loading jig, and all surfaces were examined using the confocal microscope. They were then reloaded to a higher load (40–50 N), re-examined and so on. The procedure was repeated at progressively increasing loads until specimen failure, which occurred after approximately eight loading cycles. The load/deformation curves were recorded digitally using the ‘Dasylab’ data-acquisition system. Stress, strain and Young’s modulus were calculated using standard beam formulae for four-point bending.
The specimen was considered to have yielded when the load–deformation curve for a particular cycle was clearly no longer linear.
Qualitative analysis
Crack morphology was visualised qualitatively by taking photographs of the tensile and compressive surfaces and the side view of each specimen after each loading cycle. For each specimen, certain regions were rephotographed each time by making use of the coordinate system on the microscope stage. This method gave good-quality images, but it was not possible to quantify the amount of cracking solely from the photographic data.
Quantitative analysis
‘Metamorph’ image-analysis software was used to quantify the amount of light produced by the staining of the specimen. Twenty-four readings were taken from digitally captured images of fields of view spaced roughly evenly along the gauge length of the specimen. The actual field of view was selected randomly across the breadth of the specimen. Twelve readings were taken at the specimen surface and twelve 10µm below the surface, at the same site. For each field of view, of approximately 0.02 mm2, the software calculated the average ‘brightness’ by averaging the grey level (0–255) of the 40401 pixels in the image. The twenty-four readings were averaged to give a ‘mean light intensity’ for each of the eight specimens at each of the 7–10 loading cycles. This procedure was performed only on the tensile side of the specimen because the cracks developed in the compressive side were too few, and too large, for any averaging technique to produce useful results.
In the Results, we refer to events that occur at particular strains and stresses. These values need to be viewed with some caution. The values were calculated using the usual assumptions of beam theory. However, once specimens have yielded, calculated stresses become progressively less accurate. This is because, in a yielded specimen, stress is no longer proportional to strain (Burstein et al.,1972). Once large cracks have started to appear, calculated strains also become inaccurate. For instance, if a specimen cracks into a series of horizontal flakes, in effect becoming a stack of independent beams, the stresses and strains will be considerably smaller than those calculated from the overall deflection of the specimen using beam theory. There is no reliable way of calculating stresses and strains in irregularly damaged specimens.
Results Mechanical tests
Table 1 shows the values of Young’s modulus and bending strength that we determined for the equine radius. Our results are very close to those of Schryver (1978), particularly in the difference between anterior and posterior cortices. Because of the effects of yield, bending strengths are always greater than those found in tensile tests (Burstein et al., 1972) so we cannot compare our strength values with those of Riggs et al. (1993b). However, the difference we find between the values of Young’s modulus of the anterior and posterior cortices (21.1 and 15.5 GPa, respectively) is very similar to the difference between the means of the tensile and compressive moduli of the two cortices (20.3 and 15.2 GPa, respectively) found by Riggs et al. (1993b). This suggests that the properties of the cortices in our bones are similar to those of the bones examined by those workers. Therefore, although we examined only one radius, it is likely that it was typical of mature radii.
Qualitative analysis Tensile microcracks
A
B
[image:4.609.99.506.72.341.2]C
D
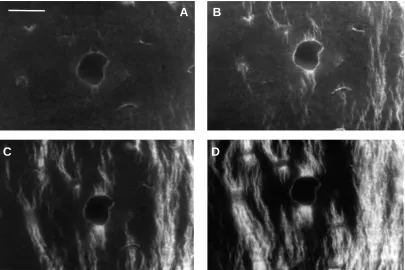
Fig. 1. Tensile surface of a specimen from the anterior cortex of the equine radius. The specimen has been stained with Fluorescein, which stains osteocyte lacunae, canaliculi and microcracks. This field of view shows a longitudinal section through a blood vessel. The same field of view has been rephotographed after loading to the following values: (A) strain (ε)=0.0035, stress (σ)=69 MPa; (B) ε=0.0082, σ=183 MPa; (C)
ε=0.0103, σ=229 MPa; (D) ε=0.0241, σ=220 MPa. Microcracks first appear in B (arrowhead) and increase in density over the following cycles. In this and all other photographs, loading is in the horizontal direction. Scale bar, 40µm.
A
B
C
D
[image:4.609.99.505.430.699.2]A
B
C
D
A
B
[image:5.609.106.513.73.339.2]C
D
Fig. 3. Tensile surface of a specimen from the anterior cortex of the equine radius. At the centre of the field of view, a blood vessel has been cut in a transverse/slightly oblique section. Loading was to the following values: (A) strain (ε)=0.0035, stress (σ)=69 MPa; (B) ε=0.0062,
σ=137 MPa; (C) ε=0.0082, σ=183 MPa; (D) ε=0.0133, σ=256 MPa. The field of view is shifted to the left between A and B. There were no cracks to the left of the blood vessel in A in the region where the first cracks are apparent in B (arrowhead). The pattern of cracks running around a blood vessel shown in these pictures is very characteristic of tensile microcracking. Scale bar, 40µm.
Fig. 4. Tensile surface of a specimen from the posterior cortex of the equine radius. At the centre of the field of view is an irregular structure that is probably a remodelling cavity. Loading was to the following values: (A) strain (ε)=0.0064, stress (σ)=100 MPa; (B) ε=0.0095,
[image:5.609.108.513.429.699.2]field of view, and the usual pattern is that crack arrays become more dense rather than that new arrays form. At high strains (approximately 0.012–0.015), some crack arrays became so dense as to appear as a single patch of light (e.g. Fig. 3D). Larger cracks (presumably formed by the coalescence of dense crack arrays) did not form until just prior to failure, at strains of approximately 0.015–0.02.
Microcrack arrays developed in a similar way in specimens from both anterior and posterior cortices, but there were characteristic, although subtle, differences in their morphology. Tensile microcracks in anterior specimens seemed to be smaller, more curly and particularly fuzzy (compare Figs 1 and 3 with Figs 2 and 4). We believe that these differences are related to the fact that the microcracks in anterior specimens were generally at rather larger angles to the line of sight compared with microcracks in posterior specimens, which tended to be at low angles to it. However, we did not try to assess these differences quantitatively.
Compressive microcracks
Microcracks first formed on the compressive side of the specimens at higher strains (0.008–0.010) than those that produced tensile cracks. As strains were increased, more compression cracks, with their characteristic cross-hatched configuration, formed. These compressive cracks could be
tiny, of the order of 5µm (Fig. 5B). However, unlike tensile microcracks, which seemed to be limited in their length to tens of micrometers, many compression cracks were very long, of the order of several hundred micrometers (Fig. 5A).
Anterior cortical specimens formed larger compression cracks than specimens from the posterior cortex and showed large cracks at lower strains, whereas posterior specimens initially formed arrays of small compression cracks and, although large cracks eventually formed, these were surrounded by smaller cracks. Fig. 6 shows the compression surface of an anterior and a posterior specimen. The posterior specimen (Fig. 6B) appears to have many more compression cracks, but they are smaller than those in the anterior specimen (Fig. 6A). Compression cracks in anterior specimens seemed to be orientated at a smaller angle to the specimen’s surface than those in the posterior specimens.
Quantitative analysis
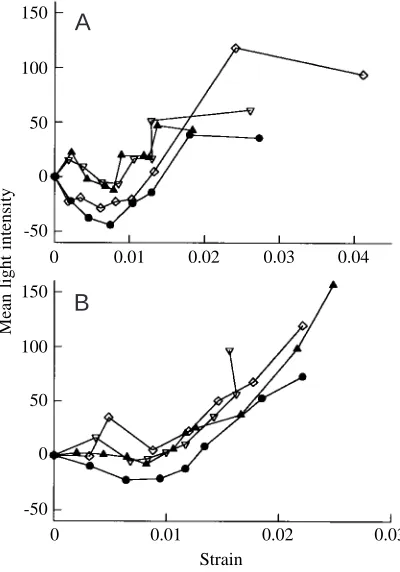
[image:6.609.48.559.97.182.2]Fig. 7A,B shows the mean light intensity as a function of the calculated strain for four anterior and four posterior specimens, respectively. The pattern is similar in specimens from the same cortex. There is a tendency for the mean light intensity to fall initially and then to rise. The initial fall is much smaller than the later rise. After the low point, the mean light intensity of posterior specimens (Fig. 7B) increases sharply Table 2. Mean stresses and strains for four anterior and four posterior specimens at particular damage events on the tensile side
of the specimen
Stress (MPa) Strain
Anterior Posterior Anterior Posterior
First crack appeared by 99±27 72±20 0.0048±0.0010 0.0049±0.0011 Increase in crack density noted 186±17 144±13* 0.0093±0.0011 0.0111±0.0026 Yielded by 185±15 124±4** 0.0090±0.0010 0.0087±0.0006 Curve rise occurs before 192±8 140±9*** 0.0096±0.0013 0.0106±0.0011
Values are means ±S.D. (N=4).
The first two events were assessed from photographs without reference to information about light intensities or mechanics. The third and fourth events were derived from the load/deformation curves and the light-intensity curves, respectively (Fig. 7).
‘Curve rise occurs before’ is the mean value for the cycle following the lowest point reached by the strain versus light intensity curve, except in the case of the curve identified by diamonds in Fig. 7B, in which the lowest point after the initial blip was used.
[image:6.609.98.507.594.724.2]Asterisks indicate significant differences between anterior and posterior specimens (t-test): *P<0.05; **P<0.01; ***P<0.001.
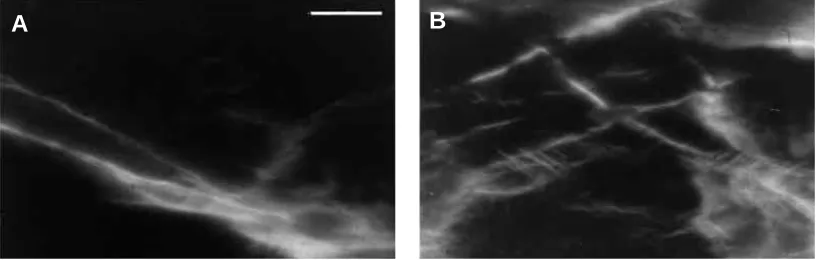
Fig. 5. Compression surfaces of specimens after failure. (A) An anterior specimen, (B) a posterior specimen. Scale bar, 20µm.
and monotonically until failure. The increase in light intensity with strain in the anterior specimens (Fig. 7A), however, is more irregular.
The mean strains and their corresponding stresses at the cycle after the lowest point in the curves shown in Fig. 7 are given in Table 2. To some extent, these values reflect the pattern seen in the photographs. There is good correspondence between the strains at which the visual
impression (‘increase in crack density noted’), the mechanical event (‘yielded by’) and the brightness change (‘curve rise occurs before’) occurred. However the image-analysis system was not sensitive enough to detect the initial cracks seen at low strains.
Failure mode
The characteristic mode of failure of specimens from the anterior cortex was initially in compression, with large cracks running from the compression surface to approximately half the depth of the specimen and forming longitudinal cracks several millimetres long. At this point, the specimens did not break into two, but required little additional load in order to break. The fatal cracks that broke through the tensile surface were highly convoluted with very dense tensile microcracks around them.
In contrast, posterior specimens showed fewer large cracks on the compression side prior to failure, although usually there were one or two large cracks (approximately 100µm in length) on the tensile side. They failed catastrophically as soon as the maximum load was reached. The macrocrack initiated on the tensile side and ran cleanly through the specimen; it always started normal to the tensile surface and then bifurcated approximately half-way through the depth. In two cases, a complete ‘butterfly’, characteristic of tensile failure in bending, was produced (Martens, 1985).
Other experiments performed on six radii from six 2-year-old Thoroughbreds in our laboratory (E. L. Batson, G. C. Reilly, J. D. Currey and D. S. Balderson, in preparation) produced load-deformation curves indicating similar differences in failure behaviour between the two cortices to those described here. This fact strengthens the above suggestion that our radius showed behaviour typical of horse radii in general.
Discussion
Relationship between strain and microcracking
We have shown that, in specimens loaded in bending, characteristic microcracking occurs on the tensile surface at
[image:7.609.109.513.74.206.2]A
B
Fig. 6. Compression surfaces of specimens after failure. These fields of view are taken from near the macrocrack that broke the specimen. (A) Anterior specimen, (B) posterior specimen. Scale bar, 200µm.
Fig. 7. Mean light intensity of 24 fields of view (in arbitrary units, normalised by taking the light intensity before loading as zero) plotted against the strain to which the specimens had been loaded just prior to the readings being taken. (A) Four anterior specimens, (B) four posterior specimens. Note that the abscissas in A and B have different scales.
150
100
50
0
Mean light intensity
0.01 0.02 0.03 0.04 -50
0
150
100
50
0
0.01 0.02 0.03 Strain
-50 0
A
[image:7.609.73.273.385.671.2]stresses and strains much lower than those at which the specimen will fail. Microcracking first occurs before the apparent yield point of the load–deformation curve is reached (before there is any measurable loss of stiffness), but a marked increase in microcracking occurs at or just after the yield point (e.g. Figs 3C, 4B). This is in accordance with the suggestion that yield in bone is initiated by the development of microcracking (Zioupos et al., 1994). Because specimens were removed from the loading jig between loading cycles, it was not practicable to estimate damage in terms of reduced stiffness, as has been done in other experiments (Zioupos et al., 1994; Burr et al., 1998; Schaffler et al., 1996). However, a ‘damage estimate’ of the reduction in stiffness at yield, based on Zioupos et al. (1994), was calculated. The secant modulus at yield (maximum stress divided by maximum strain) was divided by the secant modulus for the cycle prior to yield (which, because the load–deformation relationship was linear, was the same as the Young’s modulus) to give a damage estimate of approximately 4 % for all eight specimens. This is much lower than the stiffness losses reported in previous studies of microcracking.
It is a general finding (Currey, 1987; Zioupos et al., 1994) that, in a wide range of bones of very different mineralisation, yield occurs over a narrow range of strains. Table 2 shows that the development of the first cracks, the increase in crack density and yield were reached at very similar strains but at different stresses in specimens from the anterior and posterior cortices. Because the Young’s moduli are so different (see Table 1), it would not be possible for events to happen at the same stress and the same strain. Although it is perhaps to be expected, it is interesting to observe that the development of cracks seems to be strain-driven rather than stress-driven.
This more detailed investigation of microdamage, made using a confocal microscope, showed that structures as small as osteocyte lacunae can act as strain concentrators. Dense clusters of microcrack arrays can be seen at blood vessels, remodelling cavities and osteocyte lacunae (Figs 1–4). Is this partially an artefact caused by the stain being more ‘available’ to the tissue because of its presence in the cavities? We think this unlikely. The pattern of damage around the cavities is just what one would expect if they were acting as stress concentrators. That is, the damage does not spread out uniformly in all directions, but only in directions normal to the applied stress.
Although relationships between cement lines and tensile cracks have been described previously (Carter and Hayes, 1977; Vashishth et al., 1997), effects of blood vessels and osteocyte lacunae on the formation of this type of tiny microcrack have not previously been noted.
The objective measures of light intensity emitted under laser illumination agree well with the observed appearance and development of microcracking made under the confocal microscope, suggesting that if these methods are developed they may be useful for automatic characterisation of the amount of microcracking. There are some problems with the technique at present. One problem is that many fields of view
need to be investigated in each specimen because of variation between light readings caused by the variation in light intensity of different parts of the bone. This variation is due to intense staining of structures such as blood vessels and recently laid-down bone.
Another problem is suggested by the fact that most of our specimens showed an initial decrease in light emission before the yield point was reached (Fig. 7). The reason for this initial decrease is not clear. The most probable explanation is that it is due to the specimens bleaching slightly under the laser light of the confocal microscope. Although the specimens were placed in Ringer’s solution containing Fluorescein during each loading cycle, this staining period presumably did not fully re-stain bleached areas. However, when dense arrays of cracks appeared, the light emitted from them soon overcame the bleaching effect of the laser.
The reason that the increase in light intensity in anterior specimens at higher strains is less regular than in posterior specimens is probably because of the irregular formation of large compressive cracks on the rear side of the anterior specimens. This compression cracking, which is characteristic of anterior specimens, will result in a less-regular relationship between the deformation of the specimen and the strain on the tensile surface, as explained in the Introduction. Posterior specimens, however, behave more regularly, and the beam equations describe the strain situation more accurately.
Failure of horse radius specimens in bending
By using confocal microscopy, we were able to examine the progress of cracking on both the tensile and compressive sides of our bending specimens. The results of these experiments agree well with the results of Riggs et al. (1993b).
During development, the posterior cortex of the radius is much remodelled, and the new Haversian systems formed contain collagen which is orientated in a more transverse direction than in the rest of the bone (Riggs et al., 1993a; Mason et al., 1995). This arrangement increases the bone material’s compressive strength, but makes it considerably weaker in tension. When loaded in bending, the damage on the tensile side consists of rather straight microcracks orientated normal to the direction of stress and presumably somewhat modified by interaction with the orientation of the collagen fibres and associated mineral crystals. Cracking progresses uniformly as the strain is increased, and eventually the bone fails in tension. The compressive side is also damaged, but the compression cracks are very small and do not seem to progress easily; this may be because the orientation of the collagen fibres and mineral crystals diverts the cracks from their preferred direction of propagation.
microstructural scale) and coalescence does not occur until very high strains are reached. When the compressive side reaches the strain at which it starts to be damaged, many more large cracks form than in posterior specimens, and these have a tendency to run longitudinally (along the orientation of the collagen and mineral). The bone fails in two phases: first, a very large compressive crack breaks through the compressive part of the specimen; finally, the specimen breaks with a very convoluted tensile crack.
It is not easy to distinguish the effects of remodelling from those of age, because remodelled bone replaces primary bone. Therefore, if the radius grows roughly axially symmetrically, the average age of the bone material in the posterior cortex, which is highly remodelled, will be less than that in the anterior cortex. Riggs et al. (1993b) reported that they found no differences in the mechanical properties of anterior cortical specimens which had a greater or lesser amount of remodelling, suggesting that it is the type of Haversian system produced that is important, not simply the effect of its youth. Furthermore, they found that the cranial (anterior) cortex showed more anisotropy in Young’s modulus than the caudal (posterior) cortex (indeed, in transverse loading, the anterior cortical specimens were more compliant than the posterior specimens). This again argues strongly for the importance of the type of Haversian system being laid down.
The stresses and strains at which microcracks first appear are greater than those that the horse radius might be expected to undergo during normal locomotion in vivo. In vivo strain-gauge studies report maximum strains of 0.0015 on the anterior surface of the bone and of −0.0026 on the posterior surface (Turner et al., 1975) and maximum stresses of 21.2 MPa and −36.6 MPa, respectively (Biewener et al., 1983b) (compare with Table 2). The facts that the strain imposed during locomotion on the ‘compressive’ cortex is greater than that on the ‘tensile’ cortex and that the strain at which microcracking first appears is greater in compression than in tension suggest that the different distribution of strain in the two cortices may be related to the bone tissue’s ability to withstand these strains without damage.
In conclusion, we have shown that tensile microcracks can occur at very low strains and that they increase in density as strain is increased. However, they do not coalesce to form ‘microcracks’ of 100µm or more in length until very high strains are reached. Compressive microcracks first form at higher strains (which is to be expected given that bone is stronger in compression than in tension; Reilly and Burstein, 1974, 1975); however, once formed, they do have a tendency to grow into long cracks that are likely to lead to fracture of the whole specimen. To our knowledge, this is the first demonstration of a progressive increase in microcracking in single specimens of bone as strain increases.
Furthermore, we have shown that bone material from parts of the equine radius which are subjected in life to characteristically different loading modes (tension or compression) show different patterns of development of microcracking in relation to stress. They also develop
microcracks of somewhat different morphologies, probably related to the bone’s collagen and mineral orientation. When loaded symmetrically in bending, bone from the equine radius fails in the opposite mode to that it experiences in vivo.
Hypotheses have been put forward giving adaptive reasons as to why some bones are curved. At first sight it would seem maladapative to have curvatures in bones that are loaded predominantly longitudinally in compression. Bertram and Biewener (1988) suggested that the function of the curvature may be to allow the remodelling signalling system to work more effectively and that this advantage is greater than the disadvantage of having greater maximum stresses for any given longitudinal load. Our results suggest another reason: that bone can be adapted to be better at resisting the growth of one type of microcrack (either tension or compression) but that this then causes it to be bad at resisting the other type. Therefore, it is better for bone to be loaded in one mode only, so that it can adapt histologically to that mode. In an accident in which the bone may be loaded in the ‘wrong’ direction, this specialisation might be disadvantageous, but this disadvantage is presumably outweighed by the bone being, in general, adapted to the loading to which it is subjected.
We wish to thank Dr Chris Riggs, formerly of the Division of Equine Studies, Department of Veterinary Clinical Studies, University of Liverpool, for providing the radius used in this study. J.D.C. was supported by The Wellcome Trust, Grant No. 040350/Z/94/MP/HA. G.C.R was supported by a BBSRC studentship and by the Wellcome Trust.
References
Bertram, J. E. A. and Biewener, A. A. (1988). Bone curvature:
sacrificing strength for load predictability? J. Theor. Biol. 131, 75–92.
Biewener, A. A., Thomason, J., Goodship, A. and Lanyon, L. E.
(1983a). Bone stress in the horse forelimb during locomotion at different gaits: a comparison of two experimental methods. J.
Biomech. 16, 565–576.
Biewener, A. A., Thomason, J. and Lanyon, L. E. (1983b).
Mechanics of locomotion and jumping in the forelimb of the horse (Equus): in vivo stress developed in the radius and metacarpus. J.
Zool., Lond. 201, 67–82.
Burr, D. B., Forwood, M. R., Fyhrie, D. P., Martin, R. B., Schaffler, M. B. and Turner, C. H. (1997). Bone microdamage
and skeletal fragility in osteoporotic and stress fractures. J. Bone
Mineral Res. 12, 6–15.
Burr, D. B. and Hooser, M. (1995). Alterations to the en bloc basic
fuchsin staining protocol for the demonstration of microdamage produced in vivo. Bone 17, 431–433.
Burr, D. B. and Stafford, T. (1990). Validity of the bulk-staining
technique to separate artifactual from in vivo bone microdamage.
Clin. Orthop. Rel. Res. 260, 305–308.
Burr, D. B., Turner, C. H., Naick, P., Forwood, M. R., Ambrosius, W., Hasan, M. S. and Pidaparti, R. (1998). Does microdamage
accumulation affect the mechanical properties of bone? J. Biomech.
31, 337–345.
(1972). The ultimate properties of bone tissue: the effects of yielding. J. Biomech. 5, 34–44.
Carter, D. R. and Hayes, W. C. (1977). Compact bone fatigue
damage. A microscopic examination. Clin. Orthop. Rel. Res. 127, 265–274.
Courtney, A. C., Hayes, W. C. and Gibson, L. J. (1996).
Age-related differences in post-yield damage in human cortical bone. Experiment and model. J. Biomech. 29, 1463–1471.
Currey, J. D. (1987). The evolution of the mechanical properties of
amniote bone. J. Biomech. 20, 1035–1044.
Currey, J. D. and Brear, K. (1974). Tensile yield in bone. Calcif. Tissue Res. 15, 173–179.
Currey, J. D., Foreman, J., Laketic´, I., Mitchell, J., Pegg, D. E. and Reilly, G. C. (1997). Effects of ionizing radiation on
the mechanical properties of human bone. J. Orthop. Res. 15, 111–117.
Fazzalari, N. L., Forwood, M. R., Manthey, B. A., Smith, K. and Kolesik, P. (1998). Three-dimensional confocal images of
microdamage in cancellous bone. Bone 23, 373–378.
Fratzl, P., Schreiber, L. S. and Boyde, A. (1996). Characterization
of bone mineral crystals in horse radius by small angle X-ray scattering. Calcif. Tissue Int. 58, 341–346.
Martens, M. A. (1985). Mechanical properties of human bone.
Thesis, Catholic University of Leuven. 145pp.
Martin, R. B., Stover, S. M., Gibson, V. A., Gibeling, J. C. and Griffin, L. V. (1996). In vitro fatigue behavior of the equine third
metacarpus: remodeling and microcrack damage analysis. J.
Orthop. Res. 14, 794–801.
Mason, M. W., Skedros, J. G. and Bloebaum, R. D. (1995).
Evidence of strain-mode-related cortical adaptation in the diaphysis of the horse radius. Bone 17, 229–237.
Reilly, D. T. and Burstein, A. H. (1974). The mechanical properties
of cortical bone. J. Bone Joint Surg. 56A, 1001–1022.
Reilly, D. T. and Burstein, A. H. (1975). The elastic and ultimate
properties of compact bone tissue. J. Biomech. 8, 393–405.
Riggs, C. M., Lanyon, L. E. and Boyde, A. (1993a). Functional
associations between collagen fibre orientation and locomotor strain direction in cortical bone of the equine radius. Anat. Embryol.
187, 231–238.
Riggs, C. M., Vaughan, L. C., Evans, G. P., Lanyon, L. E. and Boyde, A. (1993b). Mechanical implications of collagen fibre
orientation in cortical bone of the equine radius. Anat. Embryol.
187, 239–248.
Rubin, C. T. and Lanyon, L. E. (1982). Limb mechanics as a
function of speed and gait: a study of functional strains in the radius and tibia of horse and dog. J. Exp. Biol. 101, 187–211.
Schaffler, M. B., Boyce, T. M. and Fyhrie, D. P. (1996). Tissue and
matrix failure modes in human compact bone during tensile fatigue.
Trans. Orthop. Res. Soc. 21, 57.
Schaffler, M. B., Pitchford, W. C., Choi, K. and Riddle, J. M.
(1994). Examination of compact bone microdamage using back-scattered electron microscopy. Bone 15, 483–488.
Schryver, H. F. (1978). Bending properties of cortical bone of the
horse. Am. J. Vet. Res. 39, 25–28.
Tschantz, P. and Rutishauser, E. (1967). La surcharge mécanique
de l’os vivant. Les déformations plastiques initiales et l’hypertrophie d’adaptation. Ann. d’Anat. Path. 12, 223–248.
Turner, A. S., Mills, E. J. and Gabel, A. A. (1975). In vivo
measurement of bone strain in the horse. Am. J. Vet. Res. 36, 1573–1579.
Vashishth, D., Behiri, J. C. and Bonfield, W. (1997). Crack growth
resistance in cortical bone: concept of microcrack toughening. J.
Biomech. 30, 763–769.
Zioupos, P. and Currey, J. D. (1994). The extent of microcracking
and the morphology of microcracks in damaged bone. J. Materials
Sci. 29, 978–986.
Zioupos, P., Currey, J. D. and Sedman, A. J. (1994). An
examination of the micromechanics of failure of bone and antler by acoustic emission tests and laser scanning confocal microscopy.