When marine mammals submerge, they exhibit a dive response that involves apnea, bradycardia and peripheral vasoconstriction (for a review, see Butler and Jones, 1997). Apnea interrupts respiratory gas exchange and forces the diving animal to use lung, blood and tissue oxygen stores to sustain aerobic metabolism or to switch to anaerobic energy production. The bradycardia decreases cardiac output and causes reflex peripheral vasoconstriction that maintains normal arterial blood pressure (Irving et al., 1942; Scholander et al., 1942; Elsner and Scholander, 1965; Elsner et al., 1966; Murdaugh et al., 1966). During forced submersion and very long voluntary dives, the bradycardia is profound (i.e. less than 10 % of resting heart rate) and organ perfusion is reduced to negligible levels except for the brain, heart, lungs and adrenal
glands (Kerem and Elsner, 1973; Zapol et al., 1979; Blix and Folkow, 1983; Hill et al., 1987). The major effect of these cardiovascular changes is to decrease convective oxygen transport to most tissues in order to conserve oxygen for the brain and heart, two organs that are sensitive to oxygen deficiency and essential for survival when faced with the threat of asphyxia (Elsner and Gooden, 1983). Peripheral organs and tissues receiving reduced blood flow become anaerobic and may lower their metabolic rate (Valtin, 1973; Nelson et al., 1988; Adams and Cain, 1983) or, in the case of skeletal muscle, continue to support aerobic metabolism with endogenous oxygen stores in the form of oxymyoglobin. When these oxygen stores are depleted, peak force development in skeletal muscle decreases (Hogan et al., 1994, 1998) and ATP Printed in Great Britain © The Company of Biologists Limited 1999
JEB1856
Unlike their terrestrial counterparts, marine mammals stop breathing and reduce their convective oxygen transport while performing activities (e.g. foraging, courtship, aggressive interactions, predator avoidance and migration) that require sustained power output during submergence. Since most voluntary dives are believed to remain aerobic, the goal of this study was to examine the potential importance of the dive response in optimizing the use of blood and muscle oxygen stores during dives involving different levels of muscular exertion. To accomplish this, we designed a numerical model based on Fick’s principle that integrated cardiac output (V.b), regional blood flow, convective oxygen transport (Q.O∑), muscle oxymyoglobin desaturation and regional rates of oxygen consumption (V.O∑). The model quantified how the optimal matching or mismatching of Q.O∑to V.O∑affected the aerobic dive limit (ADL). We chose an adult Weddell seal Leptonycotes weddellii on which to base our model because of available data on the diving physiology and metabolism of this species. The results show that the use of blood and muscle oxygen stores must be completed at the same time to maximize the ADL for each level of V.O∑. This is achieved by adjusting V.b (range 19–94 % of resting levels) and muscle Q.O∑ according to the rate of muscle oxygen
consumption (V.MO∑). At higher values of V.MO∑, V.b and muscle perfusion must increase to maintain an appropriate Q.O∑/V
.
O∑ ratio so that available blood and muscle oxygen stores are depleted at the same time. Although the dive response does not sequester blood oxygen exclusively for brain and heart metabolism during aerobic dives, as it does during forced submersion, a reduction in V.b and muscle perfusion below resting levels is necessary to maximize the ADL over the range of diving V.O∑ (approximately 2–9 ml O2min−1kg−1). Despite the reduction in V
. b, convective oxygen transport is adequate to maintain aerobic metabolism and normal function in the splanchnic organs, kidneys and other peripheral tissues. As a result, physiological homeostasis is maintained throughout the dive. The model shows that the cardiovascular adjustments known as the dive response enable the diving seal to balance the conflicting metabolic demands of (1) optimizing the distribution and use of blood and muscle oxygen stores to maximize the ADL over the normal range of diving V.O∑∑ and (2) ensuring that active muscle receives adequate oxygen as V.MO∑increases.
Key words: Weddell seal, marine mammal, Leptonycotes weddellii, dive response, aerobic dive limit, convective oxygen transport. Summary
Introduction
CONVECTIVE OXYGEN TRANSPORT AND TISSUE OXYGEN CONSUMPTION IN
WEDDELL SEALS DURING AEROBIC DIVES
RANDALL W. DAVIS1,* ANDSHANE B. KANATOUS2
1Department of Marine Biology, Texas A&M University at Galveston, 5007 Avenue U, Galveston, TX 77553, USA
and 2Department of Medicine, University of California, San Diego, CA 92093, USA
*e-mail: davisr@tamug.tamu.edu
production switches to anaerobic glycolysis, resulting in the rapid formation of lactic acid (Hochachka et al., 1977). The profound dive response that occurs during forced submergence and long voluntary dives is designed to maximize breath-hold duration to prevent asphyxia (Kooyman, 1975). However, normal organ function and physiological homeostasis are disrupted (Murdaugh et al., 1966; Kooyman et al., 1980). The circulatory and metabolic adjustments that occur during these dives are stressful, and only severe hemorrhagic shock ranks as a comparable threat to homeostasis (Rowell, 1986; Grega and Adamski, 1987; Soini et al., 1992).
During most voluntary dives, the dive response of marine mammals is less profound than during forced submersion (Kooyman and Campbell, 1972; Stone et al., 1973; Ridgway and Howard, 1979; Pasche and Krog, 1980; Hill et al., 1987; Butler and Jones, 1997), and energy metabolism is believed to remain aerobic (Kooyman et al., 1980, 1983; Qvist et al., 1986; Kooyman, 1989). These dives are defined as being within an animal’s aerobic dive limit (ADL), which is the longest dive that a marine mammal can make while relying principally on oxygen stored in the lungs, blood and muscles to maintain aerobic metabolism. Historically, the ADL has been determined by measuring the maximum voluntary dive duration occurring without a post-dive increase in blood lactate concentration (Kooyman et al., 1980, 1983; Ponganis et al., 1997a) or estimated by dividing total body oxygen stores by the rate of whole-body oxygen consumption (Ponganis et al., 1993a). Although the relationship between convective oxygen transport and tissue oxygen consumption during aerobic dives is poorly understood because of the difficulty of making in vivo measurements, most organs and tissues receive sufficient oxygen from the circulation or endogenous oxymyoglobin to maintain aerobic energy production (Kooyman, 1989; Guyton et al., 1995). Measurements of blood chemistry, hepatic perfusion, renal glomerular filtration rate (GFR), muscle nitrogen tension, muscle temperature and oxymyoglobin desaturation in skeletal muscle indicate that some degree of peripheral blood flow is maintained (Ridgway and Howard, 1979; Davis et al., 1983; Castellini et al., 1988; Kooyman, 1989; Ponganis et al., 1993b; Guyton et al., 1995). Organs such as the liver, kidneys and gastrointestinal tract continue to function (Davis et al., 1983), and physiological homeostasis is maintained during the dive (Kooyman et al., 1980, 1983; Castellini et al., 1988). An additional advantage of making short aerobic dives rather than long dives that rely heavily on anaerobic energy production is the shorter recovery time at the surface. The time necessary to metabolize high concentrations of lactic acid and to restore normal blood and tissue pH can be several hours after dives that exceed the ADL (Kooyman et al., 1980). In contrast, only blood and tissue oxygen stores need to be replenished after an aerobic dive, a process that can be accomplished in several minutes. Hence, an animal can spend more time submerged (e.g. foraging) by making many short, aerobic dives rather than a single long dive that produces high concentrations of lactic acid. If blood oxygen is not sequestered for brain and heart metabolism during aerobic dives as it is during forced
submersion and long voluntary dives, then what is the purpose of the dive response during aerobic dives? Why reduce tissue perfusion at all, especially during vigorous swimming when muscle metabolic rate is elevated? The normal mammalian response to exercise is to increase cardiac output and muscle perfusion, not to reduce it (Rowell, 1986; Wagner, 1991). Does the dive response create a conflict between convective oxygen transport and aerobic tissue metabolism, especially in active skeletal muscles? The goal of the present study was to examine the potential importance of the dive response in optimizing the use of blood and muscle oxygen stores during aerobic dives that involve different levels of muscular exertion. To accomplish this, we designed a numerical model that integrated cardiac output, regional blood flow, convective oxygen transport, muscle oxymyoglobin desaturation and regional metabolic rate. The model quantified how the optimal matching or mismatching of convective oxygen transport to tissue oxygen consumption would affect the ADL. We chose an adult Weddell seal (Leptonycotes weddellii) on which to base our model because of available data on the diving physiology and metabolism of this species. However, the model can be used with other marine mammals by substituting the appropriate physiological and metabolic variables. Given the difficulty of measuring the contributions of blood and muscle oxygen stores to whole-body oxygen consumption rates at different levels of tissue perfusion and muscular exertion in vivo, this model is a logical approach to understanding the physiological basis for the ADL. In addition, it provides a useful conceptual framework for developing testable hypotheses for future research and more sophisticated models.
Materials and methods
Theoretical basis for the model: Fick’s principle
A numerical integration technique was used to model the relationship between regional convective oxygen transport (Q.O∑) and the rate of oxygen consumption (V
.
O∑) in a hypothetical Weddell seal during aerobic dives. The numerical process iteratively determined arterial blood oxygen concentration (CaO∑) and venous blood oxygen concentration
CvO∑for various tissues and organs based on equation 1, which describes Fick’s principle, and the circulatory diagram shown in Fig. 1:
V.O∑ = Q .
(CaO∑ −CvO∑) , (1) where Q.is blood flow rate. The six largest regional circulations (i.e. cerebral, coronary, skeletal muscle, splanchnic, renal and cutaneous) were incorporated in the model, although the last three were modeled as a single unit, which included all other organs and tissues (e.g. bone and fat) not covered by the cerebral, coronary and skeletal muscle circulations. The average temporal resolution (i.e. the period between consecutive computations) was 0.25 s.
of oxygen consumption in the tissues is maintained until convective oxygen delivery falls below a critical level and endogenous oxygen stores (skeletal muscle only) are depleted as a result of a combination of ischemia and hypoxic hypoxia. When an organ or tissue no longer has sufficient oxygen to support aerobic metabolism, then the ADL has been reached and the model terminates the dive. We did not consider the use of muscle creatine phosphate in delaying the onset of anaerobiosis and extending the ADL once oxymyoglobin stores in skeletal muscle had been depleted (Butler and Jones, 1997), although this variable could be added to future models.
Assumptions and equations
Organ and tissue masses were based on published values for a 450 kg adult Weddell seal Leptonycotes weddellii (Table 1) (Zapol et al., 1979; Fujise et al., 1985). The resting V.O∑for
Weddell seal organs and tissues were estimated from the metabolic-mass-adjusted V.O∑ for the equivalent organs of a
human or rat (Field et al., 1939; Kety, 1957; Diem and Lentner, 1970) (Table 1). The basal, whole-body V.O∑(897 ml O2min−1
or 2.0 ml O2min−1kg−1) was calculated by summing individual
organ and tissue metabolic rates. The calculated basal metabolic rate was similar to the minimum metabolic rate measured for adult Weddell seals during sleep (Castellini et al., 1992; Ponganis et al., 1993a) and lay between the allometric
prediction (990 ml O2min−1 or 2.2 ml O2min−1kg−1) for
terrestrial mammals generally (Kleiber, 1975) and for fissiped carnivores (715 ml O2min−1 or 1.6 ml O2min−1kg−1)
specifically (McNab, 1989). This is in agreement with Lavigne et al. (1986) (see also Gallivan and Ronald, 1979; Fedak, 1986), who showed that the basal metabolic rates of seals are indistinguishable from those predicted for other mammals.
Resting heart rate (fH) (51.5 beats min−1), cardiac output
(V.b) (42.72 l min−1) and stroke volume (V
s) (0.83 l) were based
on measured values for Weddell seals (Table 2) (Zapol et al., 1979). Resting fH was nearly identical to the allometric prediction (52.3 beats min−1) for a 450 kg mammal, but the
predicted V.b (26.4 l min−1) and V
s(0.51 l) were 38 % less than
the measured values used in this model (Calder, 1984). Comparable allometric differences in V.b and Vs have been
observed for harbor seals (Phoca vitulina) (Ponganis et al., 1990).
During a simulated dive, the reduction in V.b was varied from 19 to 94 % of resting levels (Table 2). For brevity, we hereafter refer to these percentages of resting, predive V.b as
Heart
Coronary
Cerebral
Skeletal muscle
[image:3.609.82.266.71.364.2]Splanchnic/renal/ cutaneous/other
Fig. 1. Simplified circulatory system used in the model. The cardiovascular system was divided into four regional circulations: coronary, cerebral, skeletal muscle and a combined category that included the splanchnic, renal, cutaneous and other circulatory beds.
Table 1. Mass and estimated resting V.O∑for the organs and tissues of a 450 kg adult Weddell seal
Mass V.O∑ V
.
O∑
Organ or tissue (kg) (ml O2min−1kg−1) (ml O2min−1)
Brain 0.6 22.11 13.3
Heart 1.9 59.21 112.5
Muscle 157.5 1.41 216.0
Splanchnic
Liver 8.8 27.71 243.8
Alimentary canal 8.1 10.11 81.8
Kidneys 1.6 38.41 61.4
Spleen 5.9 4.72 27.7
Lungs 5.1 4.52 23.0
Testis 0.1 2.42 0.2
Bone 14.4 0.42 5.8
Skin 25.7 1.62 41.1
Adipose tissue 122.0 0.52 66.8
Other organs (e.g. 2.3 1.43 3.2
tongue, bladder)
Blood 96.0
Total 450.0 2.0 896.6
Values are from Zapol et al. (1979) and Fujise et al. (1985).
V.O∑, rate of oxygen consumption.
1Estimated for the organs of a 450 kg Weddell seal on the basis of
the metabolic-mass-adjusted V.O∑for the equivalent organs of a 70 kg
human (Kety, 1957; Diem and Lentner, 1970) using the equation:
V.O∑seal organ= V
.
O∑human organ(450−0.25/70−0.25) .
2Estimated for the organs of a 450 kg Weddell seal on the basis of
the metabolic-mass-adjusted V.O∑ for the equivalent organs of a
0.15 kg rat (Field et al., 1939):
V.O∑seal organ= V
.
O∑rat organ(450−0.25/0.15−0.25) .
3Estimated for a 450 kg Weddell seal assuming a metabolic rate
equivalent to the metabolic-mass-adjusted V.O∑for skeletal muscle of
[image:3.609.315.564.354.572.2]percent V.b (e.g. 19 % V.b). Most of the reduction in V.b was the result of a decrease in fH. However, on the basis of studies of seals during forced submergence and diving voluntarily (Sinnet et al., 1978; Zapol et al., 1979; Kjekshus et al., 1982; Blix and Folkow, 1983; Ponganis et al., 1990),
Vswas also reduced as fHdeclined. The maximum reduction in Vs in the model was 25 % of the resting value and was
proportional to the reduction in fH. The reduction in cardiac output (i.e. the severity of the dive response) was immediate and remained constant throughout a dive. An ‘anticipatory’ increase in V.b towards the end of a dive was not included in the model.
Except for the brain, where circulation was always maintained at resting levels, we assumed that blood flow to the rest of the body decreased proportionately with V.b during a dive (Elsner et al., 1964; Blix et al., 1976). This assumption is consistent with evidence that the sympathetic nervous system is activated en masse so as to produce a generally uniform peripheral vasoconstriction during forced submersions and trained dives (Stone et al., 1973; Zapol et al., 1979; Kjekshus et al., 1982; Elsner and Gooden, 1983; Blix and Folkow, 1983). The sites of vasoconstriction include arteries larger than small arterioles (Irving et al., 1942; Blix and Folkow, 1983). This allows constriction of peripheral vasculature sites proximal to the competitive influence of tissue metabolites (i.e. autocoids) that are released locally in response to tissue ischemia and are known to have a vasodilator action on the arterioles (White et al., 1973; Rowell, 1986; Grega and Adamski, 1987).
Body oxygen stores were confined to the blood and skeletal muscle in this model, since no oxygen storage capability exists in the splanchnic organs (Dodd et al., 1987) and the heart represents less than 2 % of the total muscle mass. We assumed that lung oxygen was not available during a dive because of the complete functional pulmonary shunt that occurs in Weddell seals at pressures greater than 3–5 atmospheres (2280–3800 mmHg; 1 mmHg=0.133 kPa; approximately 30–50 m deep) (Falke et al., 1985; Reed et al., 1994). The increased ambient pressure during a dive causes the
respiratory bronchioles and alveoli to collapse, forcing air into the bronchi and preventing gas exchange between the lungs and blood. Since adult Weddell seals spend much of their time at depths greater than 50 m (Kooyman et al., 1971; Castellini et al., 1992), this assumption is generally valid, especially for foraging dives. Although the functional pulmonary shunt limits access to lung oxygen during a dive, it also prevents exposure of the blood and tissues to high partial pressures of nitrogen that cause decompression sickness. Even if lung oxygen were available during a dive, it represents only 5 % of the total body oxygen store in Weddell seals (Kooyman and Ponganis, 1998).
To calculate total oxygen stores in the blood, we assumed that the blood volume for a 450 kg Weddell seal was 96 l (Ponganis et al., 1993a) and that 33 % of this volume was arterial blood and 67 % was venous blood (i.e. venules, small and large veins, hepatic sinus and spleen) (Rowell, 1986; Hurford et al., 1996). The blood hemoglobin (Hb) concentration (assuming complete splenic contraction) was
260 g l−1, and the oxygen-binding capacity of Hb was
1.34 ml O2g−1Hb (Kooyman et al., 1980; Qvist et al., 1986;
Ponganis et al., 1993a). This gave a capacitance coefficient of oxygen in blood (βBO∑) of 348 ml O2l−1(260 g Hb l−1blood ×
1.34 ml O2g−1Hb). At the beginning of a dive, we assumed that
the arterial blood was 100 % saturated with oxygen as a result of predive hyperventilation (Kooyman et al., 1980; Qvist et al., 1986; Ponganis et al., 1993a). Mixed venous blood was calculated from equation 2 to be 86 % saturated at the beginning of a dive assuming an oxygen content that was 5 % by volume less (Ponganis et al., 1993a) than an initial CaO∑of
348 ml O2l−1blood.
Sv–O∑ = [(348 −50)/348] × 100 = 86 % , (2)
where Sv–O∑ is the oxygen saturation of mixed venous blood.
We assumed that 35 % of the seal’s body mass was skeletal muscle with a myoglobin concentration of 54 g kg−1muscle
(Ponganis et al., 1993a), an oxygen-binding capacity of 1.34 ml O2g−1myoglobin and complete saturation at the
[image:4.609.53.560.87.201.2]beginning of a dive (Gayeski et al., 1987; Schenkman et al., Table 2. Circulatory variables used in the model for different levels of cardiac output during a dive response
Cardiac output (% resting level)
Variable Resting 94 75 56 37 19
fH(beats min−1) 51.5 48.8 41.6 32.9 23.2 12.5
Vs(l) 0.83 0.82 0.77 0.73 0.69 0.64
V.b (l min−1) 42.72 40.00 32.00 24.00 16.00 8.00
Q.B(l min−1) 0.36 0.36 0.36 0.36 0.36 0.36
Q.H(l min−1) 1.84 1.72 1.38 1.03 0.69 0.35
Q.M(l min−1) 7.90 7.40 5.92 4.44 2.96 1.48
Q.SRC(l min−1) 32.631 30.62 24.42 18.23 12.03 5.84
Resting values are based on data for a 450 kg Weddell seal from Zapol et al. (1979).
1Individual organ and tissue blood flow: splanchnic organs, 14.53 l min−1; kidneys, 12.39 l min−1; skin, 2.14 l min−1; fat, 1.01 l min−1; bone,
2.56 l min−1.
fH, heart rate; Vs, stroke volume; V
.
1997). Arterial, venous and muscle oxygen stores were calculated as:
Arterial blood oxygen (ml) = 96 ×0.33 × 348 = 11 025 , (3)
Venous blood oxygen (ml) = 96×0.67×348×0.86 =19 250 , (4)
Skeletal muscle oxygen (ml) = 450×0.35×54×1.34 = 11 397 . (5)
A Weddell seal therefore has a total oxygen store of 41 672 ml O2(92.6 ml O2kg−1): 27 % in the arterial blood, 46 %
in the venous blood and 27 % in skeletal muscle. This is the maximum amount of oxygen that the seal can store in its blood and muscle. As we shall see below, not all of this is available during a dive.
As blood circulates through the four vascular beds (Fig. 1), the organs and tissues extract oxygen from the blood to meet their respective V.O∑requirements. CvO∑was calculated for each
circulatory bed according to Fick’s principle:
CBvO∑= CaO∑ −(V
.
BO∑/Q.B) , (6)
CHvO∑= CaO∑−(V
.
HO∑/Q.H) , (7)
CMvO∑= CaO∑−(V.MO∑/Q.M) , (8)
CSRCvO∑= CaO∑−(V
.
SRCO∑/Q.SRC) , (9)
where the letters B, H, Mand SRCindicate brain, heart, skeletal muscle and splanchnic organs, kidneys, skin and other peripheral tissues, respectively, and Q. is blood flow rate. However, the extraction coefficient of oxygen from the blood (EBO∑), where EBO∑=(CaO∑−CvO∑)/CaO∑, could never exceed
0.8 (i.e. maximum EBO∑at critical oxygen delivery) during a
single pass of the blood through an organ or tissue. This is similar to the maximum EBO∑ measured in mammals during
hypoxic hypoxia with and without ischemia (Lautt and Graham, 1977; Cain, 1978; Cole, 1983; King et al., 1987; Nelson et al., 1988; Samsel and Schumacker, 1994; Torrance and Wittnich, 1994; Noldge-Schomburg et al., 1996). The
mixed venous blood oxygen concentration (Cv–O∑) was
calculated for the four vascular beds as the difference between
CaO∑and the total oxygen extracted per milliliter of blood:
Cv–O∑= CaO∑−[(V.BO∑+ V.HO∑+ V.MO∑+ V.SRCO∑)/
(Q.B+ Q.H+ Q.M+ Q.SRC)] . (10)
The arterial blood oxygen saturation (SaO∑) and venous
blood oxygen saturation (SvO∑) were calculated for the blood
of each vascular bed as the quotient of their respective oxygen
concentrations (equations 6–10) and a βBO∑ of
348 ml O2l−1blood. The arterial (PaO∑) and venous (PvO∑)
blood oxygen partial pressures were calculated from their respective SaO∑and SvO∑using two polynomial equations fitted
to the oxyhemoglobin dissociation curve (P50=26.9 mmHg;
1 mmHg=0.133 kPa) for adult Weddell seals (Qvist et al., 1981). We assumed that the oxyhemoglobin dissociation curve did not change (i.e. that there was no right shift) during aerobic dives because blood pH remained at a normal value of 7.4 (Qvist et al., 1986).
Evidence obtained during the forced submergence of harbor seals and Weddell seals indicates that Q.B is generally maintained and V.BO∑ does not decline (Kerem and Elsner,
1973; Zapol et al., 1979; Blix and Folkow, 1983). In this model, we assumed that Q.Band V.BO∑remained at resting levels
during a dive and were independent of V.b (Tables 2, 3). We also assumed that the minimum PaO∑and mixed venous blood
[image:5.609.50.566.471.690.2]oxygen partial pressure (Pv–O∑) for normal cerebral metabolism
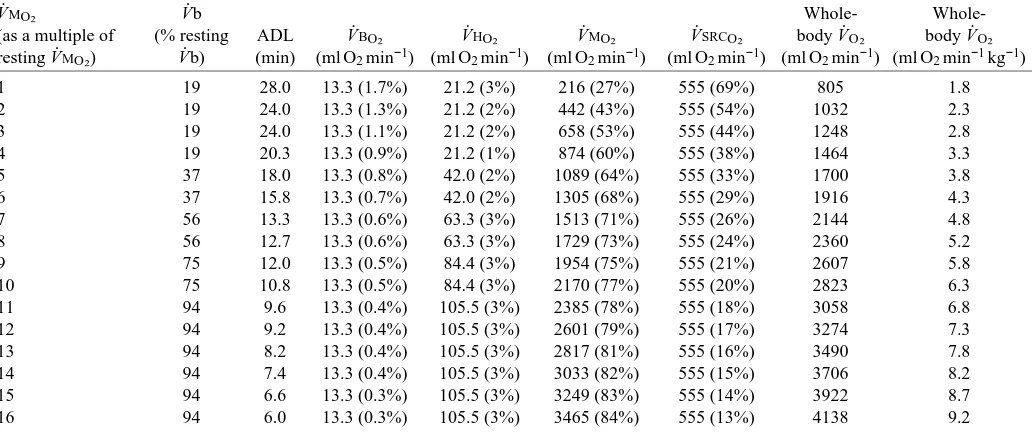
Table 3. Rates of oxygen consumption of the four vascular beds at different levels of muscle metabolism during aerobic dives
V.MO∑ V.b Whole-
Whole-(as a multiple of (% resting ADL V.BO∑ V.HO∑ V.MO∑ V.SRCO∑ body V.O∑ body V.O∑
resting V.MO∑) V.b) (min) (ml O2min−1) (ml O2min−1) (ml O2min−1) (ml O2min−1) (ml O2min−1) (ml O2min−1kg−1)
1 19 28.0 13.3 (1.7%) 21.2 (3%) 216 (27%) 555 (69%) 805 1.8
2 19 24.0 13.3 (1.3%) 21.2 (2%) 442 (43%) 555 (54%) 1032 2.3
3 19 24.0 13.3 (1.1%) 21.2 (2%) 658 (53%) 555 (44%) 1248 2.8
4 19 20.3 13.3 (0.9%) 21.2 (1%) 874 (60%) 555 (38%) 1464 3.3
5 37 18.0 13.3 (0.8%) 42.0 (2%) 1089 (64%) 555 (33%) 1700 3.8
6 37 15.8 13.3 (0.7%) 42.0 (2%) 1305 (68%) 555 (29%) 1916 4.3
7 56 13.3 13.3 (0.6%) 63.3 (3%) 1513 (71%) 555 (26%) 2144 4.8
8 56 12.7 13.3 (0.6%) 63.3 (3%) 1729 (73%) 555 (24%) 2360 5.2
9 75 12.0 13.3 (0.5%) 84.4 (3%) 1954 (75%) 555 (21%) 2607 5.8
10 75 10.8 13.3 (0.5%) 84.4 (3%) 2170 (77%) 555 (20%) 2823 6.3
11 94 9.6 13.3 (0.4%) 105.5 (3%) 2385 (78%) 555 (18%) 3058 6.8
12 94 9.2 13.3 (0.4%) 105.5 (3%) 2601 (79%) 555 (17%) 3274 7.3
13 94 8.2 13.3 (0.4%) 105.5 (3%) 2817 (81%) 555 (16%) 3490 7.8
14 94 7.4 13.3 (0.4%) 105.5 (3%) 3033 (82%) 555 (15%) 3706 8.2
15 94 6.6 13.3 (0.3%) 105.5 (3%) 3249 (83%) 555 (14%) 3922 8.7
16 94 6.0 13.3 (0.3%) 105.5 (3%) 3465 (84%) 555 (13%) 4138 9.2
Values are for the cardiac output that gave the maximum aerobic dive limit for each level of V.MO∑. Values in parentheses are the percentages of whole-body V.O∑.
and function were 22 mmHg (SaO∑=38 %) and 18 mmHg
(Sv–O∑=27 %), respectively. This is comparable to the mean
PaO∑(24.5±2.86 mmHg; mean ±S.D., N=7) in Weddell seals 2 min before surfacing and to the end-tidal PO∑(24 mmHg) of
the first exhalation (assuming that this approximates arterial
PO∑) after 17 min aerobic dives (Qvist et al., 1986; Ponganis et
al., 1993a). These minimum levels of PaO∑ and Pv–O∑ are
greater than the 10–15 mmHg that produces abnormal electroencephalographic (EEG) slow waves in Weddell seals and harbor seals during experimental asphyxia or forced submersion (Elsner et al., 1970; Kerem and Elsner, 1973). EEG slow waves indicate incipient brain metabolic impairment and deterioration of cerebral function. As a result, the model
terminated a dive if PaO∑ decreased below 22 mmHg.
However, the ADL was reached for most (14 out of 16) combinations of V.b and V.MO∑ before PaO∑ decreased to this
level (see Table 5). As a result, the PaO∑of blood perfusing the
brain was generally not a consideration in determining ADL. We assumed that Q.H and V.HO∑ decreased proportionately
with the reduction in V.b (Blix et al., 1976; Kjekshus et al., 1982; Blix and Folkow, 1983) (Tables 2, 3). Although convective oxygen transport to the myocardium decreased during a dive, it was proportional to the reduction in heart work, and the myocardium always received sufficient blood oxygen to maintain aerobic metabolism.
Q.M was also assumed to decrease proportionately with a decrease in V.b (Table 2). Oxygen transported to the muscles in the blood was always used (up to a maximum EBO∑of 0.8)
before oxygen bound to myoglobin because of the lower affinity of Hb for oxygen (Schenkman et al., 1997). Oxygen
not provided by the blood was obtained from oxymyoglobin stores to meet V.MO∑ requirements. V.MO∑ was assumed to be
independent of Q.Mas long as the combination of convective oxygen transport and oxymyoglobin stores was sufficient to meet metabolic demand.
We assumed that Q.SRC decreased proportionately with V.b (Table 2). However, V.SRCO∑remained at resting, predive levels
as long as (1) convective oxygen transport was sufficient to support oxygen demand, (2) EBO∑did not exceed 0.8 and (3) PaO∑was greater than 22 mmHg (Kvietys and Granger, 1982;
Schlichtig et al., 1992). Our assumption of sustained splanchnic and renal V.O∑ is consistent with data on hepatic,
renal and gastrointestinal function in Weddell seals during aerobic dives (Davis et al., 1983). In addition, splanchnic and whole-body V.O∑ are maintained during progressive arterial
hypoxemia in intact pigs down to a PaO∑of 23 mmHg
(Noldge-Schomburg et al., 1996), a value similar to the minimum PaO∑
in this model.
The muscle oxygen diffusive conductance (DMO∑) was
estimated from equation 11 describing Fick’s law of diffusion:
DMO∑ = V.MO∑/(Pc–O∑−PmitoO∑) , (11)
where Pc–O∑ is mean capillary oxygen partial pressure and
PmitoO∑is mitochondrial oxygen partial pressure. We assumed
(1) that PmitoO∑ was close enough to zero to be neglected
(Kurdak et al., 1996), (2) that muscle diffusive conductance was constant at each point along the capillary so that DMO∑/Q.M
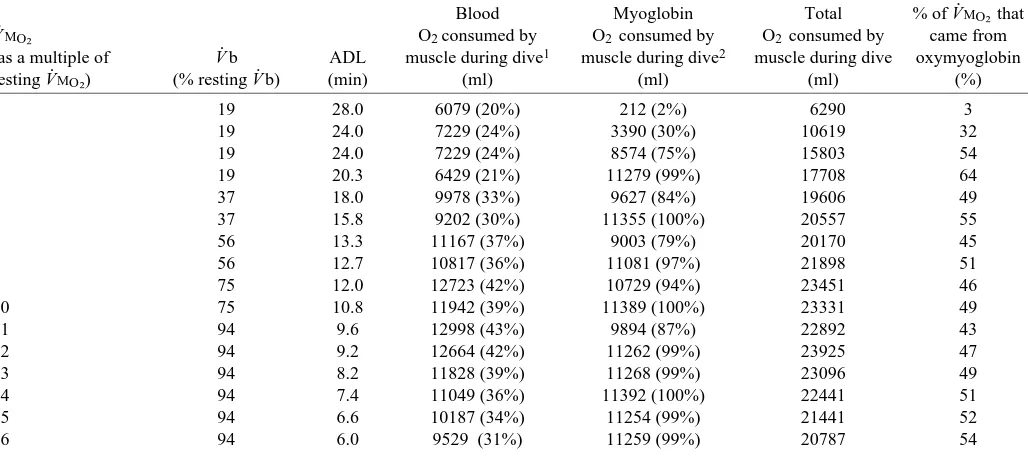
[image:6.609.46.560.99.328.2]was uniform throughout the muscle (Kurdak et al., 1996), and (3) that all residual oxygen in the muscle venous blood was due to diffusion limitation of oxygen transport or to blood flow Table 4. Total oxygen consumed by the muscle from blood and muscle oxygen stores for different levels of muscle metabolic rate
during aerobic dives with a cardiac output that gave the maximum aerobic dive limit
Blood Myoglobin Total % of V.MO∑ that
V.MO∑ O2 consumed by O2 consumed by O2 consumed by came from
(as a multiple of V.b ADL muscle during dive1 muscle during dive2 muscle during dive oxymyoglobin
resting V.MO∑) (% resting V.b) (min) (ml) (ml) (ml) (%)
1 19 28.0 6079 (20%) 212 (2%) 6290 3
2 19 24.0 7229 (24%) 3390 (30%) 10619 32
3 19 24.0 7229 (24%) 8574 (75%) 15803 54
4 19 20.3 6429 (21%) 11279 (99%) 17708 64
5 37 18.0 9978 (33%) 9627 (84%) 19606 49
6 37 15.8 9202 (30%) 11355 (100%) 20557 55
7 56 13.3 11167 (37%) 9003 (79%) 20170 45
8 56 12.7 10817 (36%) 11081 (97%) 21898 51
9 75 12.0 12723 (42%) 10729 (94%) 23451 46
10 75 10.8 11942 (39%) 11389 (100%) 23331 49
11 94 9.6 12998 (43%) 9894 (87%) 22892 43
12 94 9.2 12664 (42%) 11262 (99%) 23925 47
13 94 8.2 11828 (39%) 11268 (99%) 23096 49
14 94 7.4 11049 (36%) 11392 (100%) 22441 51
15 94 6.6 10187 (34%) 11254 (99%) 21441 52
16 94 6.0 9529 (31%) 11259 (99%) 20787 54
V.MO∑, rate of skeletal muscle oxygen uptake; V.b, cardiac output; ADL, aerobic dive limit.
1Values in parentheses are the percentages of total blood oxygen (i.e. 30 275 ml O2) consumed by the muscle for the entire dive. 2Values in parentheses are the percentages of total oxymyoglobin (i.e. 11 397 ml O
heterogeneity (Hogan et al., 1993; Kurdak et al., 1996), with a maximum EBO∑set at 0.8. Pc–O∑was calculated as the mean of PaO∑ and the skeletal muscle blood oxygen partial pressure
(PMvO∑), which were computed from their respective CaO∑and
CMvO∑ (equation 8) using the oxyhemoglobin dissociation
curve for Weddell seals (Qvist et al., 1981). Since PaO∑and
PMvO∑ decreased throughout the dive, Pc–O∑ was recomputed
for each pass of the blood through the muscle and never fell
below 15 mmHg (mean minimum Pc–O∑ 16 mmHg; range
15–19 mmHg). Calculating Pc–O∑ as the mean of PaO∑ and
PMvO∑ instead of using a numerical integration technique
underestimates DMO∑ by 15–20 % (Kurdak et al., 1996).
However, DMO∑ for a diving Weddell seal was so low
compared with that of an exercising terrestrial mammal that this source of error was insignificant.
Computations
The model was run on a standard spreadsheet program (Quattro Pro for Windows Version 6.0, Novell Applications Group, Orem, Utah, USA) for five levels of V.b and 16 levels
of V.MO∑ up to a maximum, whole-body V.O∑ of
9.2 ml O2min−1kg−1. This produced 80 combinations of V
. b and V.MO∑. The general procedure was to set the V.b at a
particular level (e.g. 37 % of the resting level) and then to vary
V.MO∑ from 1 to 16 times the resting level. V.O∑ for the four
vascular beds and the entire body were calculated for each combination. The ADL was reached and the dive terminated
when any organ or tissue did not receive sufficient oxygen through convective oxygen transport or from oxymyoglobin (skeletal muscle only) to maintain aerobic metabolism or when
PaO∑fell below 22 mmHg.
Results
The role of V.b in optimizing the ADL at different levels of muscle metabolism
The ADL decreased in a non-linear fashion with increasing
V.MO∑and whole-body V.O∑for V.b ranging from 19 to 94 % of
resting levels (Fig. 2). Among the five V.b curves, there was a maximum and a minimum ADL for each level of V.MO∑ and V.O∑. For example, the maximum ADL at five times resting
V.MO∑(whole-body V.O∑=3.8 ml O2min−1kg−1) was 18 min for a
V.b of 37 %. In contrast, the minimum ADL for the same V.MO∑
was 10.4 min for a V.b of 94 %. Between the maximum and minimum values of ADL, there were intermediate values for each V.MO∑and V.O∑. This relationship is more apparent if we
plot the maximum and minimum ADL among the five curves for each level of V.MO∑and V.O∑(Fig. 3). The maximum ADL
(i.e. ADL with the optimum V.b) and minimum ADL (i.e. ADL with the least-optimum V.b) decreased in parallel as muscle and whole-body V.O∑increased. The average ratio of the maximum
to minimum ADL for each level of V.MO∑ and V.O∑ was 1.5
[image:7.609.50.565.438.690.2](range 1.4–1.8); that is, the optimum V.b increased the ADL by an average of 50 %.
Table 5. Arterial, mixed venous and muscle venous blood oxygen saturation and partial pressure at the beginning and end of
aerobic dives for different levels of muscle metabolism
Initial SaO∑ Final SaO∑ Arterial Initial Sv–O∑ Final Sv–O∑ Initial SMvO∑ Final SMvO∑
V.MO∑ V.b and PaO∑ and PaO∑ desaturation and Pv–O∑ and Pv–O∑ and PMvO∑ and PMvO∑
(as a multiple (% resting ADL % % rate % % % %
of resting V.MO∑) V.b) (min) (mmHg) (mmHg) (% min−1) (mmHg) (mmHg) (mmHg) (mmHg)
1 19 28.0 100 (119) 42 (23) 2.1 86 (55) 14 (12) 56 (29) 8 (8)
2 19 24.0 100 (119) 52 (27) 2.0 86 (55) 23 (16) 20 (15) 11 (10)
3 19 24.0 100 (119) 52 (27) 2.0 86 (55) 23 (16) 20 (15) 10 (9)
4 19 20.3 100 (119) 52 (27) 2.3 86 (55) 23 (16) 20 (15) 10 (9)
5 37 18.0 100 (119) 42 (23) 3.2 86 (55) 25 (17) 20 (15) 8 (8)
6 37 15.8 100 (119) 42 (23) 3.7 86 (55) 25 (17) 20 (15) 8 (8)
7 56 13.3 100 (119) 43 (23) 4.3 86 (55) 29 (19) 20 (15) 8 (8)
8 56 12.7 100 (119) 43 (23) 4.5 86 (55) 29 (19) 20 (15) 8 (8)
9 75 12.0 100 (119) 38 (22) 5.2 86 (55) 27 (18) 20 (15) 8 (8)
10 75 10.8 100 (119) 38 (22) 5.8 86 (55) 27 (18) 20 (15) 8 (8)
11 94 9.6 100 (119) 41 (23) 6.2 86 (55) 30 (19) 20 (15) 8 (8)
12 94 9.2 100 (119) 41 (23) 6.5 86 (55) 30 (19) 20 (15) 8 (8)
13 94 8.2 100 (119) 41 (23) 7.3 86 (55) 30 (19) 20 (15) 8 (8)
14 94 7.4 100 (119) 50 (26) 6.8 86 (55) 37 (22) 20 (15) 10 (9)
15 94 6.6 100 (119) 53 (28) 7.1 86 (55) 41 (23) 20 (15) 11 (10)
16 94 6.0 100 (119) 53 (28) 7.8 86 (55) 41 (23) 20 (15) 11 (10)
Mean 100 (119) 45 (24) 86 (55) 28 (18) 22 (16) 9 (9)
The ADL was reached and the dive terminated if an organ or tissue became anaerobic or if the SaO∑decreased below 38 %.
V.MO∑, rate of skeletal muscle oxygen consumption; V.b, cardiac output; ADL, aerobic dive limit; SaO∑, Sv–O∑, SMvO∑, arterial, mixed venous
and muscle venous blood oxygen saturation; PaO∑, Pv–O∑and PMvO∑, arterial, mixed venous and muscle venous blood oxygen partial pressure.
If we plot the values of V.b and fHthat give the maximum ADL as a function of V.MO∑ and whole-body V.O∑, we obtain the
relationship shown in Fig. 4. These results show that the dive response should be less pronounced as the level of muscular exertion increases. However, the model predicts that the optimum
fH and V.b are greater than resting levels (i.e. tachycardia) for
V.MO∑values greater than 12 times the resting value (a whole-body V.O∑of 7.3 ml O2min−1kg−1). In the model, we assumed that some
degree of dive response was obligatory so that the maximum fH
and V.b were 94 % of the resting values, even though this did not result in the maximum use of blood oxygen stores at V.MO∑values
greater than 12 times the resting value. We also ran the model at 9 % resting V.b (fH=6.5 beats min−1) to determine whether the
ADL was further enhanced at 1–4 times resting V.MO∑(a
whole-body V.O∑of 1.8–3.3 ml O2min−1kg−1). However, 19 % V
. b gave a higher ADL because convective oxygen transport to the splanchnic organs, kidneys and other tissues (excluding the brain and heart) at 9 % V.b was insufficient to support aerobic metabolism at an SaO∑ value less than 88 %. Hence, the
convective oxygen requirements of organs and tissues other than skeletal muscle established the lower limit of optimum V.b at low levels (1–4 times the resting value) of muscular exertion.
Figs 3 and 4 show that there is not one but a suite of ADLs
that depend on V.O∑and that, within limits, the optimum V
. b and
fH increase with V.MO∑ and V.O∑. Since the ADL is inversely
proportional to V.O∑ (assuming a constant level of blood and
muscle oxygen depletion), the optimum V.b and fHdecrease as ADL increases (Fig. 5). However, for an ADL less than 9.6 min and greater than 20.3 min, optimum V.b and fH are maximally limited to resting levels at the surface and minimally limited (i.e. 19 % V.b) by convective oxygen transport sufficient to maintain aerobic metabolism in all organs and tissues, respectively.
Organ and tissue metabolism
V.BO∑, which was independent of V.b in this model,
represented a very small part (0.3–1.7 %) of whole-body V.O∑
(Table 3). As V.b increased with muscular exertion, V.HO∑
increased in direct proportion to heart work. However, it represented only 1–3 % of whole-body V.O∑, even at the
highest levels of V.b. V.SCRO∑was also independent of blood
flow (i.e. convective oxygen transport was always sufficient to maintain aerobic metabolism), but represented a decreasing percentage (range 69–13 %) of whole-body V.O∑as
muscle metabolic rate increased. In contrast, V.MO∑
represented an increasingly greater percentage (range 27–84 %) of whole-body V.O∑as muscular exertion increased
up to 16 times resting levels. Together, V.MO∑ and V.SCRO∑
accounted for 96–98 % of whole-body metabolic rate at all levels of muscular exertion.
1
ADL (min)
0 5 10 15 20 25 30
2 3 4 5 6 7 8 9
Diving VO2 (ml O2 min
-1 kg-1)
.
19% resting Vb 37% resting Vb 56% resting Vb 75% resting Vb 94% resting Vb . .
. . .
2 3 4 5 6 7 8 9 10 11121314 15 16 Multiple of resting VMO2
[image:8.609.322.543.75.322.2].
Fig. 2. Calculated aerobic dive limit (ADL) for five levels of cardiac output (V.b) as a function of skeletal muscle oxygen consumption rate (V.MO∑) and whole-body oxygen consumption rate (V
.
O∑). Resting V.MO∑was 216 ml O2min−1or 1.4 ml O2min−1kg−1muscle.
ADL (min)
0 5 10 15 20 25 30
2 3 4 5 6 7 8 9
Diving VO2 (ml O2 min-1 kg-1) .
ADL with optimum Vb ADL with least-optimum Vb
. .
1 2 3 4 5 6 7 8 9 10 11121314 15 16 Multiple of resting VMO2
.
Fig. 3. Maximum and minimum aerobic dive limit (ADL) as a function of skeletal muscle oxygen consumption rate (V.MO∑) and
whole-body oxygen consumption rate (V.O∑). All values are from Fig.
2. Optimum and least-optimum cardiac outputs (V.b) refer to the V.b value for a particular V.MO∑ value that gives the maximum and
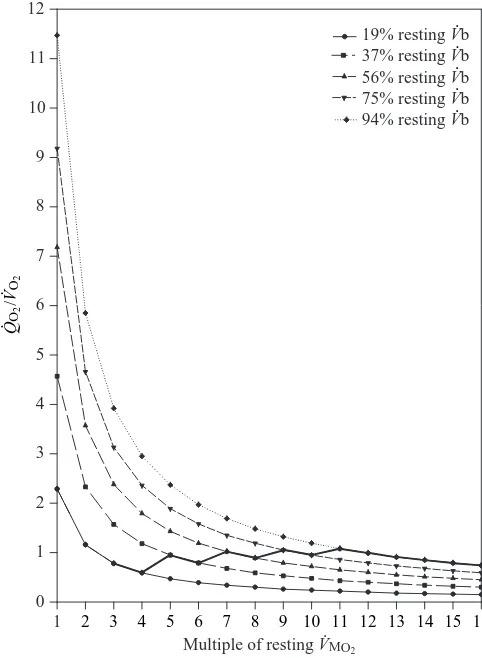
[image:8.609.55.274.76.389.2]Muscle Q.O∑/V
.
O∑ratio
To maximize ADL, the increase in V.b with V.MO∑ can be
explained by the relationship between muscle Q.O∑and V
.
O∑. Fig.
6 shows the muscle Q.O∑/V
.
O∑ratio at the beginning of a dive as
a function of V.MO∑ for the five levels of V.b. The bold line
connecting the five curves is the Q.O∑/V
.
O∑ratio for each level
of V.b that gives the maximum ADL for V.MO∑ranging from 3
to 16 times resting levels. As mentioned above, V.b could not be optimized for 1–2 times resting V.MO∑. The average optimum
muscle Q.O∑/V
.
O∑ratio at the beginning of a dive was 0.88 (range
0.59–1.08). For a Q.O∑/V
.
O∑ ratio below this range, convective
oxygen transport to the muscles was too low. As a result, muscle oxymyoglobin stores were depleted before blood oxygen, and the ADL decreased for all levels of V.MO∑. For a Q.O∑/V
.
O∑ratio above this range, convective oxygen transport to
the muscles was too high. In this case, blood oxygen was depleted before muscle oxymyoglobin stores were desaturated, and again the ADL decreased for each level of V.MO∑. In both
cases, an inappropriate Q.O∑/V
.
O∑ratio resulted in a decrease in
the ADL because the blood and muscle oxygen stores were not completely used. To maximize the use of body oxygen stores and the ADL for each level of exertion, the full utilization of blood (SaO∑not less than 38 %) and muscle oxygen stores must
be completed at the same time. This is achieved by adjusting
V.b according to the level of V.MO∑. As V.MO∑increases, V.b and
muscle perfusion must also increase (up to a maximum of resting, predive V.b and Q.M) so that the Q.O∑/V
.
O∑ ratio stays
within the range 0.59–1.08 at the beginning of a dive. Although the reduction in V.b was kept constant once a dive
began, the muscle Q.O∑/V
.
O∑ ratio declined because CaO∑
decreased continuously as blood oxygen was consumed (Fig. 7). The higher the muscle metabolic rate, the faster the ratio declined. The difference between convective oxygen transport and muscle oxygen requirements was provided by oxymyoglobin. The percentage of V.MO∑provided by the blood
decreased and that provided by endogenous oxymyoglobin stores increased throughout the dive (Fig. 8). At the beginning of dives with a V.MO∑of 1–2 times resting, (Fig. 8A,B), blood
oxygen provided 100 and 93 % of the muscle oxygen consumed, respectively. By the end of these dives, the percentage of V.MO∑provided by the blood had decreased to 76
and 48 %, respectively, with the remainder provided by oxymyoglobin. Because V.b and Q.M(i.e. 19 %) were greater than optimum levels for V.MO∑of 1–2 times resting level, only
3 and 32 %, respectively, of the total oxygen consumed by the muscle was provided by oxymyoglobin and the remainder by the blood (Table 4). As mentioned above, optimizing muscle
Q.O∑by decreasing V
.
b below 19 % decreased the ADL because the splanchnic organs and kidneys became anaerobic much sooner at such a low level of perfusion. As a result, an optimum
V.b and Q.Mresulting in the full use of muscle oxygen stores could not be achieved for dives with these low levels of V.MO∑
even though they still had the highest ADL.
For dives with a V.MO∑ of 3–16 times resting levels
(Fig. 8C–P), the average initial percentage of oxygen provided by the blood was 71 % (range 60–86 %), and this decreased to 31 % (range 27–35 %) by the end of the dive. Conversely, the average initial percentage of oxygen provided by muscle oxymyoglobin was 29 % (range 14–40 %), and this increased to 69 % (range 65–73 %) by the end of the dive. In most cases, the point at which the blood and muscle oxygen each supported approximately half of V.MO∑occurred approximately midway
0 10 20 30 40 50 60 70 80 90 100
2 3 4 5 6 7 8 9
Diving VO2 (ml O2 min-1 kg-1) .
% Resting Vb
fH
.
% Resting cardiac output,
V
b, and heart rate,
f
H
(beats min
-1)
.
1 2 3 4 5 6 7 8 9 10 11 1213 14 15 16
Multiple of resting VMO2
[image:9.609.65.287.443.690.2].
Fig. 4. Optimum cardiac output (V.b) and heart rate (fH) as a function of skeletal muscle oxygen consumption rate (V.MO∑) and whole-body oxygen consumption rate (V.O∑). Optimum refers to values that give
the maximum aerobic dive limit.
ADL (min) 6
0 10 20 30 40 50 60 70 80 90 100
% Resting Vb
fH
.
% Resting cardiac output,
V
b, and heart rate,
f
H
(beats min
-1)
.
8 10 12 14 16 18 20 22 24 26 28
[image:9.609.331.555.489.716.2]through the dives. Convective oxygen transport contributed to muscle metabolism throughout the dive (Q.O∑/V
.
O∑ ratio never
fell below 0.30), although this contribution diminished as CaO∑
decreased. Approximately 51 % (range 43–64 %) of the total oxygen consumed by the muscle came from oxymyoglobin and the remainder from blood oxygen (Table 4).
Blood oxygen desaturation and EBO∑
SaO∑ decreased from 100 % (PaO∑=119 mmHg) at the
beginning of dives to an average of 45 % (PaO∑=24 mmHg) by
the end of dives for each of the 16 levels of V.MO∑(Table 5).
The rate of arterial oxygen desaturation increased with V.MO∑
and ranged from 2.1 to 7.8 % min−1. Sv–
O∑decreased from 86 %
(Pv–O∑=55 mmHg) to an average of 28 % (Pv–O∑=18 mmHg). In
contrast, SMvO∑ decreased from an average of 22 %
(PMvO∑=16 mmHg) to 9 % (PMvO∑=9 mmHg), reflecting the
much higher oxygen requirements and EBO∑of active skeletal
muscle. On average, 55 % of the arterial oxygen and 67 % of the venous oxygen (63 % of the total blood oxygen store; equations 3, 4) were used during aerobic dives. In most cases, the muscle could no longer sustain aerobic metabolism, and the
dive was terminated before SaO∑ fell below 38 %
(PaO∑=22 mmHg). On average, 4961 ml of arterial oxygen and
6267 ml of venous oxygen remained in the circulation at the end of aerobic dives.
As SaO∑ decreased during a dive, EBO∑ increased for the
brain, heart, splanchnic organs, kidneys and other tissues (Fig. 9A,B,D). For the brain and heart, EBO∑never rose above
0.28 and 0.46, respectively. With their low oxygen requirements, convective oxygen transport was more than sufficient to sustain the aerobic metabolism of these two organs at all levels of V.b and SaO∑. Similarly, EBO∑of the splanchnic
organs, kidneys and other tissues remained below 0.32 except for the lowest V.MO∑and V.b values (i.e. V.MO∑=1–4 times resting
levels and V.b=19 %), for which EBO∑increased to a maximum
of 0.66. In contrast, EBO∑ of skeletal muscle was generally
maximized at 0.8 throughout dives at all levels of V.MO∑and V.b
because the product of the optimum muscle Q.O∑/V
.
O∑ ratio
(Fig. 7) and the maximum EBO∑was less than 1. The exception
was for resting V.MO∑and 19 % V.b, for which EBO∑increased
from 0.44 to 0.8 during the dive.
Muscle oxygen diffusive conductance
Average DMO∑ was directly proportional to the percentage
of resting Q.M and was best described by the equation
DMO∑=(3.75×10⁻⁴)Q.M−5.73×10⁻⁴ (r2=0.999, P=0.05)
(Fig. 10). Overall, DMO∑ was dependent on muscle Q.O∑
because EBO∑was maximized (i.e. 0.8) throughout dives with
a V.MO∑of 2–16 times the resting level.
Oxymyoglobin desaturation
The desaturation of oxymyoglobin began immediately upon submergence and increased throughout dives for all V.MO∑
values greater than the resting value (Fig. 11). The immediate reliance on oxymyoglobin to support muscle metabolism in all but one case (i.e. resting V.MO∑) resulted from an optimum Q.O∑/V
.
O∑ ratio that was less than 1.25 (Figs 6, 7) and a
maximum EBO∑of 0.8. As a result, convective oxygen transport
was insufficient [i.e. (Q.O∑/V
.
O∑)×0.8<1] to support muscle
metabolism, and oxymyoglobin was desaturated throughout the dives. On average, oxymyoglobin was 94 % desaturated (range 75–100 %) during dives with a V.MO∑ranging from 3 to
16 times the resting value (Table 4). The average rate of oxymyoglobin desaturation increased linearly with V.MO∑and
was best described by the equation y=1.99x−2.99 (r2=0.97,
P=0.05) (Fig. 12).
Discussion
Why optimize the use of blood and muscle oxygen stores?
Unlike their terrestrial counterparts, marine mammals stop breathing and reduce convective oxygen transport while performing activities (e.g. foraging, courtship, aggressive interactions, predator avoidance and migration) that require sustained power output during submergence. This means that the ability of the pulmonary and cardiovascular systems to deliver oxygen to the muscles and other tissues is compromised
0 1 2 3 4 5 6 7 8 9 10 11 12
19% resting Vb 37% resting Vb 56% resting Vb 75% resting Vb 94% resting Vb . .
. . .
1 2 3 4 5 6 7 8 9 10 11 12 13 14 15 16 Multiple of resting VMO2
.
QO
2
/V
O2
.
[image:10.609.46.287.73.402.2].
Fig. 6. Muscle Q.O∑/V
.
O∑ratio at the beginning of dives for five levels
of cardiac output (V.b) as a function of skeletal muscle oxygen consumption rate (V.MO∑). The bold line connects the optimum
Q.O∑/V
.
O∑ ratios that give the maximum aerobic dive limit (ADL) at
each V.MO∑. Q.O∑, convective oxygen transfer rate in the blood; V.O∑,
compared with terrestrial mammals with unlimited access to atmospheric oxygen. Since most voluntary dives are believed to remain aerobic (Butler and Jones, 1997), it is important that blood and muscle oxygen stores be used optimally to maximize the ADL. Prior to the model presented here, the redistribution of blood flow during aerobic dives has not been examined in terms of optimizing delivery of oxygen to peripheral tissues to sustain ATP synthesis.
How is oxygen distributed to the various organs and tissues to maximize the ADL? On the basis of the results from this model, the answer lies in adjusting V.b and peripheral vasoconstriction to match the level of muscular exertion. Blood oxygen is available to tissues throughout the body. However,
endogenous oxygen stores in the muscle are not available to other tissues because myoglobin has a much higher affinity (P50=2–3 mmHg; Rossi-Fanelli and Antonini, 1958; Gayeski
et al., 1987; Schenkman et al., 1997) for oxygen than hemoglobin (P50=27 mmHg; Qvist et al., 1981). To mobilize
the muscle’s endogenous oxygen supply and maximize ADL, the product of the muscle Q.O∑/V
.
O∑ratio and maximum EBO∑
should be less than 1 (i.e. below the level of critical oxygen delivery) at the beginning of a dive (Fig. 6). As the dive progresses, muscle metabolism relies increasingly on its endogenous oxymyoglobin stores and less on convective oxygen transport as CaO∑ and the Q
.
O∑/V
.
O∑ ratio decrease
(Fig. 7). Nevertheless, endogenous oxygen stores alone are
0 0 1 2 0 0.4 0.8 1.2 0 0.4 0.8 1.2 0 0.4 0.8 1.2 0 0.4 0.8 1.2 0 0.4 0.8 1.2 0 0.4 0.8 1.2 0 0.4 0.8 1.2 0 0.4 0.8 1.2 0 0.4 0.8 1.2 0 0.4 0.8 1.2 0 0.4 0.8 1.2 0 0.4 0.8 1.2 0 0.4 0.8 1.2 0 0.4 0.8 1.2 0 0.4 0.8 1.2
Dive time (min)
O
M
K
A
C
E
G
I
B
D
F
H
J
L
N
P
1× resting VMO219% resting Vb .
.
5 10 15 20 25
0 5 10 15 20
3× resting VMO2
19% resting Vb .
.
5× resting VMO2
37% resting Vb .
.
0 5 10 15
7× resting VMO2
56% resting Vb .
.
0 2 4 6 8 10 12
0 2 4 6 8 10 12
9× resting VMO2
75% resting Vb .
.
0 2 4 6 8
11× resting VMO2
94% resting Vb .
.
13× resting VMO2
94% resting Vb .
.
0 2 4 6 8
0 1 2 3 4 5 6
15× resting VMO2
94% resting Vb . . Muscle QO 2 /V O2 . . 0
2× resting VMO2
19% resting Vb .
.
5 10 15 20
0
19% resting Vb .
.
5 10 15 20
6× resting VMO2
37% resting Vb .
.
0 5 10 15
8× resting VMO2
56% resting Vb .
.
0 2 4 6 8 10 12
0 2 4 6 8 10
10× resting VMO2
75% resting Vb .
.
0 2 4 6 8
12× resting VMO2
94% resting Vb .
.
0 2 4 6 7
14× resting VMO2
94% resting Vb .
.
1 3 5
0 1 2 3 4 5 6
16× resting VMO2
94% resting Vb .
[image:11.609.205.565.248.730.2]. 4× resting VMO2
Fig. 7. Optimum muscle Q.O∑/V
.
O∑ratios
as a function of dive time for skeletal muscle oxygen consumption rates (V.MO∑) ranging from 1 to 16 times the
resting value. The abscissa of each plot is scaled to its respective aerobic dive limit (ADL) to give maximum resolution. Q.O∑, convective oxygen
transfer rate in the blood; V.O∑, rate of
insufficient to support V.MO∑and, at the same time, maximize
the ADL. Even towards the end of a dive, the muscle continues to receive over 24 % of its oxygen from the blood while simultaneously desaturating oxymyoglobin throughout the dive. This implies a subtle degree of control over V.b and muscle perfusion that is geared to the level of exercise. At higher levels of V.MO∑, V.b and muscle perfusion must increase
to maintain an appropriate Q.O∑/V.O∑ratio so that available blood
and muscle stores are depleted at the same time.
Previous researchers have commented on the metabolic conflict created by the reduction in convective oxygen transport to active muscle during submerged swimming (Castellini et al., 1985; Hochachka, 1986, 1992; Fedak et al., 1988; Williams et al., 1991). Inevitably, any constraints on Q.O∑ will limit
maximum V.O∑ (V.O∑max). Assuming that some degree of dive
response is obligatory (Kooyman, 1989; Hill et al., 1987; Fedak
et al., 1988; Ponganis et al., 1997a; Butler and Jones, 1997), this conflict becomes apparent at a V.MO∑greater than 12 times the
resting level and a maximum V.b of 94 % (Fig. 4). At this level of exertion, the model predicts an optimum fHand V.b that are
greater than resting levels, an indication of the emerging metabolic conflict between the dive response and muscle oxygen requirements. This conflict is manifest as a small but growing inefficiency in the use of blood oxygen stores (i.e. increasing end-of-dive SaO∑and Sv–O∑) which is detectable at a V.MO∑of 14
times the resting value and a V.O∑ of 8.2 ml O2min−1kg−1
(Fig. 13B,C). However, this is near the measured maximum V.O∑
of 9 ml O2min−1kg−1(Castellini et al., 1992) for freely diving
Weddell seals. As a result, Weddell seals may avoid (or be limited by) the conflict between the dive response and convective oxygen transport to active muscle by swimming at modest levels (i.e. V.O∑⭐9 ml O2min−1kg−1) of exertion during 0
0 50 100
0 50 100
0 50 100
0 50 100
0 50 100
0 50 100
0 50 100
0 50 100
0 50 100
0 50 100
0 50 100
0 50 100
0 50 100
0 50 100
0 50 100
0 50 100
Dive time (min)
A
B
C
D
E
F
G
H
I
J
K
L
M
N
O
1× resting VMO2.
25 20 15 10 5
3× resting VMO2
.
0 5 10 15 20
5× resting VMO2
.
0 5 10 15
7× resting VMO2
.
0 2 4 6 8 10 12
9× resting VMO2
.
0 2 4 6 8 10 12
11× resting VMO2
.
0 2 4 6 8
13× resting VMO2
.
0 2 4 6 8
15× resting VMO2
.
0 1 2 3 4 5 6
%
V
MO
2
from blood and myoglobin O
2
.
0 5 10 15 20
2× resting VMO2
.
0 5 10 15 20
4× resting VMO2
.
0 5 10 15
6× resting VMO2
.
0 2 4 6
8× resting VMO2
.
8 10 12
10× resting VMO2
.
0 2 4 6 8 10
12× resting VMO2
.
0 2 4 6 8
14× resting VMO2
.
0 1 2 3 4 5 6 7
P
16× resting VMO2
.
[image:12.609.204.560.68.530.2]0 1 2 3 4 5 6
Fig. 8. Percentage of the skeletal muscle oxygen consumption rate (V.MO∑) supported by oxygen from the
diving. Under these conditions, blood and muscle oxygen stores can be used optimally during the progressive hypoxic hypoxia with ischemia that occurs during breath-hold diving by matching
V.b to the level of V.MO∑. These cardiovascular adjustments enable
the diving animal to balance the conflicting metabolic demands of (1) optimizing the distribution and use of blood and muscle oxygen stores by all organs and tissues to maximize the ADL and (2) ensuring that active muscle receives adequate oxygen as
V.MO∑increases during submerged swimming.
Consequences of not optimizing V.b
Using the least-optimum V.b (i.e. the V.b that gives the minimum ADL for a given and V.O∑; Fig. 3) over the range
19–94 % reduces blood and muscle oxygen desaturation (Fig. 13). This reduction in desaturation decreases the percentage of total body oxygen stores that are used during aerobic dives and, therefore, decreases the ADL for a given V.O∑.
However, the under-utilization of blood and muscle oxygen stores is not the same for all levels of V.MO∑. For V.MO∑values of
1–6 times resting, the least-optimum V.b (i.e. 94 %) results in an over-perfusion of the muscle, a Q.O∑/V
.
O∑ratio greater than 0.88
(range 2.0–11.5) and a negligible rate of muscle oxymyoglobin desaturation (range 0–0.2 % min−1). For V.MO∑values of 7–16
times resting, the least-optimum V.b (i.e. 19 %) results in an under-perfusion of the muscle, a very low Q.O∑/V
.
O∑ratio (range
0.2–0.3) and a very rapid desaturation of muscle oxymyoglobin (range 10.1–26.8 % min−1). In the former case, the blood is
desaturated and the ADL is reached, triggered by the oxygen
requirements of the splanchnic organs, kidneys and peripheral tissues other than muscle, while muscle oxymyoglobin is still saturated. In the latter case, the muscle is rapidly depleted of oxygen and becomes anaerobic while there are still high levels of oxygen saturation in the arterial (86–100 %) and venous (51–64 %) blood. In either case, the mismatch between muscle
Q.O∑and V
.
O∑results in very low or high rates, respectively, of
oxymyoglobin desaturation that are outside the normal range of values observed for Weddell seals during aerobic dives (Guyton et al., 1995). In addition, the mismatch results in an end-of-dive
SaO∑for V
.
MO∑of 7–16 times resting that is unusually high (i.e.
86–100 %) for aerobic dives (Qvist et al., 1986). With the least-optimum V.b, an average of 45 % (range 37–49 %) of total body oxygen stores is used before the ADL is reached (Fig. 13A). In contrast, an average of 69 % (range 54–76 %) of total body oxygen stores is used with an optimum V.b, and this increases the average ADL by a factor of 1.5. We hypothesize that Weddell seals are adapted to make the most efficient use of oxygen stores for a given level of diving V.O∑. This means that
cardiovascular adjustments are established at the beginning of a dive to maximize the ADL, even if the dive is terminated for behavioral reasons before body oxygen stores are fully used.
Model predictions during aerobic dives with different levels of V.O∑
Many aerobic dive limits
The model shows that there is not one but a suite of ADLs, the durations of which depend on the level of muscular
0 0.2 0.4 0.6 0.8 1.0
0 0.2 0.4 0.6 0.8 1.0
0 0.2 0.4 0.6 0.8 1.0
Brain Heart
Splanchnic/kidneys/other
Dive time (min) 0
0.2 0.4 0.6 0.8 1.0
Skeletal muscle
A
0 5 10 15 20 25
C
0 5 10 15 20 25
All other muscle VMO2 and Vb values
. .
1× resting VMO2
and 19% resting Vb.
.
E
BO
2
B
0 5 10 15 20 25
D
0 5 10 15 20 25
1–4× resting VMO2
and 19% resting Vb.
[image:13.609.237.564.74.385.2]. Fig. 9. Extraction coefficient of oxygen from
the blood (EBO∑) as a function of dive time for
organs and tissues supplied by the four regional circulations indicated in Fig. 1. EBO∑
for the 16 levels of skeletal muscle oxygen consumption rate (V.MO∑) are plotted for each
circulation, but in many cases the lines overlap. Each plot of EBO∑ ends at its
respective aerobic dive limit (ADL). The objective of this graph is not to show the individual lines, but to show the trend and the range of maximum EBO∑ for each circulation.
For skeletal muscle, the EBO∑for V.MO∑ranging
from 2 to 16 times the resting value were maximized at 0.8 throughout aerobic dives and were not individually discernible. For resting V.MO∑, EBO∑for skeletal muscle started at 0.44
and increased to 0.8 towards the end of the dive. The average maximum value of EBO∑for