1
By Eva-Maria Möller
s0167312
Mentors: Stans C.H.C. Drossaert, PhD and Richard M.H. Evering, MSc
-Roessingh Research and Development-
Measuring the Bio-Feedback of Patients
During Their Physical Activity
Investigating the Difference between Objective and Subjective Activity Level
UNIVERSITY OF TWENTE.
Page | 2 Abstract
Existing research about patients with chronic fatigue syndrome (CFS) suggests that physical
activity plays an important role in the progress and maintenance of the disease. The aim of the
present study was to further investigate the influence of objective physical activity on CFS
patients. To gain better insights into the factors influencing physical activity patients have been
examined according to the accuracy of their estimates about their physical activity and their
fatigue level. During the experiment 23 participants were provided with an ambulant feedback system. This feedback was either based on the average behavior of healthy people or on one’s own average physical activity. The patient’s objective activity level was measured by a tri-axial
piezoelectric accelerometer. Their subjective activity and fatigue level were measured by
self-reported scores. In the course of the experiment an increased positive correlation between
objective- and subjective activity level was found. During the first week, the baseline level
(without feedback) was measured, which revealed significantly a moderate negative correlation
between objective activity level and fatigue. No significant differences have been found between
the two feedback comparison groups. Consequently, CFS patients do accurately estimate their
physical activity. The two feedback groups had no different influence on the patients regarding
subjective and objective activity and fatigue. Overall, participants felt more tired as their
Page | 3 Introduction:
What is chronic fatigue syndrome? - A Definition
It is to say that no general definition of Chronic Fatigue Syndrome (CFS) exists.
Although there is a lack of standardized reproducible diagnostic criteria for CFS, some criteria
can be found in most definitions. Besides, the fact that CFS is “clinically evaluated, unexplained,
persistent or relapsing chronic fatigue” (Fukuda, Straus, Hickie, Sharpe, Dobbins, & Komaroff,
1994), most researchers agree that CFS means that people experience a reduction in daily
activity over at least six month (Heyll, Wachauf, & Diewitz, 1997; Reeves, Wagner, Nisenbaum,
& Jones, 2005; Fukuda, Straus, Hickie, Sharpe, Dobbins, & Komaroff, 1994). CFS is not only
confined to fatigue. Syndromes like impaired memory or concentration, headaches, joint pain
and unusual post exertional fatigue are associated with CFS as well (Holmes, et al., 1988;
Fukuda, Straus, Hickie, Sharpe, Dobbins, & Komaroff, 1994). The definition capturing all of the
above mentioned factors will be used throughout this article: „CFS is defined as persistent or
relapsing fatigue of at least 6-months' duration, that is not alleviated by rest, and that causes
substantial reduction in activities. The fatigue cannot be explained by medical or psychiatric
conditions and must be accompanied by at least 4 of 8 case defining symptoms (unusual post
exertional fatigue, impaired memory or concentration, unrefreshing sleep, headaches, muscle pain, joint pain, sore throat and tender cervical nodes)“ (Fukuda, Straus, Hickie, Sharpe,
Dobbins, & Komaroff, 1994).
General background information
The prevalence numbers concerning the people affected by chronic fatigue syndrome
have been found between the range of 7 to 267 cases per 100,000 persons in one study
(Komaroff, et al., 1996) and 4 to 2.600 cases per 100.000 persons in another study (Jason, et al.,
1997). Possible explanations of the wide diversity between different studies might be the use of
different definitions within the studies and the large different in sample sizes. In general, the
prevalence of CFS is substantially higher among women than men (Jason, et al., 1999; Lindal,
Stefansson, & Bergmann, 2002, Buchwald, Pearlman, Kith, & Schmaling, 1994). Bailey (2010)
Page | 4
shown that individuals between the age of 40 and 50 seem to exhibit the highest rates of CFS
(Jason, et al., 1999; Bailey, 2010). However, as epidemiological studies are lacking, it is not
possible to make any comparisons within this age group (Garrakla & Rangel, 2001; Marshall,
1999). Whereas comparing the socioeconomic status has revealed that the SES of people affected “the prevalence of CFS was highest among skilled workers and lowest among professionals“
(Jason, et al., 1999).
Key symptoms of CFS: physical movement and fatigue
Among CFS patients, a difference can be made between those who are rated according to
their activity level and compared with healthy people and those rated according to a difference in their experienced fatigue. The patients’ fatigue level is higher in comparison to healthy people.
They are burdened with severe disabling fatigue. People suffering from CFS often have to quit
their jobs as their tiredness makes it unable for them to work. Therefore, CFS can have a large impact on the patients’ lives. Sometimes, physical movement of the patients, is disordered,
which leads to a deterioration of health status. Black, O’Connor and McCully (2005) found a
reduction of movement up to 40% by CFS patients compared with healthy people. To explain the
influence of physical movement, Wessley and colleagues developed a model which explains the impact of the patients’ illness related false beliefs on about their health status. The patients are in,
what Wessley et al. (1999) called the “negative vicious circle”. The circle starts with an acute
illness, often paired with inactivity resulting in a decreased fitness level. When CFS patients start
to increase their physical movement again, they often experience an aggravation of the
syndromes such as “myalgia, headache, sore throat, gastrointestinal complaints, and memory and concentration problems” (Wessely, Nimnuan, & Sharpe, 1999). Consequently patients reduce
their physical activity again, which leads the symptoms not only to occur at a higher level but
also at a lower level of physical activity (Vercoulen, et al., 1997). However, low activity levels
can lead to an increased risk for several diseases, for example cardiovascular disease (Thompson,
et al., 2003) and Type II diabetes (Hu, et al., 1999). Therefore, the patients have difficulties when
they try to break out the circle through fulfilling both aims: preventing the symptoms and
Page | 5
Since physical activity and fatigue are the key factors within CFS, researchers examine
the relation between these variables in order to get new insights about the disease. On the one
hand, researchers found comparable or even higher physical activity by CFS patients compared
with healthy controls (Vanness, Snell, Strayer, Dempsey, & Stevens, 2003; Werf, J.B. Prins,
Meer, & Bleijenberg, 2000). However, other researchers found that the negative influence of
CFS in patients can be reduced by increasing daily activity (Black, O´Connor, & McCully, 2005;
Fulcher, 1997; Wearden, et al., 1998; Powell, Bentall, Nye, & Edwards, 2004). They found that
fatigue is linked with a low physical activity (Clearing-Sky, 1988; Dubbert, 1992), which means
that people are feeling more tired when they are moving just a little. On the basis of these
findings Fulcher (1997) conducted further research and discovered that “total and physical fatigue […] and general health were significantly better after exercise than after flexibility
treatment” (Fulcher, 1997). An overview can be found in Appendix 1. Since the relation between
physical activity level and fatigue is still in its infancy further research is necessary. The
question, leading this research is: Are physical activity and fatigue connected with each other
and, if a connection will be found, how does it look like?
The role of self-assessment
To examine the relation between factors crucial for a better understanding of CFS one has to include the patient’s self-assessment, which will form the basis for an effective treatment. The
first steps in helping patients to feel better, is to change their activity pattern. It is widely known,
that a treatment is needed where patients get the opportunity to experience their mistakes.
Therefore, the role of self-assessment is crucial.
The self-assessment of physical activity level is a subjective variable, which differs for
each individual as the interpretations are personal (Weering, Vollenbroek-Hutten, & Kotte,
2007). Thus, it can be seen as a person’s estimation of his or her objective physical activity.
Weering, Vollenbroek-Hutten and Kotte (2007) found that the self-assessment of physical
activity of CFS patients was lower than the actual physical activity. Being more precisely ”subjective outcome assessments resulted more often (92%) in statistical significant lower
Page | 6
2011). This implies that most of the time CFS patients underestimate their physical activity. A
wrong self-assessment of physical activity means implicates that CFS patients are unable to
make realistic estimations of their physical activity. Furthermore, studies have shown that a
negative self-assessment of one’s physical activity, can lead to a malfunctioning physical activity
pattern (Evering, Weering, Groothuis-Oudshoom, & Vollenbroek-Hutten, 2011; Fry & Martin,
1996). So it is important to examine to what extent the patients’ self-assessment of physical
activity matches their objective physical activity.
As pointed out before, self-assessment is a crucial factor concerning physical activity,
which is important for the CFS patients, since one of the symptoms is a disturbed physical
activity. As mentioned before, another crucial factor is fatigue. To get a better overall picture
and an effective treatment, the relation between fatigue and self-assessment should also be taken
into account. Researchers found that “those patients in the exercise group who rated themselves as better had no significantly greater improvement in either peak oxygen consumption” (Silver,
Haeney, Vijayadurai, Wilks, Pattrick, & Main, 2001). Interpreting the results one comes to the
conclusion that the feeling of being more active is already enough to feel less fatigue. Actually
Silver et. al (2001) goes one step further by stating that the belief in an improved physical
activity, thus a high estimation of physical activity level, is even more important to feel better
than the objective activity level. To test this hypothesis it is important to do further researcher
regarding the relationship between self-assessment of physical activity and fatigue.
The role of feedback
As pointed out before, self-assessment seems to be an important factor for fatigue and
physical activity level. This means that when self-assessment of the physical activity level is
increased, CFS patients consequentially will feel themselves better. One way of improving people’s self-assessment is by giving feedback. With the help of an external advice, people can
learn to make the right estimations by creating associations between the feedback and their own
behavior. Today´s technology makes it possible to give people feedback in form of an ambulant
apparatus. Through this invention patients can receive feedback in their daily lives. In the context
of CFS it can be examined in how far this ambulant feedback has an influence on the crucial
Page | 7
activity or reduce fatigue? In how far can feedback influence the relation between
self-assessment and physical activity?
Giving feedback implies that a person’s behavior is compared to some other behavior.
However the question remains, which behavior should be used as a comparison? Two
alternatives are possible. First, the comparison can be based on the behaviors of others, since the
behavior of other people defines the average behavior; this type is called social comparison. Second, the comparison can be based on one’s own behavior. Here, the recent behavior forms the
basis of average to compare with the present behavior, which is called temporal comparison. Concerning the CFS patients it is interesting to examine if it makes a difference which
comparison style is used regarding regular ambulant feedback.
Scope of research and research questions
The literature research pointed out that self-assessment, objective physical activity and
fatigue plays an important role in CFS. Some studies show that people often underestimate their
own physical activity level. Since the connection between the two factors is quite unclear so far,
this study has the aim to gain additional insights into how CFS patient are aware of their own
physical activity level. Moreover fatigue, as the name of the syndrome implies, has a huge impact on the patients’ lives. The literature shows contrary results regarding the relationship
between fatigue and physical activity. Some researchers found a positive and some a negative
correlation between the two factors. This is why further research in this field is necessary.
Concerning self-assessment and fatigue little research has been done. Silver et. al (2001)
suggests that feeling more physical active is already enough to feel less fatigue. Further
researcher has to be done more precisely concerning the relation between the two factors. Since
the technology makes it possible to give ambulant regular feedback it is additionally interesting
to examine in how far this has an influence of the factors. As feedback can be very different it is
also interesting to examine in how far differences in the results can be detected while using
different comparison groups.
Page | 8 1. To what extent do patients make realistic estimations of their activity level?
2. What is the relation between activity level (subjective & objective) and fatigue level? 3. Does regular ambulant feedback help to
3.1. make more accurate estimation of one’s physical activity level? 3.2. increase objective physical activity?
3.3. reduce fatigue?
4. Regarding the above question what is the difference between temporal and social comparison feedback?
Methods
To find answers on the research questions an experimental study was conducted.
Participants
The participants were recruited from the Roessingh Rehabilitation Center in Enschede,
Netherlands, as well as by advertising in a local newspaper article handing out in the Eastern part
of the Netherlands. A total of 23 participants (18 female, 5 male) between 18 and 56 (mean age =
34) took part in the present study. Precondition for participating was the presence of chronic
fatigue syndrome diagnosed by a general practitioner or a physician according to the criteria for
CFS of the Centers of Disease Control and Prevention of 1994, defined in the introduction
(Fukuda, Straus, Hickie, Sharpe, Dobbins, & Komaroff, 1994). Other inclusion criteria were:
fatigue as the primary complaint, aged between 18 and 65 years, no structural pathology
explaining the fatigue complaints, not yet in treatment with clinical intake, not bounded to a
Page | 9 Study design and outcome measures
The experiment consisted of three different stages: the baseline measurement and two
feedback phases (Figure 1). During the intake all participants were instructed about the
measurement procedure.
Figure1 Overview of the research design
The baseline measurement took 7 days. Afterwards the participants got randomized into
two groups. One group got a norm-line based on a healthy control group (social comparison) and
the other one got a norm-line based on the mean of the individual baseline measurement and the
healthy control group (temporal comparison). The participants were told in which of the two
groups they belong so that the 2-week feedback phase could start.
In order to measure daily objectively physical activity, a tri-axial piezoelectric
accelerometer (XSens; The Netherlands) was used. Measuring accelerations in three different
axes of the trunk (anteroposterior, mediolateral and longitudinal), the objective activity level was
determined. Straining the acceleration with a 4th order Butterworth filter with cutoff frequencies
Exclusion Intake
Baseline Measurement
(7 days) T1
T2
ABF with SC (14 days)
ABF with TC (14 days)
Page | 10
of 0.11 and 20 Hz, the absolute value of acceleration was combined over 60 seconds and
afterwards summed over the three axes.
Subjective activity was measured by asking the participants to give an estimation of their
objective activity level. At 19.30 each day the patients rated their subjective activity level on the
PDA by ticking a visual analogue scale between 0 (not active) till 10 (maximal active).
Furthermore the participants were asked four times each day (at starting point of the
measurement, 12.00, 16.00 and 20.00) to rate their subjective fatigue score on the PDA from 0
(not fatigue) till 10 (maximal fatigue). This variable was added in the course of the study so that
only twelve of the 23 participants had the opportunity to report their daily fatigue score.
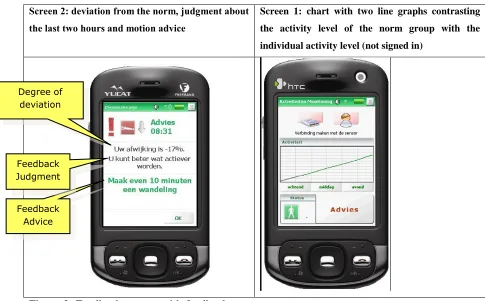
All data was transmitted through Bluetooth connection to a personal digital assistant
(PDA) (Figure 2) to store the measured values. During the measurement periods the participants
had to wear the PDA with a belt on the participants´ waist between 8.00 and 22.00, besides from
water activities.
Screen 2: deviation from the norm, judgment about the last two hours and motion advice
Screen 1: chart with two line graphs contrasting
the activity level of the norm group with the
[image:10.612.43.528.373.674.2]individual activity level (not signed in)
Figure 2: Feedback system with feedback Degree of
deviation
Page | 11 Data analysis
Objective activity level
The inclusion criteria for subjects in the data analysis were the availability of three
measurement days with at least 420 min per day. By using Mat lab an algorithm was written to
calculate the mean objective activity level per day. This calculation was used to calculate the
mean score of each participant, which then where used for the data analysis.
Subjective activity level
Subjective activity was measured by asking the participants to give an estimation of their
physical activity level. At 19.30 each day the patients estimate their physical activity on the PDA
by ticking a visual analogue scale between 0 (not active) till 10 (maximal active).
Fatigue Score
Four times each day (at starting point of the measurement, 12.00, 16.00 and 20.00)
subjects were asked to rate their subjective fatigue score on the PDA from 0 (not fatigued) till 10
(maximal fatigued). This variable was added in the course of the study so that only twelve of the
twenty-three participants had the opportunity to report their daily fatigue score.
Statistical analysis
The study design was a randomized prognostic cohort. The data were collected between
November 2008 and February 2011. The Statistical Package for the Social Science (SPSS18)
was used to conduct the analysis of the statistical data. The significance level of 0.05 was used
for all analyses.
To analyze if there was any scoring difference regarding to education and age of the
participants, two One-Way ANOVAs were adopted with education and age as factors and
objective, subjective and fatigue scores as dependent variables. To see if there is any relation
Page | 12
grouping variable and the three weekly mean scores of objective, - subjective activity level and
fatigue level as test scores.
Due to the fact that data of just half of the subjects fatigue scores were available, an
independent sample t-test was adopted to point out if there was a significant difference between
the two groups regarding age. Testing whether the groups significantly differentiate according to
education and gender a Pearson Chi-Square test was executed. To determine the relations
between objective- and subjective activity level and fatigue level a bivariate correlation with a
Pearson correlation coefficient was executed three times for each week. Therefore the mean
week scores of the three variables had been calculated, because there were too many missing
values to calculate the correlation for each day. To analyze if the difference between the mean
scores of each variable per week was significant a one-factor repeated measures analysis of
variance was adopted.
To investigate the differences between social- and temporal comparison group an
independent-samples t-test was used. The grouping factor was comparison group and the test
variables were three weekly mean scores of objective- and subjective activity level and fatigue
level.
Results
Demographic characteristics
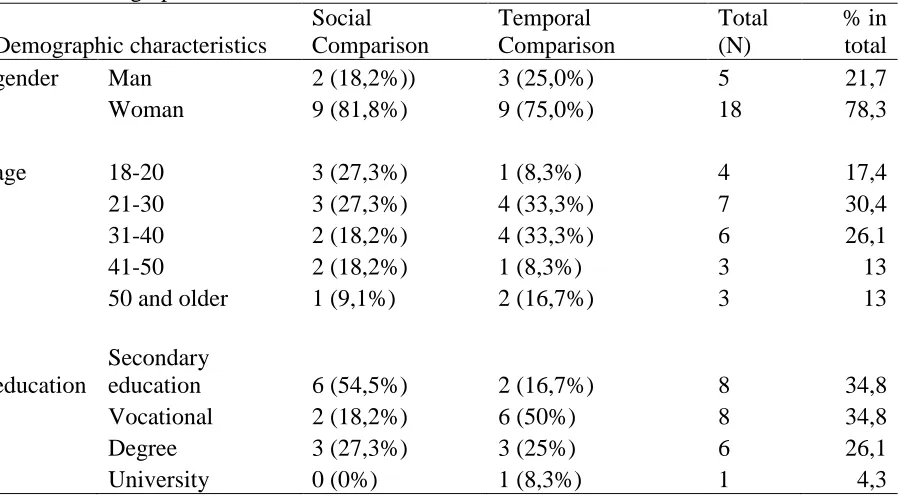
Table 1 gives a detailed overview of the background of the participants according to
gender, age and education, separated for social- and temporal comparison group. The groups do
not differ significantly from each other regarding gender, which means that distribution is nearly
the same in both groups. In total, most of the participants were women (78, 3%). The total mean
age was 34; the youngest participant was 18 years and the oldest 56 years. Comparing the mean
age, participants of the social comparison group are younger than patients of the temporal group,
respectively 32 to 36, which was not found to be significant. The highest degree patients had
followed secondary of vocational education (70%). Within the two comparison groups the
educational background show different patterns, but these differences were not significant. On
the one hand 6 patients in the social comparison group followed secondary education whereas 2
Page | 13
vocational education was followed by 6 patients of the temporal group and only 2 participants of
the social comparison group. Among all patients, one person had a university degree.
Conclusively, there is no significant difference between the two groups regarding gender, age
and educational background, respectively (p= .451; p= .989; p= .503). With regard to the fatigue
score no significant differences regarding the background characteristics have been found
between participants who had the possibility to report their daily fatigue score and those who had
[image:13.612.80.530.249.498.2]not.
Table 1 Demographic characteristics
Demographic characteristics
Social Comparison
Temporal Comparison
Total (N)
% in total
gender Man 2 (18,2%)) 3 (25,0%) 5 21,7
Woman 9 (81,8%) 9 (75,0%) 18 78,3
age 18-20 3 (27,3%) 1 (8,3%) 4 17,4
21-30 3 (27,3%) 4 (33,3%) 7 30,4
31-40 2 (18,2%) 4 (33,3%) 6 26,1
41-50 2 (18,2%) 1 (8,3%) 3 13
50 and older 1 (9,1%) 2 (16,7%) 3 13
education
Secondary
education 6 (54,5%) 2 (16,7%) 8 34,8 Vocational 2 (18,2%) 6 (50%) 8 34,8
Degree 3 (27,3%) 3 (25%) 6 26,1
University 0 (0%) 1 (8,3%) 1 4,3
Baseline
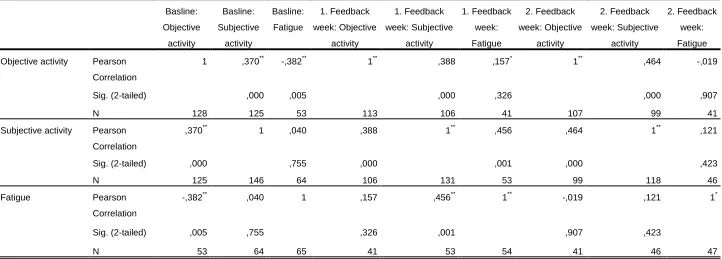
A moderate positive correlation was found between objective- and subjective activity
level (table 2). This means that one variable has a positive relation to the other. So it is to say that
either the patients realistically estimate their activity level, or the people estimation of physical
activity influenced their physical movement. The correlation between objective activity level and
the subjective fatigue level was found moderate negative significant. This means in baseline of the
Page | 14
more tired, physical activity decreases. Correlating subjective activity level and fatigue, no
significant correlation was found.
Feedback weeks
In feedback week 1 and 2 a significant moderate positive correlation was found between
objective- and subjective activity level (table 4). Compared with the results of the baseline week
it is to say that the correlation between the two variables constantly grew. This means that either
the patients’ estimation of their physical activity was getting more accurate in the course of the
experiment or their physical activity was adapted to their estimation of their physical activity.
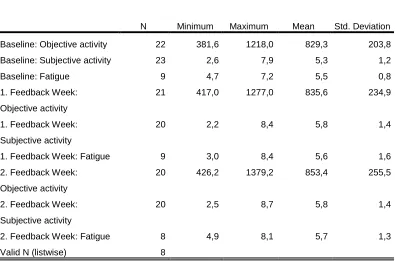
During the experiment the mean objective activity level increased constantly (table 2; appendix
graph 3), but the increase was found not significant (p =.480). Comparing the baseline and the
first feedback week, the mean subjective activity level increased and during the two feedback
weeks it was the same (table 2, appendix graph 1). This difference was not found significant (p
=.073). The mean fatigue level increased during the course of the experiment, also this
Page | 15
Table 2 Average score of objective- & subjective activity and fatigue during the three experimental weeks
N Minimum Maximum Mean
Std. Deviation
Baseline: Objective activity 22 381,6 1218,0 829,3 203,8
Baseline: Subjective activity 23 2,6 7,9 5,3 1,2
Baseline: Fatigue 9 4,7 7,2 5,5 0,8
1. Feedback Week:
Objective activity
21 417,0 1277,0 835,6 234,9
1. Feedback Week:
Subjective activity
20 2,2 8,4 5,8 1,4
1. Feedback Week: Fatigue 9 3,0 8,4 5,6 1,6
2. Feedback Week:
Objective activity
20 426,2 1379,2 853,4 255,5
2. Feedback Week:
Subjective activity
20 2,5 8,7 5,8 1,4
2. Feedback Week: Fatigue 8 4,9 8,1 5,7 1,3
Valid N (listwise) 8
Differences between social and temporal comparison group
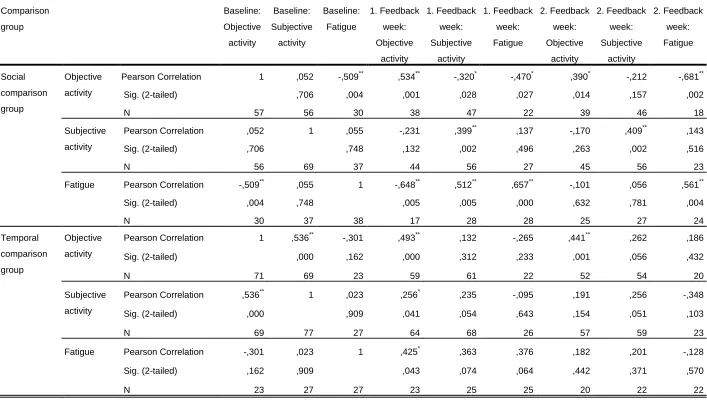
During baseline week very low, not significant correlation between objective and
subjective activity in the social comparison group was found (table 5). In the first feedback week
the correlation between the two variables was found to be significant moderate negative. The
results of the second feedback week regarding the social comparison group showed also a
negative correlation but lower compared to the first feedback week and not significant. During
the two feedback weeks in the temporal comparison group the low and not significant correlation
of the first week became higher but still was at a low level and also not significant. In contrary to
these result during the baseline a strong positive correlation was found in the temporal
comparison group. Unless not all correlations are significant, comparing the two groups it is to
say that in the social comparison group the negative correlation was getting lower during the
feedback weeks and in the temporal group the positive correlation got stronger. Unless no
Page | 16
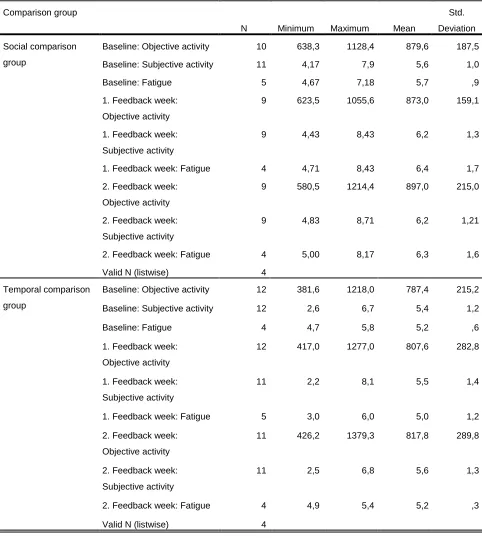
=.470) it can be stated that in the social comparison group the activity level decreased during the
baseline and first feedback week and then increased again in the second feedback week (table 3).
During the three weeks in the temporal comparison group a constantly decrease of activity level
was found. Comparing the two groups a higher weekly mean score of the activity level was
found in the social comparison group. Since in the baseline all patients got the same treatment it
has to be pointed out that in the experimental phase, the activity level of the social comparison
group first decreased compared with the baseline score and in the temporal comparison group the
objective activity increased. The score of the temporal group steadily grew but did not reach the
lowest physical activity score of the social comparison group. Thus on average during the whole
experiment patients of the social comparison group had a higher physical activity level than
patients of the temporal comparison group. Unless the differences regarding subjective activity
were not significant within the two groups (p =.073), a constantly increase of subjective activity
was found in both groups with a higher weekly mean score in the social comparison group
regarding all three weeks. Comparing the differences between baseline and feedback weeks it is
shown that the estimation of the patients’ objective activity grows in both group but with a
higher increase in the social comparison group. Referring to the fatigue score also no significant
difference within the group was found (p =.233). While in the social comparison group patients
feel more tired in the first feedback week compared to the baseline, the opposite has been found
in the temporal comparison group. Comparing the two feedback weeks the fatigue level of
patient in the social comparison group decreased, whereas the weekly mean score of the
temporal comparison increased. Regarding the whole experiment the correlation in the social
comparison group between objective activity and fatigue was moderate negative significant, with
a higher negative correlation in the baseline than in the first feedback week and a higher, almost
strong correlation in the second feedback week. In the temporal comparison group the moderate
negative correlation of the baseline week between objective activity and fatigue got weaker in
the first feedback week and in the second week the correlation was low positive. These
correlations are not significant. During the three experimental weeks the correlation between
subjective activity and fatigue increased in the social comparison group, but the correlations
were low and not significant. In the temporal comparison group there was almost no correlation
Page | 17
low negatively and moderate negative in the second feedback week. None of the correlation was
[image:17.612.72.554.187.725.2]significant.
Table 3 Average score of objective- & subjective activity and fatigue during the three experimental weeks split in comparison group
Comparison group
N Minimum Maximum Mean
Std.
Deviation
Social comparison
group
Baseline: Objective activity 10 638,3 1128,4 879,6 187,5
Baseline: Subjective activity 11 4,17 7,9 5,6 1,0
Baseline: Fatigue 5 4,67 7,18 5,7 ,9
1. Feedback week:
Objective activity
9 623,5 1055,6 873,0 159,1
1. Feedback week:
Subjective activity
9 4,43 8,43 6,2 1,3
1. Feedback week: Fatigue 4 4,71 8,43 6,4 1,7
2. Feedback week:
Objective activity
9 580,5 1214,4 897,0 215,0
2. Feedback week:
Subjective activity
9 4,83 8,71 6,2 1,21
2. Feedback week: Fatigue 4 5,00 8,17 6,3 1,6
Valid N (listwise) 4
Temporal comparison
group
Baseline: Objective activity 12 381,6 1218,0 787,4 215,2
Baseline: Subjective activity 12 2,6 6,7 5,4 1,2
Baseline: Fatigue 4 4,7 5,8 5,2 ,6
1. Feedback week:
Objective activity
12 417,0 1277,0 807,6 282,8
1. Feedback week:
Subjective activity
11 2,2 8,1 5,5 1,4
1. Feedback week: Fatigue 5 3,0 6,0 5,0 1,2
2. Feedback week:
Objective activity
11 426,2 1379,3 817,8 289,8
2. Feedback week:
Subjective activity
11 2,5 6,8 5,6 1,3
2. Feedback week: Fatigue 4 4,9 5,4 5,2 ,3
Page | 18
Table 4 Correlation of objective- & subjective activity and fatigue during the three experimental weeks
Basline: Objective activity Basline: Subjective activity Basline: Fatigue 1. Feedback week: Objective activity 1. Feedback week: Subjective activity 1. Feedback week: Fatigue 2. Feedback week: Objective activity 2. Feedback week: Subjective activity 2. Feedback week: Fatigue
Objective activity Pearson
Correlation
1 ,370** -,382** 1** ,388 ,157* 1** ,464 -,019
Sig. (2-tailed) ,000 ,005 ,000 ,326 ,000 ,907
N 128 125 53 113 106 41 107 99 41
Subjective activity Pearson
Correlation
,370** 1 ,040 ,388 1** ,456 ,464 1** ,121
Sig. (2-tailed) ,000 ,755 ,000 ,001 ,000 ,423
N 125 146 64 106 131 53 99 118 46
Fatigue Pearson
Correlation
-,382** ,040 1 ,157 ,456** 1** -,019 ,121 1*
Sig. (2-tailed) ,005 ,755 ,326 ,001 ,907 ,423
N 53 64 65 41 53 54 41 46 47
**. Correlation is significant at the 0.01 level (2-tailed).
Page | 19
Table 5 Correlation of objective- & subjective activity and fatigue during the three experimental weeks split in comparison group
Comparison group Baseline: Objective activity Baseline: Subjective activity Baseline: Fatigue 1. Feedback week: Objective activity 1. Feedback week: Subjective activity 1. Feedback week: Fatigue 2. Feedback week: Objective activity 2. Feedback week: Subjective activity 2. Feedback week: Fatigue Social comparison group Objective activity
Pearson Correlation 1 ,052 -,509** ,534** -,320* -,470* ,390* -,212 -,681**
Sig. (2-tailed) ,706 ,004 ,001 ,028 ,027 ,014 ,157 ,002
N 57 56 30 38 47 22 39 46 18
Subjective
activity
Pearson Correlation ,052 1 ,055 -,231 ,399** ,137 -,170 ,409** ,143
Sig. (2-tailed) ,706 ,748 ,132 ,002 ,496 ,263 ,002 ,516
N 56 69 37 44 56 27 45 56 23
Fatigue Pearson Correlation -,509** ,055 1 -,648** ,512** ,657** -,101 ,056 ,561**
Sig. (2-tailed) ,004 ,748 ,005 ,005 ,000 ,632 ,781 ,004
N 30 37 38 17 28 28 25 27 24
Temporal
comparison
group
Objective
activity
Pearson Correlation 1 ,536** -,301 ,493** ,132 -,265 ,441** ,262 ,186
Sig. (2-tailed) ,000 ,162 ,000 ,312 ,233 ,001 ,056 ,432
N 71 69 23 59 61 22 52 54 20
Subjective
activity
Pearson Correlation ,536** 1 ,023 ,256* ,235 -,095 ,191 ,256 -,348
Sig. (2-tailed) ,000 ,909 ,041 ,054 ,643 ,154 ,051 ,103
N 69 77 27 64 68 26 57 59 23
Fatigue Pearson Correlation -,301 ,023 1 ,425* ,363 ,376 ,182 ,201 -,128
Sig. (2-tailed) ,162 ,909 ,043 ,074 ,064 ,442 ,371 ,570
N 23 27 27 23 25 25 20 22 22
**. Correlation is significant at the 0.01 level (2-tailed).
Page | 20 Discussion
The problem of patients with CFS is that they move less and therefore hazard that their
health status is getting worse. That is the reason why researchers are interested in finding a possibility to increase patients’ physical activity. Therefore it is necessary to get further insights
into the physical activity pattern of CFS patients. Moreover a change of the situation implies that
the people are aware of their physical activity level thus therefore this study also measured the patients’ estimation of their physical activity. An important factor of the diseases is the perceived
fatigue of the patients so that this study investigated the relation between fatigues regarding the
physical activity and its estimation of it. After analyzing the patients daily life pattern regarding
the three factors, this study went a step further by examine in how far feedback can influence the
patients. The question was if the physical activity, the estimation of it and the fatigue level can
be influenced by giving the patients ambulant regular feedback regarding their physical activity.
According to the feedback two different conditions had been developed. One half of the patients
got feedback according to a norm based on the mean physical activity level of healthy control
subjects while the others got feedback according to a norm based on the same healthy control group including an adaption to someone’s own physical activity level at baseline. The question is
in how far the two different two different norm lines can influence the behavior of the patients.
Does the feedback help more to increase physical activity when the mean norm is determined
adapt to one’s own physical activity level or is it more helpfully to get the activity advice
determined on a norm only based on healthy control subjects?
Implications for results
According to the analyzed data there is a moderate positive significant correlation between
subjective and objective activity. This means that if one value increased, the other one increased
as well. Since the two variables have different measurement units in this study no statistically
analysis according to the causation could be executed, but other researcher found that “subjective outcome assessments result more often in significant lower physical activity levels“ (Evering,
Weering, Groothuis-Oudshoom, & Vollenbroek-Hutten, 2011). These findings imply that
physical activity is influenced by subjective physical activity. For that reason the research
question better should be to what extent the estimation of one’s activity level influences the
Page | 21
physical activity also is high and vice versa. This implies that CFS patients realistically estimate
their physical activity. Nevertheless, the founding correlation was moderate which means that the
participants were not able to estimate their physical movement completely right, but the tendency
of rating their physical activity level and the actual level went into the same direction. Since the
two variables are measured in different units, it cannot be calculated if the participants under-or
overestimate their physical activity level. To factor the feedback week into the results an increase
of correlation between objective and subjective activity can be seen. Conclusively it can be
stated that feedback had a positive influence on the correlation of the two variables. Studies show
that CFS patients often underestimate their physical activity level (Weering, Vollenbroek-Hutten,
& Kotte, 2007). In relating to the study results one can hypothesize that he ambulant feedback
advice may make the people more alert to their physical activity and therefore rate their physical
activity more accurate. Regarding the two comparison groups no significant differences have
been detected and also no tendency could be determined.
Statistical analysis shows that there was found a significant negative correlation
between objective activity level and fatigue in the baseline week. It has to point out that this
correlation was moderate thus the relation been found is not such strong. In various studies of
Vercoulen et al. a relation between high fatigue level and low physical activity level was found.
In the most recent study researchers even goes a step further and stated that physical activity and
fatigue correlated negatively. In the study of Black et. al (2005) there was also found that “overall mood, muscle pain intensity and time spent each day with fatigue worsened following
increased activity in the CFS participants” (Black, O´Connor, & McCully, 2005) Other
researchers like Fulcher et. al and Manley, observed exactly the opposite, that increasing
physical activity results in lower fatigue. Anyway, researchers agree upon the fact that the
objective activity level influences the fatigue level and not the other way around. With regards to the present study this would mean that during the baseline when patient’s physical activity level
increased they felt less tired.
No significant correlation has been found between subjective activity level and fatigue. With regards to the present study this means that the estimation of one’s activity level has no
influence on the fatigue level. Contrary to the findings of Silver et. al this means that the
Page | 22
Although no significant difference between the weekly mean scores of objective activity
has been found a constantly increase of the activity was detected. During the feedback weeks
CFS patients’ physical activity was higher than in the baseline. An explanation that no
significance could be stated during the baseline and the feedback weeks could be that
participating in a study already has motivated the patients to be more physical active. Therefore
the difference between baseline and feedback weeks would be reduced. Based on the results it
can be stated that patients of the social comparison group had a higher physical activity than
patients of the temporal comparison group. This difference was also detected in the baseline,
even though the participants were randomly divided into two groups. This implies that the
founding difference in the two feedback weeks already existed in the baseline, which means that
no interpretations based on study influences can be made.
Concerning fatigue no significant change has been found. The total fatigue level was
almost the same during the whole week. This means that the feedback did not have any effect on
the perceived tiredness of the patients. According to the literature research fatigue can be linked
with objective activity level. Since the objective activity did not significantly differ during the
experiment a logical conclusion is that also the fatigue level did not change. Therefore it would
be interesting to know if the fatigue level will change during feedback weeks when the objective
activity also increased.
Comparing the scores of the social and temporal comparison group no significant
difference between the weekly mean scores has been found, but one can say that patients of the
social comparison group by trend are more tired than the patients of the temporal comparison
group. The patients of the social comparison group had a norm line based on the physical activity
pattern of health people. This implies that on average the participants had to move more than
members of the other condition and therefore had a higher fatigue level. Another explanation
could be the different objective activity level of the two groups. In the social comparison group
patients had a higher physical activity. As seen in results of the baseline a positive correlation
between the two variables has been found. Therefore it can be argued that participants of the
social comparison group are more tired because on average their activity level is higher
compared with the temporal comparison group.
Comparing the correlations of subjective and objective activity level it is to say in the
Page | 23
the correlations were positive. For the social comparison group this means when objective
activity increase patients estimation of the activity level decreased. For patients of the temporal
comparison group this means that when the physical activity grew, the estimation of one’s
activity also grew. Thus people of the temporal comparison group can quiet accurately rate their
physical activity whereas people of the social comparison group do not. However, not all
correlations has been found significant which makes it difficult to interpret the results. Based on
the fact that the results show a specific trend it can be hypothesized that participants of the
temporal group can estimate their physical behavior. One can explain this difference with regards
to the foundations of the feedback. The advices of patients of the temporal group were based on
their own physical activity. Therefore their physical activity differ less from the norm line
compared with the social comparison group. Deviating from the norm line means that patients
got movement advices. Consequently people of the social comparison group were likely to get
more advices.
Since the correlations of between objective activity level and fatigue not significant at all,
no statements about the relation regarding the two groups can be made.
Regarding the correlation between objective activity and fatigue a increased negative
relation has been found in the social comparison group but no significant correlations or trends in
the temporal group. Therefore the two groups cannot be compared.
In the two group no significant correlation has been found between subjective activity level and
fatigue. However, the correlations of the social comparison groups were positive whereas in the
temporal comparison group negative correlations had been found. This trends show that
participants of the temporal group feel less tired when rating their physical activity higher and
vice versa. To act on the assumption that the estimation of one’s physical activity influences the
fatigue level it can be stated that participants of the temporal comparison group feel less fatigue
when even feel that they had a high physical activity level. For patients of the social comparison
this means that when thinking that their physical activity is high they also feel more tired. Since
no experiments regarding the relation between self-assessment and fatigue has been done further
Page | 24 Limitations and suggestions for further research
The result of this study has to be interpreted according to the limitations which go along
with the experiment. It has to say that many missing values made a data analysis difficult. For
that reason it was just possible to calculate with mean scores. This technique actually limits the
accurateness of the study and one is forced to examine the data with the help of week mean
scores. Several times the mean score could not be determined because of the lack of enough data.
A first explanation of the way a lot of data was missing is because their where two subjective
variables used. Thus only if it was possible since it is a field experiment this factors could not be
influence by the experimenter. The researchers were dependent on the patients, if they did not
continually wear their feedback system, data would be missing. Concerning the fatigue score
another explanation is that this score was introduced in the course of the experiment so that just
the half of the patients got the possibility to rate their fatigue. Also statistical analysis show that
there were no significant difference between the group with and without fatigue score according
to the demographic variables, other factors not measured in this study, could make a difference.
Another limitation is that analyzing the data two SPSS files has been used. When
calculating the correlation the data has been restructured. Instead of analyzing the seven scores
per week per each participant, the data has been turned so that score two of week one became
statistically a new participant. This means that when calculating the correlation, a file with 7x23
participants has been used. These scores came from just 23 participants so that the reliability of
the test decreased. Furthermore it must be mentioned that a sample of 23 participants is quite
small. As it is generally known this makes the study less reliable and valid. Therefore in further
research the number of participants should be raised. A point which made it difficult for data
analysis was the different units of subjective and objective measurements. One cannot compare
the two units directly and often it was only possible to calculate a correlation, which means that
no statements about cause and effect could be made. A suggestion for further research would be
to make a scale with which one can compare the objective and subjective measurements. One
possibility would be to divide the measurement into different percentage sections. The division
can be made as followed: the mean score of the participants is equivalent to 50%. All scores
between 50% and 75% are high moderate and scores between 50% and 25% are low moderate.
Page | 25
subjective activity and the fatigue level with a score of 5 equivalents of 50%. This schedule
would make it possible to compare the scores of the three variables with each other.
Moreover concerning the results only moderate correlation had been found which implies
that if getting significant results, the relation between the factors was not such strong so one has
Page | 26
Bibliography
Bailey, S. (2010). Tired of being tired: Exercise as a treatment for chronic fatigue sydrome. ACSM´s Health & Fitness Journal, 20-25.
Besharat, M., Behpajooh, A., Poursharifi, H., & Zarani, F. (2010).
Personalityandchronicfatiguesyndrome:Theroleofthefive-factormodel. Asian Journal of Psychiatry, 1-5.
Black, C., O´Connor, P., & McCully, K. (2005). Increased daily physical activity and fatigue symptoms in chronic fatigue syndrome. Dynamic Medicine.
Blacker, C., D.T. Greenwood, K. W., R. Wilson, C. W., Howe, I., & Ali, T. (2004). Effect of galantamine hydrobromide in chronic fatigue sydrome: A randomized controlled trial. The Journal of American Medical Association, 1195-1204.
Blockmans, D., Persoons, P., Houdenhove, B. v., Lejeune, M., & Bobbaers, H. (2003). Combination Therapy with Hydrocortisone and Fludrocortisone does not improve Symptoms in Chronic Fatigue Syndrome: A Randomized Placebo-Controlled, Double-blind, Crossover study. The American Journal of Medicine, 736-741.
Buchwald, D., Pearlman, T., Kith, P., & Schmaling, K. (1994). Gender Differences in Patients with Chronic Fatigue Syndrome . Journal of General Internal Medicine, 397-401.
Chambers, D., Bagnall, A., Hempel, S., & Forbes, C. (2006). Interventions for the treatment, management and rehabilitation of patients with chronic fatigue syndrome/myalgic encephalomyelitis: an updated systematic review . Journal of the Royal Society of Medicine, 506-520.
Clearing-Sky, M. (1988). Exercise: issues for prescribing psychologists. Psychology and Health, 189-207. Deale, A., Chalder, T., Marks, I., & Wessely, S. (1997). Cognitive behavior therapy for chronic fatigue
syndrome: a randomised controlled trial. American Journal Psychiatry, 408-414.
Dubbert, P. (1992). Exercise in behavioural medicine. Journal of consulting and clinical psychology, 613-618.
Evering, R., Weering, M. v., Groothuis-Oudshoom, K., & Vollenbroek-Hutten, M. (2011). Daily physical activity of patients with the chronic fatigue syndrome: a systematic review. Clinical
Rehabilitation, 112-133.
Page | 27 Fisher, K., & Johnston, M. (1997). Validation of the Oswestry Low Back Pain Disability Questionnaire, its
sensitivity as a measure of change following treatment and its relationship with other aspects of the chronic pain experience. Physiotherapy Theory and Practice , 67-80.
Fry, A., & Martin, M. (1996). Cognitive idiosyncrasies among children with the chronic fatigue syndrome: anomalies in self-reported activity levels. Journal of Psychosomatic Research, 213-223.
Fukuda, K., Straus, S. E., Hickie, I., Sharpe, M. C., Dobbins, J. G., & Komaroff, A. (1994). The Chronic Fatigue Syndrome: A Comprehensive Approach to Its Definition and Study. American College of Physicians, 953-959.
Fulcher, K. (1997). Randomised controlled trial of graded exercise in patients with the chronic fatigue syndrome. British Medicine Journal.
Garrakla, M., & Rangel, L. (2001). Childhood chronic fatigue syndrome . American Journal of Psychiatry, 1161.
Gibson, H., Carroll, N., Clague, J., & Edwards, R. (1993). Exercise performance and fatiguability in patients with chronic fatigue syndrome. Journal Neurological Psychiatry, 993-998.
Hu, F., Sigal, R., Rich-Edwards, J., Colditz, G., Solomon, C., Willett, W., et al. (1999). Walking Compared With Vigorous Physical Activity and Risk of Physical Activity and Risk of. Journal American Medical Association, 1433-1439.
Hyong Jin Choa, A. S. (2006). Chronic fatigue syndrome: an update focusing on phenomenology and pathophysiology. Current Opinion in Psychiatry, 67-73.
Inbar, O., Dlin, R., Rotstein, A., & Whipp, B. (2001). Physiological responses to incremental exercise in patients with chronic fatigue syndrome. Official Journal of the American College of Sports Medicine, 1463-1470.
James, A., Bradley, H., Craigie, W., & Onions, C. (1998). The Oxford Englisch Dictionary. Oxford: Oxford University Press.
Jason, L., M.T. Ropacki, N. S., Richman, J., Heatherly, W., Taylor, R., Ferrari, J., et al. (1997). A screening scale for chronic fatigue syndrome: Reliability and Validity. Journal of chronic fatigue syndrome, 39-56.
Jason, L., Richman, J., Rademaker, A. W., Jordan, K., Plioplys, A., Taylor, R. R., et al. (1999). A Community-Based Study of Chronic Fatigue Syndrome. Arch Intern Med.
Page | 28 Komaroff, A., Fagioli, L., Doolittle, T. H., Gandek, B., Gleit, M. A., Guerriero, R. T., et al. (1996). Health
Status in Patients with Chronic Fatigue Syndrome and in General Population and Diseases Conmparison Groups. The American Journal of Medicine, 281.
Lechner, L., Bolman, C., & Dijke, M. v. (2006). Factors related to misperception of physical activity in The Netherlands and implications for health promotion programmes. Health Promotion
International, 104-112.
Lee, C., Simmonds, M., Novy, D., & Jones, S. (2001). Self-Reports and Clinician-Measured Physical Function Among Patients With Low Back Pain: A Comparison. Arch Physical Medicine Rehabilitation, 227-231.
Lee, Y.-C., Chien, K.-L., & Chen, H.-H. (2007). Lifestyle Risk Factors Associated with. Journal of the Formosan Medical Association, 565-572.
Lindal, E., Stefansson, J. G., & Bergmann, S. (2002). The prevalence of chronic fatigue syndrome in Iceland - A national comparison by gender drawing on four different criteria. NOR D J Psychiatry, 274.
Manley, A. (1996). Physical Activity And Health: A Report Of The Surgeon General. Atlanta: U.S. department of health and human services.
Manu, P. (1998). Functional Somatic Syndromes: Etiology, Diagnosis and Treatment. Cambridge University Press.
Marshall, G. (1999). Report of a workshop on the epidemiology, natural history and pathogenesis of chronic fatigue syndrome in adolescents. Journal of Pediatrics, 395-405.
McCully, K., Sisto, S., & Natelson, B. (1996). Use of exercise for treatment of chronic fatigue syndrome.
Sports Medicine, 35-48.
P.D.Thompson, D. Buchner, I. P., Balday, G., Williams, M., Marcus, B., Berra, K., et al. (2003). Exercise and Physical Activity in the Prevention and Treatment of Atherosclerotic Cardiovascular Disease: A Statement From the Council on Clinical Cardiology (Subcommittee on Exercise, Rehabilitation, and Prevention) and the Council on Nutrition, Physical. Journal of the American Heart
Association, 1-8.
Peterson, P., Shephard, J., Marces, M., Schenk, C., Crosson, J., Rechtsman, D., et al. (1990). A controlled trial of intravenous immunoglobulin G in chronic fatigue syndrome. The American Journal of Medicine, 554-560.
Powell, P., Bentall, R. P., Nye, F. J., & Edwards, R. H. (2004). Patient education to encourage graded exercise in chronic fatigue syndrome. The British Journal of Psychiatry, 142-146.
Page | 29 Prins, J., Bleijenberg, G., Bazelmans, E., Elving, L., Boo, T. d., Severens, J., et al. (2001). Cognitive
behaviour therapy for chronic fatigue syndrome: a multicentre randomised trial. The Lancet, 841-845.
Reeves, W. C., Wagner, D., Nisenbaum, R., & Jones, J. F. (2005). Chronic Fatigue Syndrome – A clinically empirical approach to its. BMC Medicine , 1741-7015.
Rimes, K., & Chalder, T. (2005). Treatments for chronic fatigue syndrome. Occupational Medicine, 32-39. Roland, M., & Morris, R. (1982). A Study of the Natural History of Back Pain: Part I: Development of a
Reliable and Sensitive Measure of Disability in Low-Back Pain. Spine, 141-144.
Rowe, K. (1996). Double-blind randomized controlled trial to assess the efficacy of intravenous gamma globulin for the management of chronic fatigue syndrome in adolecentes. Journal psychiat. Research, 133-146.
Sharpe, M., Hawton, K., Simkin, S., Surawy, C., Hackmann, A., Klimes, I., et al. (1996). Cognitive behaviour therapy for the chronic fatigue syndrome: a randomized controlled trial. . British Medical Journal, 22-26.
Silver, A., Haeney, M., Vijayadurai, P., Wilks, D., Pattrick, M., & Main, C. (2001). The role of fear of physical movement and activity in chronic fatigue syndrome. Journal of Psychomatric Research, 485-493.
Vanness, J., Snell, C., Strayer, D., Dempsey, L., & Stevens, S. R. (2003). Subclassifying Chronic Fatigue Syndrome through Exercise Testing. Medicine & Science in Sports & Exercise, 908-913.
Vercoulen, J., Bazelmans, E., Swanink, C., Fennis, J., Galama, J., Jongen, P., et al. (1997). Physical activity in chronic fatigue syndrome: Assessment and its role in fatigue. Journal psychiatric Research, 661-673.
Vollmer-Conna, U., Hadzi-Pavlovic, D., Tymms, K., Wakefield, D., Dwyer, J., & Lloyd, A. (1997). Intravenous immunoglobin is ineffective in the treatment of patients with chronic fatigue sydrome. The American Journal of Medicine, 38-43.
Wearden, A., Morriss, R., Mullis, R., Strickland, P., Pearson, D., Appleby, L., et al. (1998). Randomised, double-blind, placebo-controlled treatment trial of fluoxetine and graded exercise for chronic fatigue syndrome. British Journal Psychiatry, 485-490.
Weering, M. v., Vollenbroek-Hutten, M., & Kotte, E. (2007). Daily physical activities of patients with chronic pain or fatigue versus asymptomatic controls. A systematic review. Clinical
Rehabilitation, 1007-1023.
Page | 30 Wessely, S., & Powell, R. (1989). Fatigue syndromes: a comparison of chronic "postviral" fatigue with
neuromuscular and affective disorders. Journal of Neurological Psychiatry, 940-948. Wessely, S., Nimnuan, C., & Sharpe, M. (1999). Functional somatic syndromes: one or many ? The
Lancet, Vol 354.
Wessely, S., Nimnuan, C., & Sharpe, M. (1999). Functional somatic syndromes: one or many? The Lancet, Vol 354.
Wessely, S., Nimnuan, C., & Sharpe, M. (1999). Functional somatic syndromes: one or many? Lancet, 936-939.
Whiting, P., Bagnall, A., Sowden, A., Cornell, J., Mulrow, C., & Ramirez, G. (2001). Interventions for the treatment and management of Chronic Fatigue Syndrome. Journal American Medicine
Page | 31 Appendix
Treatment
Since researchers are disagreeing about the diagnostic criteria, they also debate about the
right treatment of the syndrome. In most of the cases an intervention of treatment is based on
pharmacological-, immunological-, graded exercise-, or cognitive behavior therapy (Rimes &
Chalder, 2005). Studies using pharmalogical therapy as treatment for CFS patients show no
significant improvements at all (Blacker, Greenwood, Wilson, Howe, & Ali, 2004; Blockmans,
Persoons, Houdenhove, Lejeune, & Bobbaers, 2003; Chambers, Bagnall, Hempel, & Forbes,
2006). Regarding the immunological therapy, the same results are found (Vollmer-Conna,
Hadzi-Pavlovic, Tymms, Wakefield, Dwyer, & Lloyd, 1997; Peterson, et al., 1990; Rowe, 1996).
Contrary to the effects of pharmalogical and immunological therapies, when graded exercise
therapy was used an overall beneficial effect was found (Whiting, Bagnall, Sowden, Cornell,
Mulrow, & Ramirez, 2001). This therapy is some kind of structured activity management
program, which is based on the idea that increasing daily activity, usually walking, has a positive
effect on CFS patient.
Like graded exercise therapy, cognitive behavior therapy also showed positive results concerning the improvement of patients’ lives. The aim of cognitive-behavioral treatments is to analysis the patients’ thoughts about CFS and the handling with it, with the intention to point out factors which may be perpetuating the patient’s symptoms (Rimes & Chalder, 2005). By changing this cognitions and behavior, the patients’ well-being should be improved, which is confirmed by
several studies (Deale, Chalder, Marks, & Wessely, 1997; Prins, et al., 2001; Sharpe, et al.,
Page | 32
Page | 33
Page | 34