Munich Personal RePEc Archive
Mapping the Development Progress in
Tanzania since Independence
Mwabukojo, Edson
University of Bucharest
11 December 2019
i
Mapping the Development Progress in Tanzania since Independence
By
ii
Abstract
The Tanzanian development roadmap is categorized into four main phases; development attain during the Post-colonial period; socialism era development; development pace during the transition to liberalism era; and the currently development situation. Based on the data presented, it is now clear that development situation in Tanzania was promising during post-colonial capitalist period, declined during the Ujamaa socialism, worsen during the period of paradigm shift dilemma, but regained a tremendous improvement during contemporary liberalization era.
iii
Table of Contents
Abstract ... ii
Table of Contents... iii
1.0 Background of the Problem ... 1
1.2 Objectives ... 2
1.3 The Hypothesis ... 3
1.4 Research Benchmarks ... 3
2.0 Theoretical Frameworks ... 5
2.1 Definition of the term Development based on Political Perspective ... 5
2.2 Economic Development Definition ... 6
2.3 Validity of per Capita Income as a Development Interpreter ... 7
2.4 Description of Human Development ... 8
2.5 The General Overview of the Concept of Development ... 10
3.0 Tracing the Pace of Human and Economic Development Progress in Tanzania since 1961 ... 13
3.1 The Pace of Development Progress in Tanzania (1961-1966) ... 13
3.1.1 Education Targets and Achievements in Tanzania during 1961-1966 ... 13
3.1.2 Agriculture Development Situation in Tanzania during 1961-1966 ... 16
3.1.3 Economic Development Situation in Tanzania during 1961-1966 ... 17
3.2 Development Situation in Tanzania during Socialism Period (1967-1985) ... 20
3.2.1 Agricultural Development Status during Post-Arusha Declaration Period ... 20
3.2.2 Education Development Situation in Post-Arusha Declaration Era ... 26
3.2.3 Economic Development Situation in Post-Arusha Declaration Period ... 29
3.2.3.1 Was the Self-reliance Policy Successfully? ... 29
3.2.3.2 The First Economic Crisis in Tanzania in (1978-1985) ... 33
3.3 The Current Development Situation in Tanzania (2000-2016) ... 38
3.3.1 Contemporary Economic Development in Tanzania (2000-2016) ... 38
3.3.1.1 Comparison of Economic Development in three Phases of Paradigm Shift... 44
3.3.2 The Current Agricultural Development Status in Tanzania (2000-2016) ... 49
3.3.2.1 Trend of Agricultural Development since Independence ... 58
3.3.3 The Current Education Status in Tanzania ... 61
3.3.3.1 The Trend of Education Progress in Tanzania since Ujamaa period ... 65
4.0 Conclusion ... 69
iv
Appendix I: Trend of Enrolment into Primary and Secondary Education in Tanzanian Public Schools
during (1961-1982) ... 71
Appendix II: Students Enrolment in Public Secondary Schools by 1976 and Projection (1961-1981) ... 71
Appendix III: Trend of Development Assistance and Foreign Aid for Tanzania since Independence ... 72
Appendix IV: Net Official Development Assistance for Tanzania ... 72
Appendix V: Trend of GDP Growth and Foreign Aid in Tanzania 1970-2008 ... 73
Appendix VI: Trend of Average Annual Growth in GDP and Inflation 1960’s-1990 ... 73
Appendix VII: Students Enrolments trend in Tanzania during 1962-1967 ... 74
1
1.0 Background of the Problem
Independence and improving the human and economic development used to be among the dominating agenda for most of freedom fighters during liberation movements. African peoples were influenced by the freedom politicians to believe that all aspects of development would improve immediately after independence. For instance, Nyerere was cited arguing this when he was stressing for independence before 1961; “in forty years to come after independence Tanzania will be able to change into a well-developed nation”1. Therefore, Tanzania was one of the African nations which held huge hopes that development situation will get better immediately after independence. However, a huge expectation from the peoples was later turned into huge challenge to African governments including Tanzania because; instead of blaming colonial rule, the Tanzania government was accountable to fulfil all the expectations of independence.
Although Tanzania is contemporary one of the countries which are recently experiencing tremendous development progress, until currently, nearly six decades since independence, Tanzania is still an underdeveloped country characterized by poverty, low per capita and human capital deficit. As it is in many Sub Sahara African countries, Tanzania is one of the low-income
countries whereby around 26% of their population living under extreme poverty2. The United
Republic of Tanzania is one of the many the Sub-Sahara African countries3 which got their
independence in early 1960’s4. One of the main challenges faced Tanzania during early days of its independence was an extreme poverty and poor human capital. The GDP per capita in (1960-1962)
was Tsh 3925 (British Pound 19.6 or USD 47)6 and only 1 out of 12 people had more than the
1Tanzania Broadcast Corporation Achieve, Nyerere’s speech when addressing the public in early 1960’s.
2 Tanzania Government, (2019), Budget Speech by Philip Mpango Minister for Finance and Planning when addressing the
Tanzanian Parliament in June 2019.
3 Michael. W, (10/10/2005),1960: independence takes root across Africa: in one momentous year, 17 nations were freed from
European colonial rule, in the New York Times, Vol. No.183 Issue 3, New York, USA. pp.28
4 National Bureau of Statistics, (2013), Tanzania in figures 2012/13, Ministry of Finance, Government of The United Republic of
Tanzania, Dar es Salaam. Pp.1
5 Tanzania Government, (1967), A Mid-term Appraisal of the Achievements under the Five-year Plan (1964-1969), Ministry of
Economic Affairs and Development Planning, Government Printer, Dar es Salaam. table.1.
6 Tanganyika Government, (1964), Tanganyika Five Year Plan for Economic and Social Development (1964-1969), Vol.1,
2
primary education qualification7. According to Nyerere, out of more than 9.4 million available
populations by 1961, the total number of available qualified engineers in the country was limited
to only 2 peoples, and one of them died two years later after independence8. The total number of
available qualified medical doctor was limited to only 12 people in the whole country9. Based on
these details, underdevelopment has been chronic crisis in Tanzania for many years even before independence.
The main concern of the study is that the paces human and economic development progress has been inadequate since independence and as consequence Tanzania had remained underpeopled for such long time. Despite the fact that it is now 58 years since Tanzania got independence, the country is still a low-income country characterised by the high poverty rate and low-quality human capital.
1.2 Objectives
The main focus of the study is to trace and examined the pace of development progress in Tanzania. In order to fulfil the objective of the study, the focus of paper was directed to reveals the following aspects;
i. To uncover the development priorities, targets and expectations.
ii. To uncovering the development progress achieved in since independence.
iii. To establish a development achievement trend since independence.
7 Hughes. T, (1961), Tanganyika on the eve, in Southern Africa story online, Digital Innovation South Africa, pp. 64-74
http://www.sahistory.org.za/archive/tanganyika-on-the-eve [Accessed; 24/08/2017]
3
1.3 The Hypothesis
Tanzania had been stacking into economic bottleneck for long time as consequence the country remained undeveloped.
1.4 Research Benchmarks
Based on the fact that, the main objective of the study was to reveal the trend of development progress, the focus of the first part of this work was dedicated to define the term development in order to establish a common understanding about the requirements of development. Second part was dedicated to reveal the major development targets and expectations. The third step was to reveal all the development progress made since 1961. Therefore, the development progress made or attained in each period of presidency was uncovered. The last phase of the study is establishing a development trend since independence in Tanzania. Three main criteria were set as benchmarks to assess the effectiveness of the pace of development in Tanzania; first is the pace of the country to meet the development expectations and targets as placed in the series of the reports of the Five-Year Plan for Economic and Social Development in Tanzania; pace of the country to achieve the World Bank and United Nation development benchmarks e.g. the World Bank Income group
classification10 and the Universal Primary Education (UPE)11; and the pace of the country to meet
the target and expectations of the Tanzania National Development Vision 2025. In conclusion the development trend since independence was established in order reveal the effective of development outcomes in each period of policy era. However, development is a broad phenomenon which is comprised of various indicators and enablers. Out of all development indicators, this study opted to apply GDP growth and education enrolment rate as samples to indicate level of development attained in Tanzania. Moreover, agricultural growth was also included as a sample sector to demonstrate development situation in Tanzania.
10 World Bank, Economic Development Indicators https://data.worldbank.org/indicator/NY.GNP.PCAP.CD [Accessed 2/11/2018] 11 UNESCO, EFA Goal 2 on Universal Primary Education https://unesdoc.unesco.org/ark:/48223/pf0000221200 [Accessed
4
There are two main reasons behind the author’s decision to choose GDP growth as one of the development indicators in Tanzania out of many available indicators; first, is the easy availability of GDP growth data; and the second factor is the fact that income growth influence enhancement of other development indicators particularly human development factors. For instance, income increases the capability of government to provide public services such as infrastructure construction, improvement of health services and education. Therefore, there is adequate justification to apply level of economic development through GDP growth as development indicator. There are two factors which are applied as the basis to include education as development indicator; first, it is the fact that education is the most superior development driver in comparison with other factors. Education holds two main attributes which distinguished it from other drivers; education is development enabler and at the same time education is an outcome of development. Based on its essentiality on enabling and indicating development in the country the UN has place education as one of the MDGs. Also, the success of other two MDGs; woman empowerment; and
to reduce child mortality rate are direct connected to education12. Therefore, this is another proof
that education had multiplier implications to human development. Second reason behind the decision to choose education as an indicator of development is the fact that education empowerment increases the competitiveness of an individual, therefore increases ability of the people to control their environment such as to make wise decision about their life. In additional to that, such as the UN, UNESCO, UNDP and the Economic forum.
Agriculture has been chosen as sample sector based on a number of factors including; the fact that
majority of Tanzanian households more than 70% their life depends on agriculture13. Moreover,
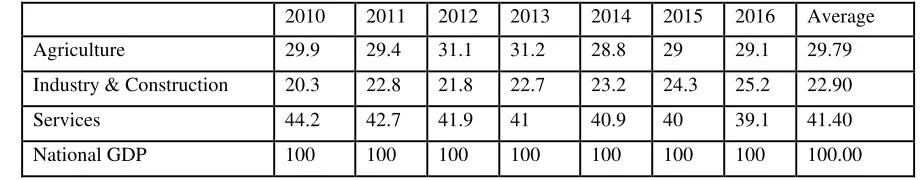
agriculture as a sector contributed about 29% of the GDP in 2015, provides employment to more than 65% of the Tanzania population and covered nearly 100% of food’s domestic demand14. Based on this statistics agriculture sector is not only a larger contributor to country’s GDP, but also essential to the country development and the survival of an individuals. Therefore, the performances of this sector can have immense impacts to the development or underdevelopment of the country probably more than any other sector. However, it is necessary to understand that,
12 WHO, the MDGs [accessed 17/12/2018] https://www.who.int/topics/millennium_development_goals/about/en/
13 World Bank, (2016), Tanzania overview [accessed 25/10/2016] http://www.worldbank.org/en/country/tanzania/overview
14 Deloitte, (2016), Tanzania Economic Outlook 2016: The Story Behind the Numbers, Dar es Salaam, Tanzania Accessed
5
the main objective is not to measure agricultural performance par-se, but rather the intention is to uncover development pace in Tanzania.
2.0 Theoretical Frameworks
2.1 Definition of the term Development based on Political Perspective
Political scientists consider development as a choice of the peoples; and means of the peoples on how to improve their lives, and the beneficiaries are for all peoples. Development should not only be limited to economic growth as many economists may think, but it also covers freedom and happiness of the people within a spectrum of their cultural, belief and way of living. Nnaemeka
(2009), consider development as a process which originated from people’s efforts, willingness and
desire to achieve better civilization based on their own choice and value15. Also, development interpretation includes circumstance of people’s lives and peoples’ desire and effort to improve
their life hood16. Based on Burkey (1993), development is a process in which individuals are
empowered in terms of self-reliance and human capital so as they can be able to realized their
potential for positive change17. Again, Burkey definition reminds us about the people being at the
centred in determining their future wellbeing and means used to attain the desired objectives. Another political scientist who support the notion that, development is for the people by the people is Korten (1990). Based on Korten (1990), development constitutes people themselves to make decision about their lives; whereby development is a sustainable and continuous process which aims at increasing quality of life based on peoples’ aspirations18. Korten (1990) argued this about
development; “Development is process by which members of the community increase their
15 Nnaemeka. A, (2009), Towards and alternative development paradigm for Africa, in Journal of Social science, Eungu State
University of Science and Technology, Enugu, Nigeria.
16 Ibid.
6
individual and institutional capacities to mobilize and manages resources to produces sustainable…… improvements in their quality life consistence with their own aspirations”19.
As other political science scholars, Todaro and Smith (2006), argued; development is not about economic growth, but rather it is a combination of both the mindset and physical reality in which
the society has used as a means to secure life objectives20. According to Todaro and Smith (2006),
there are three main aspects of development; improvement and enabling availability of basic human needs such as shelter, food and health as well as security; enabling suitable conditions necessary for the growth of people’s self-esteem through creation of institutions, political and social environment which enhance human capital and dignity; and expanding social and economic options as well as peoples’ freedom in order to increase variety of choices and the ability of the peoples to choose21.
2.2 Economic Development Definition
Feldman (2016),describe development as efforts which increase the capability and potential of the
people, firms as well as the whole communities who participate to the development of the country
via productivity22. Based on this definition, development is connected with ability of the
individuals, society and the firms to improve their productivity as well as service economy. After debating on five definitions presented by different authors, Somashekar (2003) concluded that; "Development is a continuous process which has to be extended over a long period of time so as to break the vicious circle of poverty and lead a country to a stage of self-sustaining growth or to self-generating economy". He continues saying, the results must involve a rise in real national
income over a long period of time23. According to these definitions, development is not only a
result but rather it’s a continuous process which can lead to a better economic performance over a
19 Ibid.
20 Todaro. P and Smith. C, (2006), Economic development, 9th (Edtn), Pearson Addison Wesley, USA. Pp. 22. 21 Ibid.
22 Feldman, Hadjimichael, Kemenyand and Lanahan, (2016) the logic of development: a definition and model for
investment,’ environment and planning c: government and policy, University of North Carolina, USA and London School of Economics, England, Pp. (34: 5-21).
7
long period of time. Income is used as the main parameter in assessing development outcome; therefore, they supported the notion that income per capita is the right indicator of development. The IMF and the World Bank as well as the Organization for Economic Cooperation and Development (OECD) are among of international agents which had been strong applied income or economic growth as the main indicator to interpret development status of the countries.
2.3 Validity of per Capita Income as a Development Interpreter
Gross domestic product (GDP) and gross national income (GNI) are terms which had been applied interchangeably to classify the size of economic growth in the country. For instance; contemporarily the World Bank use gross national income (GNI) per capita to classify level of country’s development24, while other actors prefer to use gross domestic product (GDP) per capita as an indicator of country’s development. GNI per capita is simply an average income of an individual in the country, obtained by summing up the total value of all goods and services produced by the country domestically plus the income generated by foreign investments in a year, then divided to the number of the total population in the country. According to the World Bank statistics, GNI computation takes into consideration the impacts of inflation in the economy. GDP per capita is the total value of goods and services produced by the country domestically in a given period of time, divided by the number of people in the country. Based on this explanation both units represent an average income of each people in the country. The only difference is that GNI per capita take into consideration the income generated from foreign sources, while GDP per capita ignore the implication of foreign income.
The United national (UN), World Bank and the Organization for economic cooperation and
development (OECD) does use per capita income to define level of development25. Based on
GNI/GDP per capita, the World Bank has classified country’s economies into four main groups,
24 World Bank, why use GNI per capita to classify economies into income groupings?
[Accessed 09/11/2016] https://datahelpdesk.worldbank.org/knowledgebase/articles/378831-why-use-gni-per-capita-to-classify-economies-into
8
which are low-income countries (LICs), lower middle-income countries (LMCs),
upper-middle-income countries (UMCs) and high-upper-middle-income countries26. According to the World Bank statistics as
revised in 1st July 201627, country’s economies with GNI per capita of USA dollar 1,025 or less in
2015 are defined as low-income countries (LICs). Countries with GNI per capita between USA dollar 1,026 and USA dollar 4,035 considered as lower middle-income economies and those with GNI per capita between USA dollar 4,036 and USA dollar 12,475 are defined as upper middle-income economies. High-middle-income countries are those economies with GNI per capita of USA dollar 12,476 and above. Together with that statistics the World Bank has established poverty measurement benchmark, whereby earning of USD 1.90 a day per person is defined as the benchmark of extreme poverty based on 2011 purchasing power parity (PPP).
However, income per capita as development indicator is exposed to a number of critics. Major criticism posed against GDP per capita and GNI per capita is that the measurement doesn’t take into consideration the key indicators of the country’s and individual development. Various studies
done including Decker (1997)28, Development Indicators Report in New Zealand (2011)29, United
Nations report on Indicators of Sustainable Development (2007)30 and Ray (1998)31 revealed how
GDP/GNI per capita as development measure had ignored the implication of crucial elements of development such as level of education, equality and the impacts of informal sector.
2.4 Description of Human Development
United Nations Development Programme (UNDP) is among global development’s stakeholders
who intensely interrogated the concept of development. According to UNDP, economic growth as benchmark alone is not sufficient criteria for assessing the development of a country. Rather,
26 Ibid.
27 World Bank Data Team, (07/01/2016), New country classifications by income level, World Bank. Accessed [10/08/2016]
http://blogs.worldbank.org/opendata/category/tags/news
28 Decker, Rice, Moore, and Rollefson, (1997), Education and the economy: an indicators report, national center for education
statistics, U.S. Department of Education, Washington, DC, USA. Pp. (97-269).
29 New Zealand Government, (2011), development indicators report in New Zealand, the Ministry of development, the treasury,
and statistics, New Zealand
30 United Nations, (2007), Indicators of sustainable development: guidelines and methodologies, 3rd Ed, United Nations, New York,
USA
9
attention should be directed to assess the capability of population to adequately fulfil necessary requirements. On their attempt to overcome the shortcoming of income per capita, UNDP established the Human Development Index (HDI) as development indicator. HDI classify development based on three criteria: standard of living, a long and healthy life and level of
education32. As it was to income per capita, HDI exposed to a number criticism. The UNDP itself
convinced that HDI does not reflect some key indicators of development including levels of inequalities, poverty and human security. This study has three mains concerned against the UNDP-DHI: first, UNDP incorporated healthy life as among three key elements of development indicators. But in reality, health is not the only indicator of human development. There are other important indicators of human development, including access to reliable and affordable power energy, access to clean water, sustainable environment, and etcetera. The issue of discussion was not supposed to base on health agenda only but human security in general. It is also correct to argue that quality of life and standard of living are determined by stability of human security. The United Nations33
defined human security as; “...to protect the vital core of all human lives in ways that enhance
human freedoms and human fulfilment. Human security means protecting fundamental freedoms - freedoms that are the essence of life. This implies preventing individuals from threats, as well as
to promote initiative that enhance people’s ability to fulfil their aspirations. It also implies building
economic, social, political and security as well as cultural atmosphere that enhance people’s lives,
value and dignity. In general, human security is about individual being free from all kinds of
threats; it includes good health (health security), water security, energy security, environment security and safety or life security etc. However, this study sees that the stability of human security can be insured by stability of economic security. The ability of the country to generate income enough to cover population needs is the basis condition if the country has to secure human development. Moreover, the study of series of reports from the Global Peace Index (GPI) (2013, 2014, 2015 and 2016)34, which is published yearly, shows that in most cases but not always democratic and advanced economy countries in terms of income per capita are more peaceful and freer from conflicts in comparison with authoritarian and low-income countries. The point here is, individual security and freedom are more likely to be secured by level of average income of the
32 United National Development Program, (2010), human development report 2010, the wealth of nations; pathways to human
development, UNDP, New York, USA.
33 Human Security Unit, (2009), Human security in theory and practice: An Overview of the Human Security Concept and the
United Nations Trust Fund for Human Security, United Nations, New York, USA.
10
population. However, income per capita can only be inappropriate indicator of level of human security when income gap (inequality) is too high. One of the impacts of an extremely inequality is to create a class of few rich who definitely enjoy the national cake, while the majority remain poor. Based on this view it is not very right to criticize income per capita based on human security measurement. Stability of human security is affected mostly by low GNI and extremely inequality.
2.5 The General Overview of the Concept of Development
Based on the conceptual analysis, it has been revealed that development is a multidimensional concept which can be interpreted in various perspectives; it can be defined based on human security which implies security of individuals in terms of peace and safety, health, education, shelter, standard of living and freedom and democracy. The concept of human security can be expanded to include water security, energy security, environmental security, infrastructure security, health security and food security: Also, the term development can be described based on the economic, social and political aspects. In terms of economic performance, GDP growth or per capita income are used to interpret the level of economic development in a country. In terms of social and political science perspective, peoples are the main determinant of development choices, process and outcome. Also, development is connected with improvement in peoples’ values, dignity, freedom and way of living. UNDP insisted, development should be reflected through quality of life and standard of living. Human Development index presented two major indicators of development, which are quality of health and knowledgeable society. Income presented as an optional indicator
for human development. The argument is; income is just a means to achieve outcome35. This study
agrees with the view that development is a process, but also can be interpreted as results. Therefore, income and standard of living are interdependent, meaning income is enabling better quality of life; and better standard of living again is a pre-condition for income generation. Therefore, this study has a view that development is a continuous cycle which incorporate three major phases; inputs to the process; implementation which includes the government, residents and foreign stakeholders; and outcome which comprises economic benefits and human security. However,
11
some development results such as improvement in education and power energy security can be again an ignition to the development process, which consequently forms a continuous development
cycle. If the society or a country wants to experience a sustainable development as Somashekar
(2003) argued, all three phases must be regularly empowered and improved. Otherwise if one of the phases or all of them are ineffective, the country will earn a limited economic success or enjoy success for a short period of time or trapped in a poverty cycle. Therefore, development can be considered as an endless chain of processes, inputs and results.
Another important fact about development enablers is; methodologies, policies and strategies applied to attain development differ from one country to another, but normally countries do have similar (equivalent) goals or expectation on development outputs (results). All communities are struggling to secure quality life and better standards of living, but they differ in culture, knowhow, methods, strategies and policies to achieve the outcomes. Another fact is that communities are competing for scarce development inputs such as creativity, technology and innovation, scarce capital, scarce resources, and scarce market space. Therefore, those who are effective in competition prosper and become developed and the weaker fall under poverty cycle and that is why the world is always comprised groups of poor, fair and rich peoples, as well as developed countries, middle income and poor nations (refer to Wallerstein’s concept of Core, semi-periphery and periphery). Because of these facts the world has never witnessed the poor forever and rich forever; meaning that individual or community are neither naturally poor nor naturally rich. Every individual or community had a chance to become poor or rich depending on her/his strengths or
competitiveness within a framework of development cycle36. This conceptual view proved by
world history which shows that; since ancient era, the World has been experiencing economic power shifting from one nation or community to another and from one region to another. During British industrial revolution which happened between 1750 and 1930, Britain was a global leader
in terms of economic advancement37, but USA replaced UK as super power in early of 20
centuries38. The WW II enabled expansion of US power in the world as they emerged as the largest
36 Bauer, P, (1965), the Vicious Circle of Poverty: Reality or Myth? Weltwirtschaftliches Archive, Bd. 95, 95, Pp. (4 -20)
37 Crafts. N, (1989), the industrial revolution: economic growth in Britain, 1700-1860, New Directions in Economic and Social
History, Palgrave Macmillan, UK. Pp. (64-75).
http://www.ehs.org.uk/dotAsset/15457c19-e7bd-4045-a056-30a3efac2d47.pdf Accessed [16/08/2016]
12
economy and the super power country39. Contemporary, we are witnessing economic power
shifting from USA to China40 and it has been projected that by 2028 China can be the greatest
economy in the world41. Also, for centuries Europe used to be the richest region in the World but
today South East Asia and the Pacific are about to replace Euro zone as the richest region in the
planet42. This historical fact has been presented so as to uncover the dynamism of the economic
power shift.
Based on the data presented, the minimum development gap in terms of per capital between the
lower-income countries and higher income countries is too big (USA dollar 11,451). This implies that the minimum GNI per capita in higher income countries is higher by more than 12 times than
that of lower income countries. This situation raises a number of questionsabout the development
including; “why some countries are developed while other not”? “Why are some countries manage to attain high income status while other not”? “Is it a natural trend for some countries to remain poor while others prosper”? And “what should be done to stimulate development in LICs”? The question of why are some countries manages to develop while others fail doesn’t have an oblique answer. However, the fundamental reason of disparity in level of development is the ability to compete between individuals, between the community and between nations. The capability of competitiveness in local and global economy determines the status of national or society development. Because of competitiveness factor, development is neither a static process nor static outcome, it is always dynamic. In any period of time, any country can become rich or poor depending on its ability and speed to increase or decrease her national competitive advantage. However, there is no common or unique way of achieving national competitive advantage and consequently development. This implies that factors which found helpful in enhancing development in one country can not necessarily be successful in another country. Moreover, there are many thoughts about factors or driver for development: Marxist school of thought including dependency and neo colonialism theorists believe that, socialism as political ideology and economic system is the core solution against underdevelopment: Adam Smith and modernization
39 Ibid.
40 Sainsbury. T, (2015), US global economic leadership: Responding to a rising China, The Lowy Institute for International Policy 41 Hawksworth and Chan, (2015), The World in 2050: Will the shift in global economic power continue? PricewaterhouseCoopers,
UK. Pp. (11-2012).
42 Layne. C, (2012), the global power shift from West to East, in the National Interest, Center for the national interest, No. 119, Pp.
13
theorists including the Emmanuel Wallerstein observed that, capitalism ideology as political and liberal economic system is the core enabler of sustainable development in any country: Porter as national competitive advantage theorist believed that ability of the country to enhance factors of competitive advantage of a nation is a crucial condition if the country has to develop: Globalization theorists are convinced that ability of the country to take advantage of interconnected or networked world as necessary condition in order to reach development success.
3.0 Tracing the Pace of Human and Economic Development Progress in Tanzania since 1961
3.1 The Pace of Development Progress in Tanzania (1961-1966)
3.1.1 Education Targets and Achievements in Tanzania during 1961-1966
Before independency the main goal of colonial education was to generate a work, force required to support the survival of colonial administration43. Therefore, the objective of the government to invest in education was to accommodate a limited number of African students necessary to meet demand of colonial operations. After her independency, Tanzania inherited British system of education. However, gradually the country started to change the motive of education from
supporting colonial government to education for self-reliance objectives44. Under colonial
education system the opportunity to enrol students into education system was limited to only few African students. Education under colonial rule was offered under the basis of racial discrimination; whereby the first priority in education enrolment was given to white students; the second priority
was Asian Students; and the third priority was African students45. It is said that colonial government
expenditure on education per student in 1958 was; USD 33 per student on black African; USD 74
per student on Asian; and USD 694 per student on European students46. This data provides evidence
43 Dolan. L, (1966), transition from colonialism to self-reliance in Tanzanian education, University of Microfilms, England. Pp.
(1-3)
44 Dolan. L, (1966), transition from colonialism to self-reliance in Tanzanian education, University of Microfilms, England. Pp.
(1-3)
14
of inequality in education during British colonization in Tanzania; the room for black African students to get enrolled into education system was intentionally minimized by colonial rule. Nyerere and his party, TANU used inequality on colonial education as one of his bases to proclaim independence of Tanganyika. Discrimination in colonial education is regarded as a basis of shortage of human capital in the country. Also, British as colonial ruler used a huge deficit in human capital as excuse to delay independence of Tanzania. Nyerere confessed this when
addressing to public during independence movement; “We want independence without conditions.
The British Authority asked us to fulfil a lot of conditions before they can grant us independence. They want us to be adequately educated and so on. We can’t accept their condition, what we want is our independence”47. (Nyerere speech as broadcasted by Tanzania Broadcast Corporation; April, 2018)
These details are provided in order to reveal how human capital deficit was a serious challenge in Tanzania during the early days of independence. Among the major shortcomings faced the young
TANU’s government after independence was the lack of qualified manpower to replace colonial
White employees as government’s servants48. Data revealed that only less than 50% of the eligible children had an access to a formal education and only 1 out of 12 had more than the primary
education qualification49. Moreover, data revealed that only 1.7 % out of the total number of the
population eligible to attended secondary school education were able to attain secondary school
education by 196350. Furthermore, there were only 10 government secondary schools in the whole
country, and the number of African natives with University graduate’s qualification was limited to around 100’s51. According to Nyerere, the number of Africans with teaching graduate qualifications by 1964 was only 20 out of more than 9.4 million populations in the country52.
47 Tanzania Broadcast Corporation, (April, 2018), Nyerere speech when addressing to the public during liberation movement in Tanzania.
48 Edwards. S, (2012), is Tanzania a success story? a long-term analysis, University of California and National Bureau of Economic
Research, Los Angeles, USA. Pp. (13-14)
49 Hughes. T, (1961), Tanganyika on the eve, in Southern Africa story online, Digital Innovation South Africa, pp. (64-74)
http://www.sahistory.org.za/archive/tanganyika-on-the-eve [Accessed; 24/08/2017]
50 Tanzania government, (1964), Speech by Julius Nyerere, the first president of Tanzania when address to the parliament in 12th
May, 1964, in the five-year plan for economic and social development 1964-1969, Government printer, Dar es Salaam, Tanzania. Pp. 12.
51 Hughes. T, (1961), Tanganyika on the eve, in Southern Africa story online, Digital Innovation South Africa, pp. (64-74)
http://www.sahistory.org.za/archive/tanganyika-on-the-eve [Accessed; 24/08/2017]
52 Tanzania government, (1964), Speech by Julius Nyerere, the first president of Tanzania when address to the parliament in 12th
15
Therefore, the government didn’t have any option than importing teachers from abroad in order fill the gap of teacher’s deficit53. Based on the fact that, human deficit gap was huge in the country; and based on the fact that Africans were not pleased with the presence of foreigners as public servants, through his speech when addressing to the parliament in 1964 Nyerere explained to the parliament the implication of huge deficit of human capital in the country in order to justify the
government decision to keep on employing foreigners54. Moreover, Nyerere asked Africans to be
cooperative to foreign employees as the country didn’t have any option than depending on
foreigners in order to cover the gap of the teachers’ deficit55. According to table 3.1, by 1961; a
total number of students enrolled into primary education were 486,470 students; and students enrolled into secondary education were 11,832. Also, the number of Tanzanian students enrolled into University education within East Africa and overseas in 1945 were 3; in 1957 were 282; and in 1962 were 554 students out of country’s population of around 9.4 million peoples (see table 3.1). Based on the findings, it has been revealed that the gap of the deficit in human capital during early days of independence in 1960’s was too huge in Tanzania. But what matter most is the fact that, the country did not expect to cover the gape in any time shorter as the nation did neither have any
University nor any higher learning Institutions56. High number of illiteracy population did not only
hinder the process of ‘Africanization’ in public and private services, but also was an obstacle against country’s development. Poor number of children enrolment to primary education during the colonial period was the main reason behind the high rate of an illiteracy population in Tanganyika in 1960’s. Illiterate population was also an outcome of lack of education inputs such as education infrastructures including inadequate number of primary and secondary schools and lacking of Colleges and high learning institutions in the country. The author’s view which is supported by Hughes (1961) is; before and during 1960’s Tanganyika experienced multiple difficulties which would not be addressed within a short period of time as they required a long-term solution. Lack of adequate education infrastructures, teachers and other necessary inputs resulted in multiple impacts on productivity and provision of public services including health care
53 Ibid.
54 Tanzania government, (1964), Speech by Julius Nyerere, the first president of Tanzania when address to the parliament in 12th
May, 1964, in the five-year plan for economic and social development 1964-1969, Government printer, Dar es Salaam, Tanzania. Pp. (Xii-Xiii).
55 Ibid.
56 Galabawa. C, (1990), Implementing Educational Policies in Tanzania, in World Bank Discussion Papers, the International Bank
16
services. For instance, it is said that, one clinical doctor was used to serve about 16,776 peoples in
[image:22.612.192.423.197.319.2]average per year in 196157.
Table 3.1: Student Enrolment Rate into Education in Tanzania during 1961 -1966
Year Primary School Secondary School
1958 3,499
1960 10,133
1961 486,470 11,832
1962 518,666 14,175
1963 592,104 17,176
1964 633,678 19,897
1965 710,200 21,915
1966 740,991 23,836
1967 753,114 25,551
1968 28,157
Sources: The second five-year plan, Tanzanian Ministry of education, (07/12/1968), Annual report of the department of education 1958; 1962; 1966, in the Standard, Dar es Salaam, Tanzania: Tanzanian Ministry of education, (1961), Tanzanian education report, in Final report of the Addis Ababa’s conference on education development in Africa, Ethiopia.
3.1.2 Agriculture Development Situation in Tanzania during 1961-1966
According to Tanganyika development plan for 1961-1964, agriculture contribution to the
economy in 1961 was 45% of the GDP58. Moreover, 80% of the country’s income was generated
from exportation of livestock and agricultural products; whereby the leading exports were Cashew nuts, Sisal, animal Skin, Cotton, Coffee and Tea. By 1961 Tanzania was the world leading sisal producer, and the crop contributed about 40% of the value of all exports in the country59. The
production of sisal in Tanzania during 1961 and 1964 was increasing at the rate of 2-3% annually60.
The contribution of major crops which included coffee, cotton and sisal all together were 62.4% of
57 Ibid.
58 Tanzania Government, (1964), the first five-year plan for economic and social development plan for (1964-1969), government
printer, Dar es Salaam, Tanzania. pp. (107-108).
59 Rwegasira, Arkadie and Green, (1980), Economic shocks and national policy making; Tanzania in the 1970’s, Series No.8,
Institute of social studies Research, the Hugue, Netherland. Pp. (81-85).
60 Tanzania Government, (1964), the first five-year plan for economic and social development plan for (1964-1969), government
17
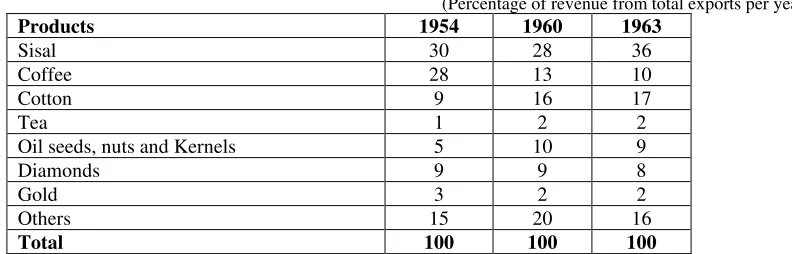
all receipts from total exports during 1963 (see table 3.2)61. All these data provide a proof of one
[image:23.612.136.532.224.351.2]aspect; the backbone of Tanzanian economy during 1961- 1964 was neither Gold nor Diamond, but rather it was agriculture.
Table 3.2: Contribution of Major Exports during (1954 -1963)
(Percentage of revenue from total exports per year)
Products 1954 1960 1963
Sisal 30 28 36
Coffee 28 13 10
Cotton 9 16 17
Tea 1 2 2
Oil seeds, nuts and Kernels 5 10 9
Diamonds 9 9 8
Gold 3 2 2
Others 15 20 16
Total 100 100 100
Source: extracted from the first five-year plan for economic and social development plan for Tanzania during (1964-1969), government printer, Dar es Salaam, Tanzania. Pp. 108.
3.1.3 Economic Development Situation in Tanzania during 1961-1966
During independence struggle, TANU party and its leader Nyerere, convinced and influenced natives to oppose colonial ruler with the promising of bringing positive changes to people’s life. It was easy for TANU to win not only the support of the people but also their hearts and minds; because the people themselves were victims of the colonial rule oppression and therefore, they were fed up with colonization. Extreme poverty was a huge problem in Tanganyika during the
British rule in Tanganyika; the GDP per capita in (1960-1962) was Tsh 39262 (British Pound 19.6
or USD 47)63. According to Tanganyika development plan for (1961-1964), out of the population
of around 9.6 million peoples only 5% were wages earners in the country. The country’s GDP was
British Pound 180 million and the GDP growth rate was 5% per year. Moreover, out of population
61 Tanzania Government, (1964), the first five-year plan for economic and social development plan for (1964-1969), government
printer, Dar es Salaam, Tanzania. pp. 107-108.
62 Tanzania Government, (1967), A Mid-term Appraisal of the Achievements under the Five-year Plan (1964-1969), Ministry of
Economic Affairs and Development Planning, Government Printer, Dar es Salaam. table.1.
63 Tanganyika Government, (1964), Tanganyika Five Year Plan for Economic and Social Development (1964-1969), Vol.1,
18
of 9.6 million peoples; only about 3.5% earned wages by 1962. Africans believed that colonialism
was behind all economic hardship and human insecurity surrounded them including poverty trap64.
Therefore, they were easily convinced, and eventually started to support decolonization movements with massive expectation of changes in their social, economic and security situation, if TANU would succeed to decolonize the nation. The massive expectations of the natives were used by TANU as a political fortune against resistance from the colonial government during independence struggles; but eventually the same expectations turned into challenge against TANU government
in the early days of post-independence65. The young government was answerable to address the
poverty problem facing the country. Arnold (2006) argued, “in the last hours before Tanganyika
became independent on 9 December, 1961 Nyerere revealed his greatest anxiety was the people’s
expectation that independence would bring rapid changes, and that the government would be unable to fulfil their hopes”66. The challenges were more serious because in reality it was almost impossible for the young government to provide a short-term solution against existed social and
economic challenges due to a number of shortcomings67. Then people’s expectation turned to be a
huge mountain for the TANU government to climb68. Lack of adequate capital to finance the
economy was among the main challenge to Nyerere’s government in 1960’s. When he was addressing to the parliament in 1964, Nyerere argued this about the financial capability of the
country; “we are proposing to spend British pound 246 million on developments in the next five
years.... Of this more than half will have to come from abroad”69. Actually, this was Nyerere’s declaration that dependence to foreign actors is unavoidable if development objectives have to be fulfilled in Tanzania. Based on Nyerere’s argument, the aid economy policy was officially declared as one of the main development drivers in Tanzania.
64 Hughes. T, (1961), Tanganyika on the eve, in Southern Africa story online, Digital Innovation South Africa, pp. 64-74
http://www.sahistory.org.za/archive/tanganyika-on-the-eve [Accessed; 24/08/2017]
65 Ibid.
66Arnold. G, (2006), Africa: A Modern History, Atlantic Books, London, United Kingdom.
67 Hughes. T, (1961), Tanganyika on the eve, in Southern Africa story online, Digital Innovation South Africa, pp. 64-74
http://www.sahistory.org.za/archive/tanganyika-on-the-eve [Accessed; 24/08/2017]
68 Ibid.
69Speech by Julius Nyerere, the first president of Tanzania when address to the parliament in 12th May, 1964, in the Five-Year Plan
19
By 1964, the main trade partner to Tanzania in terms of export and imports was United Kingdom,
followed by European Economic Community and the North America70. Whereby, the market
destination of about 30% of all Tanzanian exports was United Kingdom, while European
Community zone consumed about 20 % of total Tanzania exports (see table 3.3). On top of that
UK consumed one third of all Tanzanian sisal and was the only market for all the Gold and
Diamond from Tanzania71. This implies that the Western countries particularly the UK was
[image:25.612.138.494.353.486.2]important partner to Tanzanian economy. Therefore, it was a matter of vital for the country to maintain and enhance economic tie with the Western countries if the Tanzania economy have to prosper.
Table 3.3: Major Market Destinations for Tanzania Exports during 1954 -1963
(In percentage of total value of exports)
1954 1960 1963
United Kingdom 32 2 31
Kenya and Uganda 3 4 5
Hong Kong 2 5 7
India 5 8 4
USA & Canada 15 10 10 European Economic Community 19 17 20
Japan 1 5 3
China 0.5 6
Others 23 21 15
Total 100 100 100
Source: Tanzania Government, (1964), the first five-year plan for economic and social development plan for (1964-1969), government printer, Dar es Salaam, Tanzania. Pp.109.
70 Tanzania Government, (1964), the first five-year plan for economic and social development plan for (1964-1969), government
printer, Dar es Salaam, Tanzania. pp.109.
20
3.2 Development Situation in Tanzania during Socialism Period (1967-1985)
3.2.1 Agricultural Development Status during Post-Arusha Declaration Period
Based on the doctrine of Ujamaa socialism (the Arusha Declaration), the pivot of agricultural development in Tanzania during Ujamaa period was Villagization programme and collective efforts in production. Socialism and Rural Development policy was placed as guidance to enable success in agricultural performance and rural development. According to Socialism and Rural Development policy, it was the goals of socialism to enable people to live together in Ujamaa Villages and to enforce people to work collectively in their community farms. Following the introduction of villagization program, many Ujamaa villages were established around the country and rural people voluntarily or by force were requested to move and settle into established Ujamaa
villages72. After a successful establishment of planned Ujamaa villages around the country, many
people were able to move into established Ujamaa villages by 1980. Records reveal that by 1979 there were about 14.9 million peoples moved to live in 8,046 established Ujamaa Villages throughout the country. The number of people living in Ujamaa Villages by 1979 was equivalent to 97% of the total number of all rural population in Tanzania73. The migration of peoples to Ujamaa Villages kept on increasing year by year; it was estimated that by 1980, the total number of the people living in established development Villages and Ujamaa Villages had increased to about 15.4 million which is equivalent to 82.3% of the total number of Tanzania’s population in
198074. Based on the estimate of 1980, the total number of Tanzanian populations were 18,674,100
people75.
The success in establishment of Ujamaa villages does not imply Ujamaa village policy was also successful; yes, the government was able to move people into Ujamaa villages, however a collective effort in productivity which was the core idea of Ujamaa belief was never being
72 Ibid.
73 Kulaba. S, (1982), Rural Settlement Policies in Tanzania, in Habitant International, Vol. 6; No.1-2, Pergamon Press ltd, United
Kingdom. Pp. 15.
21
attained76. Based on author’s view, the failure of collectiveness policy was not a surprise, instead
it is something expected. Collective and cooperative policy which was implemented under the framework of social equality was of more theoretical promising; in reality it is unrealistic and impracticable policy. As Adam Smith argued, competitiveness, selfishness and Uniqueness are natural characteristics of human being, therefore equality is an unattainable dream. Based on the fact that fundamentally peoples differ in performance, intelligence and creativity, it is not right to force peoples to operate equally in all aspects of life. Therefore, forcing peoples to work in collective in community farms is like eroding agricultural productivity and encouraging laziness behaviour.
Another policy towards agriculture was establishment of state’s owned farms under spectrum of large plantations. According to second five-year plan 1969-1974, the main objectives of establishing state’s farms all over the country was; first, to increase agriculture production and consequently to increase government revenue; the second objective was to use state’s farms as
satellite farms for the people so as to enable knowledge and technology transfer77. It was projected
that, about 250,000 acres of the new state’s farms would be established by 197478. The author is not pleased with the decision to discourage private investments in agriculture in order to let the government monopolization in agricultural production and business. The best decision would be to let private investments and government farms as well as SOE’s to coexist in order to increase competitiveness and fairness in agricultural production and business.
Also, this study found the necessity to compare the level of development attained in terms of agricultural outputs during pre-Arusha Declaration period and after adoption of Ujamaa doctrine. Based on comparison of quantity of development attained, some audience can be able to uncover the effectiveness of the decision to abandon capitalism ideology in 1967. By 1976, agriculture as the backbone of the country economy was employing about 90% of the population, and contributed
76 Lorgen. C, (1999), The Experience of Villagization: Lessons from Ethiopia, Mozambique, and Tanzania, Oxfam GB paper,
Oxfam-GB, London, United Kingdom. Pp. 17-19
77 Tanzania Government, (1969), the second five-year plan for economic and social development plan for (1969-1974), government
printer, Dar es Salaam, Tanzania. Pp. 30-31.
22
about 40% of the GDP79. Moreover, in 1974 and 1975 agricultural exports accounted about 75%
and 77.5% respectively of the total foreign exchange earnings80. By 1964, agriculture was
employing more than 80% of the population and the value of agricultural exports was about 80% of the total earnings from all exports. This implies that the importance of agriculture to the population was more crucial in 1976 than in 1964. Based on these details, the performance of agriculture in terms of production and exports means a lot to the development of the country. However, it was projected that the contribution of agricultural sector to the GDP would gradually decrease from 58% to 48% of the GDP by 1979 and to about 37% of the GDP by 1980.
The performance of agricultural sector in Tanzania faced serious difficulties during 1970’s. According to the third five-year Plan (1977), the growth rate for agricultural production during 1964-1968 was 3.3% per year; and during 1973-1975 it reached its critical low rate of 1.5% in
average per year81. As it has been revealed, agricultural performance in terms of growth was higher
in pre-Arusha Declaration period in comparison with the situation during socialism era. While the agriculture was making a slow pace in its growth, in the same periodical interval the GDP recorded
a growth of 4.8% in average per year a much higher growth than agriculture82, meaning that
agricultural sector was eroding the GDP growth. What matter most is the fact that the population growth rate in the same periodical interval in Tanzania was extremely higher; 2.7% in average per year. This implies that agriculture which was the backbone of the country’s economy was making a relative slow pace in growth in comparison with the rapid increase in population; this was not a good indicator to the survival of 90% of the population whom their life was depending on agriculture. However, there is excuse for decline of agricultural production growth and exports during 1973- 1974. The country faced a serious drought during 1973-1974 which consequently eroded the agricultural production in the country. Because of the drought, the country experiences a serious decline in production of food crops including maize, rice and wheat production; For
instance, production of maize declined for more than 20%83. Also, the major commercial crops
79 Tanzania Government, (1969), The Third five-year plan for Economic and Social Development 1976-1981, Government Printer,
Dar es Salaam, Tanzania. pp. 14.
80 Ibid.
81 Tanzania Government, (1969), The Third five-year plan for Economic and Social Development 1976-1981, Government Printer,
Dar es Salaam, Tanzania. pp. (14-15).
82 Ibid.
83 World Bank, (1977), Tanzania Basic Economic Report: Key Issues in Agriculture and Rural Development, Annex VI, World
23
including Coffee, Sisal were also affected by the drought crisis. For instance; quantity of coffee
exports decreased by 32%; Sisal exports fell by about 18%; and Cotton exports declined by 20%84.
Based on this data it can be wrong to judge the effectiveness of Ujamaa policies based on agricultural outputs and exports during the first half of 1970’s.
However, agricultural production kept on deteriorating in the second half of 1970’s. According to chart 4.1, the production of major crops in Tanzania with the exceptional to tea crop, have suffered a serious decline during a period of nearly two decades from 1970-1989. Coffee and tobacco crops show some increase in production during the second half of 1970’s, however in general the
production of these crops experienced declines during 1980’s. Production of Cashew nut, Sisal and
Cotton experienced a severe downfall during the whole period of two decades from 1970-1989. Based on the third five-year plan which was later abandoned, Agricultural growth rate was projected to increase at the rate of 5.1% for period 1976-198285; however, the target was not successfully reached. Following deterioration in agricultural production, revenue from exports declined and the immediate effect was introduction of economic crisis in Tanzania. In order to rescue the economy, the government decided to abandon the traditional five-year plan, and
introduce new strategy; “the National Economic Survival Programme1982 (NESP)”. The core
objective of National Economic Survival Programme 1982 (NESP) was to increase agricultural
production and exports in order to contain the crisis of balance of trade deficit that faced the country. According to NESP (1982), the solution against economic hardship was to increase exports revenue by 31%, and major source of the exports was agricultural products; however, the
target of NESP was not successfully reached86. For instance; the value of Coffee exports by 1981
was Tanzania shillings 1030 million which was 78% of the target (Tanzanian shillings 1327 millions); the target for Cotton exports was Tsh. 626.2 million but the realization of exports was limited to Tsh. 407.8 million which was 65% of the target; the target for Tea exports was Tsh. 214.67 million but the realization of exports was limited to Tsh. 103.6 million which was only 48% of the target; and the target for Tobacco exports was Tsh. 247.63 million but the realization of
84 Ibid.
85 Tanzania Government, (1969), The Third five-year plan for Economic and Social Development 1976-1981, Government Printer,
Dar es Salaam, Tanzania. pp. (5-7).
86 Tanzania Government, (1982), The National Economic Survival Programme, Ministry of Planning and Economic Affairs, Dar es
24
exports was limited to Tsh. 101.7 million which was only 41% of the target87. Only the value of
Cashew nuts exports met the target of NESP88. In general, NESP programme which was adopted
by the government as a strategical solution against agricultural stagnation in Tanzania during the first half of 1980’s was not adequately enough to rescue the nation from agricultural downfall.
Chart 4.1: Agricultural Production Trend for Major Exports Crops 1971 -1989
*(based; 1970=100)
Source: Appendix VI; Bank of Tanzania, (1980), Economic and Operations report, Dar es Salaam, Tanzania. Pp. (95-96): Source: Bank of Tanzania, (1990), Economic and Operations Report, Dar es Salaam, Tanzania. Table. 27.
Based on the data presented it can be incorrect to continue to consider drought and the externalise as the only main cause for the serious stagnation in crops production and exports during such long period time 1970-1989; there must be other factors than just drought. Stagnation in agricultural
87 Ibid. Pp. 8. 88 Ibid.
100
84 80
58
72
100 97 109 104 96
100
147
200
179 187
100 106
59
32
17 100
125
152
100 96
0 50 100 150 200 250
1970 1971-1975 1976-1980 1981-1985 1986-1989
25
production in Tanzania during socialism period in Tanzania can be an outcome of combinations of many factors than Ujamaa ideology. Drought, global market and poor management are just examples of factors which affect the agricultural performance in any country. However, this doesn’t exclude the fact that agricultural performance was worse during socialist period in Tanzania in comparison with productivity during post-colonial capitalism era. It is also a fact that socialist policies and instruments installed during Ujamaa era were never adequate to prevent or rescue agricultural stagnation in Tanzania. Therefore, regardless of whether socialism was the main cause or not of the decline in agricultural performance in Tanzania, it is also true that socialism was never a solution.
[image:31.612.79.531.534.610.2]Based on the fact that agriculture was not only a backbone of the country’s economy but also was contributing for more than 70% of value of all exports, its declined led to a serious crisis in country’s economy. As it is seen in table 4.1, the role of agriculture in the country’s exports was increasing year by year during 1970’s; and reached its peak in 1977 and 1978. This implies that the performance of other sectors than agriculture including tourism, industrial and mining sectors were critical worse during 1970’s; the country was heavily depending on agriculture to survive. Based on these facts, it is clear that the poor performance in agriculture production means crisis in the country’s economy.
Table 4.1: Agricultural Exports as Percentage of total Exports (1973 -1980)
1973 1974 1975 1976 1977 1978 1979 1980
Agricultural Exports (Tsh. Million) 1,841 2,157 2,164 3,402 3,899 3,152 3,536 3,463
Total Exports (Tsh. Million) 2,409 2,755 2,723 4,054 4,448 3,632 4,313 4,165 Agricultural Exports as % of Total
Exports
76.4% 78.3% 79.5% 83.9% 87.6% 86.8% 82% 83.1%
26
3.2.2 Education Development Situation in Post-Arusha Declaration Era
Among the priorities on Nyerere’s government before and after adoption of Arusha Declaration was to improve education situation in Tanzania. Huge deficit in human capital has been an obstacle against development in the country since independence. Therefore, working to contain illiteracy rate in Tanzania has been always the main objective of Tanzania government. One of the government’s efforts was to increase students’ enrolment rate into education system. Data reveal that the enrolment rate into primary education was increasing year by year during 1960’s and 1970’s. The performance of primary education in the post-Arusha Declaration period are considerable adequate; whereby, 49% of all eligible children were successfully enrolled into standard one, and the illiteracy rate in the country recorded a decline from 79% in 1970 to 39% of the population in 1975; indeed, this was a huge success to the socialist policies. Moreover, the implementation of Africanization policy recorded tremendous success, whereby the number of
African in high level posts increased from 82% in 1969 to 94% by 197489. Based on the following
table 4.2 and Appendix I, after the implementation of the Universal Primary Education (UPE) in 1977 which was followed by the enactment of the Education Act 1978, the entry of students per year into primary school education were tremendous grew from 208,300 in 1974 to 576,347
students in 1981 which is equivalent to the growth of 177%. As it has been revealed through table
4.2, the numbers of students enrolled into primary education as well as the number of primary school education’s leavers have been tremendous increasing during pre and post Arusha Declaration period. Despite the good progress in student enrolment in primary school education, records reveal the poor enrolment in secondary school education during post-Arusha Declaration
era. According to Appendix (I & II) and table 4.2, the entries into the secondary school education
were increasing at the rate of 26% during 1961-1964 and 35% during 1964-1969, but suffered a serious stagnation or a slow growth during 1969-1982. The target of the government was to increase the enrolment into secondary school education from 8,263 in 1974 to above 12, 750 students per year by 1981, but the actual entry into secondary school education in 1981 was 8,907 students which is equivalent to 30% below the entry’s target. But what bothers most is inability of
secondary schools to enrol adequate quantity of primary school leavers.According to table 4.2, the
89 Tanzania Government, (1969), the third five-year Plan for economic and social development 1976-1981, Government Printer,