Munich Personal RePEc Archive
Quantification of Biofuels Potential of
Post-Soviet Countries in the Context of
Global Biofuels Development
Janda, Karel and Stankus, Elena
9 February 2017
Online at
https://mpra.ub.uni-muenchen.de/76728/
1
Quantification of Biofuels Potential of Post-Soviet Countries in
the Context of Global Biofuels Development
Karel Janda*– Elena Stankus**
Abstract. This paper provides an overview of biofuel’s markets in Russian Federation,
Belarus and Ukraine and it estimates prospects of their future development in the context of global biofuels development. We first provide a general characterisation of biofuels, followed by description of development of biofuel industry in the key selected countries and the
outline of current trends on the global market. This is followed by a quantitative analysis of the possible development of biofuels in Russian Federation, Belarus and Ukraine.
Key words: Eastern Europe; Biofuels; Ethanol; Biodiesel
JEL classification: R11; Q16; Q42; P28
This project has received funding from the European Union's Horizon 2020 Research and Innovation Staff
Exchange programme under the Marie Sklodowska-Curie grant agreement No 681228.We also acknowledge support from the Czech Science Foundation (grant 16-00027S) and from University of Economic, Prague (institutional support IP100040). Karel Janda acknowledges research support provided during his long-term visits at Australian National University and McGill University. We thank prof. Valery Zorkaltsev and Elena Gubiy from Melentiev Energy Systems Institute SB of RAS and Georgiy Geletukha from Bioenergy Association of Ukraine for their comments. The views expressed in the paper are those of the authors and not necessarily those of our institutions.
* Karel Janda; Department of Banking and Insurance, University of Economics, Prague, W. Churchilla 4, 13067
Praha 3, Czech Republic and Institute of Economic Studies, Charles University, Opletalova 26,11000 Praha 1, Czech Republic, E-mail: [email protected]
** Elena Stankus; Department of Banking and Insurance, University of Economics, Prague, W. Churchilla 4,
2
Introduction
Renewable energy sources have been perceived as the solution for the number of global
and national concerns. The oil crises and price shock from 1970s had prompted an interest in
the adoption of renewable fuels, which unlike fossil fuels could regenerate. Thus liquid biofuels
would contribute to the saving of decreasing fossil fuels reserves, constantly growing energy
demand and energy security. Moreover, in the context of environmental protection, biofuel’s
provides lower negative impact on climate change compared to traditional fuels. In view of
energy security and diversification, use of biofuels would minimize energy dependence of
importing countries from the major producers and exporters of fossil fuels such as The
Organization of Petroleum Exporting Countries (OPEC). By the same token biofuels would be
the answer to excessive production of agricultural commodities, abandon land and would bring
new opportunities for the local farmers. Despite rapid expansion of biofuels worldwide, this
sector is considered relatively new and being in the continuous development and renovation.
Prompted by increase in energy security and climate change many countries have
decided to develop their own biofuel’s industry. Thus having a comparative advantage such as
arable land or feedstock availability plays significant role in the biofuel’s market growth. For the purpose of this paper were selected countries, whose potential of biofuels is considered
extensive but unevolved yet. Development of biofuels in Russia, Ukraine and Belarus has only
begun and until recent years their potentials were poorly utilised.
We structure this paper in the following way. We first define the biofuels in regard of
their sources and use. Then we talk about current trends on global biofuel’s market, overview of biofuel policies in the key selected countries and incentives applied worldwide in this sector.
After this we estimate the potential of an exported feedstock fromRussia, Ukraine and Belarus
and its contribution to the development of biofuel industry and achievement of established
targets. This paper aims to contribute to the controversial debate on further development of
biofuels in the post-soviet countries and provide reader with data and information that are
3
1.
Introduction to biofuels
In recent years renewable energy sources and especially biofuels have been one of the
most discussed topics in political as well as scientific, public and economic spheres. Biofuels
are renewable alternatives to fossil fuels such as gasoline, coal and diesel in the sector of
transportation. Continuous issues with the supply of energy sources and environmental impacts
from traditional fuels have triggered the expansion of biofuels through extensive researches
and developments (R&D). Generally development of biofuels had been driven by three key
global challenges: energy security, economic development and mitigation of climate change.
The International Energy Agency defines energy security as the uninterrupted availability of
energy sources at an affordable price (IEA, 2016). Possible risks for energy security may cause
disruption of imported energy supply or high energy prices environment. Thus opportunities
for development of domestically extracted sources of energy became attractive for many
countries largely dependent in imported fuels. In the view of economic development, as
biofuels production capacities expand, they create new “green” jobs throughout the economy and new opportunities for income for local farmers. In the context of mitigation of climate
change, nowadays fossil fuels represent not only major source of energy, but also main source
of carbon dioxide emissions (CO2) and greenhouse gas (GHG). Biofuels such as bioethanol
and biodiesel are not CO2 neutral, however they are considered to notably reduce emissions
compared to diesel or gasoline.
Global economic growth has had significant impact to the increase of energy demand.
As reported by U.S. Energy Information Administration (2016), energy consumption is
projected to grow by 48% by 2040. And biofuels may contribute to the meeting these needs in
a sustainable way. In 2014 world Total Primary Energy Supply (TPES) had reached 13,7 Mtoe,
of which 13.81% were provided by renewable energy sources. Graph bellow represents global
4 *Other includes electricity generated from energy sources not defined in the graph: non-renewable wastes, peat, chemical heat etc.
**Other Renewables consists of geothermal, wind, solar and tide energy sources.
Graph 1: Fuel shares in world Total Primary Energy Supply, 2014
Source: Key Renewables Trends Statistics, IEA, 2016
Biofuels are defined as fuels derived from the biomass and produced by contemporary
biological processes. Alike traditional fuels they exist in number of forms and categories and
could also be classified into several generations (from the first up to the fourth generation).
The differentiation of the biofuels is primarily based on three characteristics: the type of the
feedstock, the conversion technology utilized and features of the fuel molecules. Nonetheless
not all types of biofuels perform equally regarding influence of climate change, energy security
and ecosystems.
1.1.
The conventional biofuels
The conventional or the first generation biofuels refers to the fuels, which have been
obtained from the material like starch, sugar, vegetable oil and animal fat. The most known
representatives of the 1st generation biofuels are bioethanol, biodiesel, vegetable oil and
biogas. However among liquid biofuels—mainly bioethanol and biodiesel—represent the vast majority of the renewable share (“Renewables 2015.Global Status report”, 2015). The main difference from the second generation biofuels is in the feedstock used and volume of GHG.
The 1nd generation biofuels could notably affect the food supply in case of large quantity
Natural gas 21,22% Oil
31,33% Coal 28,53%
Nuclear 4,80%
Other*
0.30% Hydro2.40%
Biofuels and waste 10,11%
Other renewables** 1.30%
Renewables 13.81%
5 production. Another big disadvantage of the conventional biofuels is that the required crops
are demanding in the usage of the several inputs such as land, water, fertilisers and pesticides
etc., followed by implications on the environmental side (Ziolkowska & Simon, 2011).
In the beginning of 21st century the interest in biofuels production had globally
significantly escalated, mainly in the food crops containing source of the biomass related to
the first generation. Therefore nowadays the production of the conventional biofuels is
represented by well-established and already developed technologies.
1.2.
The advanced biofuels
Since the boom in the 1st generation biofuels, the focus shifted to the advanced biofuels
which include the second and further generations. The main aspect of advanced biofuels
definition is reduction of GHG emissions by minimum 50% compared to fossil fuels.
Interesting to note, that the U.S. Environmental Protection Agency (EPA) considers Brazilian
sugarcane ethanol as an advanced biofuel since it decrease greenhouse gases by 61% in
comparison with traditional gasoline. As was mentioned earlier the 2nd generation biofuels are
extracted from a different non-food feedstock, the food crops could only be used in production
of advanced biofuels, if they were already used for food purposes, for the instance - the
vegetable oil waste. Therefore the main source for the 2nd generation biofuels is wastes, energy
crops, agricultural and forestry remains and algae. This generation of biofuels is considered to
be “greener”, based on the sustainability of the feedstock, the greater reduction of GHG
(greenhouse gas) emissions, its influence on the biodiversity and the land usage. Moreover
advanced types contribute to the cost reduction in biofuels production in the long term than its
predecessors. Nowadays modern industries pay attention to the organic waste as a new
resource due to its re-use. European countries especially have been lately devoted to the waste
management. Utilisation of lignocellulosic biomass provides high value usage of low value
wastes, what lifts revenues for companies, processing residues flows.
The 3rd generation biofuels are extracted from algae and have gained a lot of attention
only recently. It became quite popular because of the major advantage it is capable of – diversity. From algae not only biodiesel and some components of gasoline can be obtained,
but also it could be genetically transformed for production of other numerous fuels directly,
6 so far and aimed to provide not only sustainable fuel but also to absorb and store CO2 (Schmetz
[image:7.595.130.476.152.452.2]& Ackiewicz, 2009).
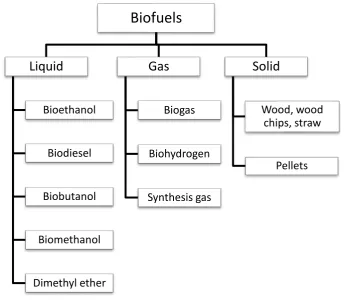
Table 1: Classification of biofuels based on state of aggregation
1.3.
Liquid biofuels: closure look to bioethanol and biodiesel
Bioethanol
First generation bioethanol is made by distillation from the agricultural products
containing starch or sugar, such as corn, grain or sugar cane. Production of conventional
bioethanol can generate significant amount of by-products such as food gluten, enzymes,
starch, bioplastic and fodder. In this regard bio-refinery plants are focused not only on the
production of the bioethanol but big range of the additional products.
Cellulosic bioethanol is a 2nd generation biofuel and offer wider range of feedstocks
to be obtained from. All different types of the lingo-cellulosic materials could be used for its
extraction, which provide full usage of the biomass in the production of the bioethanol.
Lingo-cellulosic material is obtained from variety of the sources, such as agricultural residues, paper
Biofuels
Liquid
Bioethanol
Biodiesel
Biobutanol
Biomethanol
Dimethyl ether
Gas
Biogas
Biohydrogen
Synthesis gas
Solid
Wood, wood chips, straw
7 and municipal solid waste, wood, energy crops and fast growing plants that could be grown on
non-arable land. Considering the world’s experience, the most widely used methods of utilizing bioethanol are (ePure, 2014):
As an additive to motor gasoline fuels in concentration of 5-15% (fuels E5, E10 and E15). For instance E10 contains 10% of bioethanol and 90% of gasoline and is
applicable for automobiles with traditional gasoline engines. Bioethanol adds oxygen
into gasoline blend, what contributes to minimizing an air pollution;
In a mixture with up to 85- 100% of bioethanol (fuels E85, E100), for example fuel with 85% of bioethanol and 10% of gasoline is used in motors with the universal fuel
consumption systems, so-called “Flex-Fuel” engines. But bioethanol contains less energy per gallon comparing to gasoline, what makes blends with higher addition of
bioethanol less competitive on the market. In this regard E85 and higher blends should
be sold with a discount in order to motivate sales (Babcock & Pouliot 2013);
For the synthesis of the methyl tert- butyl ether (MTBE) which is used as high-octane
component of the automobile’s gasoline.
The “traditional” gasoline engines are suitable for E5 as well as for E10 and do not
require additional modifications. According to the Ethanol Producer Magazine (2014), 40% of
the Brazilian cars use mixture of bioethanol and gasoline fuel, in USA this share is much lower
– 10%, and only 5% in Europe. In most EU countries became widely used E5 (fuel with 5% of bioethanol). And meanwhile the United States are already introducing E15 to the market,
France, Finland and Germany recently started transition to E10 fuels (Ethanol producer
magazine, 2014).
Biodiesel
Biodiesel is a renewable clean-burning diesel made by combining methanol (or other
alcohol) and vegetable oil, animal fats or greases. Initial feedstock for biodiesel mechanical or
chemical extraction includes rapeseeds, sunflower seeds, soy seeds and palm oil. However
through development the material resource was broaden to animal fats, recycled cooking oils
and greases. Biodiesel can be used in normal diesel engines as well as some blends in stationery
heat and power applications. The downturn of biodiesel use is that fuel could gel under cold
8 the feedstock and on the additives. This feature brings risks into biodiesel utilization and its
promotion, especially in the countries with cold climate like Russia
The most common type of biodiesel blend is B7 with 7% biodiesel. Regarding Sungate
report (2015) the average blend within EU is 5,2% and limited to contain 7% of biodiesel and
93% of conventional diesel. In the USA the biodiesel as well as bioethanol mandates vary from
state to state: in Illinois and Minnesota blends higher than B10 are common, in New York
current standard is B5, Minnesota is planning to introduce B20 in 2018 (Minnesota Department
of Agriculture, 2016) and for instance in Ohio the biofuels mandate was cancelled in 2015 on
a state level. . New mandates for B10/B15 are technically feasible for several countries and
already under implementation in Argentina (B10), Indonesia (B15), Malaysia (B10 for the
transportation sector) and expected to be applied in Brazil within next 2 years (B10) (Biofuels
Digest, 2016).
While bioethanol is more widely used in USA, in Europe the biodiesel is more popular.
For instance biodiesel reckons 3% (2,8 Million tons produced in 2015) on the German market
and only 0,15% (4,8 Million tons in 2015) in USA, which is the biggest producer of the
biodiesel by country. The second largest producer is Brazil with 2,1 Million tons of biodiesel
(Statista, 2016). Annually more than 9 Million tons of biodiesel are produced in EU by over
256 plants mainly located in Germany and France. Moreover it also reach 80% share on the
transport biofuel market in EU which contribute the EU to be the leading consumer of biodiesel
(ePure, 2015).
2.
Characteristic of biofuel policies in the selected key
countries
The rapid development and sustainable growth of the biofuel sector in many cases is
primarily motivated by country policies and supportive regulations worldwide. The industry
of the biofuels still being in evolving phase, it is lacking competitiveness compared to the
traditional fossil fuels. However without a support from the governments, this sector wouldn’t
continuously develop worldwide over a past decade. In the next section we would like to
provide a reader with a brief overview of biofuel policies in the selected key countries and
9
Based on the world’s experience and biofuels market overview of the selected
countries, for the successful development of the renewable energy sources, it is necessary to
set up system of roadmaps aligned by supportive regulations, policies and targets. Policies,
that include blending mandates and financial support from the government aligned with
secured feedstock supply showed to be essential for the industry growth. Analysis of the
policies in the field of renewable energy usage shows that common ways to stimulate
investments in biofuels are:
1. Favourable taxation including tax reduction or tax exemption on biofuels for both
sides: customer and producer. Biofuels produced commercially tend to have higher
costs of production compared to fossil fuels. Moreover these costs are difficult to
estimate because of dependency on feedstock prices, technology and other national
factors. As a consequence some countries apply zero excise duty that favours
production.
2. Legislative and policy framework including introduction of the energy standards,
consumption targets (facultative) mandates (obligatory), which represent minimum
share in total transport fuel, and such an incentive as Green Certificates (RECs).
While application of targets is characteristic for Australia, China, India, Indonesia,
and Malaysia, mandates widely used in the United States and EU. The mandates
program requires oil companies to blend biofuels with the diesel and gasoline
regarding specific mandate. Green Certificate (REC) is a non-tangible tradable
energy commodity that represents the environmental value of produced energy
from the renewable source. Opposite to traditional supportive programs and
policies, certificate encourages biofuel use by providing subsidy for its production.
Depending on the market, RECs could have a significant impact on the
competitiveness (Osterkorn & Lemaire, 2008)
3. Specific credit lines with favourable conditions that attracts investments into the
industry and other forms of financial incentives, including preferential loans and
subsidies (Rajagopal & Zilberman, 2007). De Gorter and Just proved in their study
(“Water” in the U.S. bioethanol Tax Credit and Mandate”, 2008) that combination
of the tax credit policy, which works as direct subsidy, with binding mandate is
10 offered. However, if the tax credit is the only obligatory policy established, it does
not benefit to the buyer;
4. Direct investments in R&D, technology and biofuels sector;
5. Trade measures, import tariffs in particular;
6. Well-developed infrastructure (transportation, water and electric systems, fuelling
stations, etc.);
7. Intentions to stimulate biofuel production efficiency and development on different
levels of marketing and supply chain (Blanco et al. 2010). For instance supportive
measures in agriculture and encouragement of local farmers;
8. Existence of big experienced players on the market that have resources to invest in
technology and promotion of biofuels;
9. For liquid biofuels technologies in the automotive and car industry are crucial.
Vehicles, with the engines suitable only for standard-grade fuel, are relevant only
for fuel blends with maximum 5% of biofuel. This is sufficient in the early stage of
biofuel development, however for further development there is a need for
implementation of modifications in engines and usage of higher blends;
10.The capability to create a long-term strategy and accomplish it by continuous
development.
2.1.
USA
Governments in United States provide various types of support policies on different
levels, beneficial to biofuels and renewables in general. Nowadays US policies include
mandates along with tax credits, preferential loans and funding of R&D as well as construction
of bioplants. Diversified government initiatives have substantially contributed to the leader
status in production of bioethanol for the last 5 years: United States along with Brazil, jointly
accounted for 85% of global bioethanol production nowadays (Renewable Fuels Association,
2015)
The USA had already started establishment of biofuel policies in 1978 with Energy
Tax Act which established tax exemptions and subsidies for a bioethanol blending in gasoline.
In 2004 the excise tax exemption was replaced by tax credit for bioethanol and biodiesel that
had been extended afresh in 2014 and currently presents the largest subsidy to biofuel
11 Producer Tax Credit, which allows producers of fuel that was extracted from specific types of
cellulose to receive $1.01 per gallon back as a tax credit. In the recent past it was also extended
to algae fuels, and of $1 per gallon for biodiesel. Moreover tax credit can be passed further to
the consumer in a form of lower price.
Besides, Energy Policy Act initiated binding mandates in 2005. The first renewable
fuel volume mandate was introduced by Renewable Fuel Standard program (RFS) and
determined the minimum volume use of biofuel in the sector of transport. Since then, the
mandate was expended twice: adding the biodiesel mandate along with raising the required
annual use of biofuel in transportation to 9 billion gallons in 2008, growing to 36 billion gallons
in 2022. In order to contribute to an expansion of the second and higher biofuel generations,
mandate for 2022 establishes the requirement of a minimum 22 billion gallons for advanced
biofuels and limits conventional biofuels to maximum of 15 billion gallons.
2.2.
Brazil
Brazil was one of the first countries, which have developed sustainable biofuel
economy. First policies, supporting bioethanol production, pioneered as early as 70s in
National Bioethanol Fuel Program (part of National Alcohol program - Proalcool) in response
to oil crisis. Proalcool back then was the world’s largest program promoting alternatives to traditional fuels and obliging the use of bioethanol extracted from sugarcane. Expansion and
development of bioethanol industry in Brazil is a result of successful bioethanol Fuel Program
implementation that led the country to the worldwide second place in bioethanol production
(7,093 Millions of gallons in 2015).
Since 90s till nowadays the government of Brazil does not control bioethanol sector
directly nor over the production volume, nor through price settlement, but manages regulation
over mandates and tax benefits. Since 1977 government employs bioethanol use binding
mandate, which was renewed lastly in March 2015. The new blending obligation settles higher
bioethanol share – 27% instead of 25%, but the increase is mandatory only for regular gasoline,
conditions for premium gasoline don’t change. Tax incentives for bioethanol fuel include tax
reduction of Contribution for Intervention in Economic Domain (CIDE), Contribution to the
Social Integration Program (PIS) and Contribution for Financing Social Security (COFINS) to
zero and tax credits. Tax credit of 0,3% for bioethanol exporters was applied from 2014, what
12 government in several states of Brazil raised Tax for Circulation of Goods and Services
(ICMS) on gasoline whereas reduced it for bioethanol what encourages its consumption.
Besides for flex-fuel vehicles tax burden is usually lower in comparison with fossil fuel
powered cars. Import tariffs were cut to zero from 2010 till nowadays. What’s more National
Bank for Social and Economic Development (BNDES) offers special credit lines for bioenergy
sector as well as bioethanol industry to finance investments into production capacity
enlargement and supply chain.
The development and expanding of Brazilian biodiesel market have been started much
later then bioethanol, however government pays a lot of attention to promotion of biodiesel.
First 2% biodiesel blending target was introduced in 2008 and current obligatory mandate
already reaches 7%. As opposed to bioethanol, import tariff for biodiesel is fixed at 14%. The
taxation of biodiesel is also more complex and depends on the feedstock, size of producer and
region of production. Earlier in 2014 Brazil introduced advanced biofuels to the market,
nonetheless due to expensiveness of the technology and enzymes used, the large scale
production seems to be unrealistic yet (Barros, 2015).
2.3.
EU
In a drive to cut emissions of carbon dioxide, the European Commission came with the
Directive 2009/28/EC, which promotes different types of renewable energy sources including
biomass. The Directive settles mandatory targets for each country for the share of renewable
energy in overall energy consumption and separately in the sector of transport. Furthermore
along with Fuel Quality Directive (FQD) it lays down the criteria of a sustainable production
of biofuels and bioliquids. Members States are obliged to follow a roadmap and met a target
of 27% share of renewable energy from final energy consumption by 2030. The Commission
has highlighted need for a focus on advanced biofuels and no public support for a food-based
alternative energy sources (European Commission: 2030 Energy Strategy, 2016). According
to the Directive 2003/30/EC and Directive 2003/96/EC, entities, that use blends of biofuels in
fossil fuels, can apply exemption from EU’s minimum excise tax during 6 years period.
Moreover Member States can settle national tax benefits separately after EU approves their
13 The EU had been producing 90% of the world’s biodiesel before 2005. Regardless the fact that USA and Asian producers entered the market followed by decline in the European
share, EU stays the world’s biggest producer and consumer of the biodiesel.
2.4.
China
China has recently become one of the global leaders in production of biofuels and ranks
on a third place in production of bioethanol after US and Brazil. Biofuels market development
is mainly driven by the goal of GHG reduction since China is world’s largest emitter of GHG . According to Statista portal, China contributed to 28,3% share of global energy-related CO2
emissions in 2015.
Chinese biofuel policies are focused on supporting non-grain based biofuels due to the
risk of possible grain shortage and China turning into a net corn importer. The government had
set its current ambition in 2014 under National Climate Change Plan (NCCP). It had become
already 13th Five Year Plan launched later in 2016. The plan settles emission and clean energy
targets for 2020 including reaching 130 billion cubic meters of biofuel production by 2020
(approximately 34 trillion gallons). However the target seems to be unrealistic due to the
current volumes of production and it stays uncertain how Chinese government plans to achieve
the goal (Su &Zhang, 2015).
China, similarly to US, adopted bioethanol blend mandate (E10) in its 6 provinces:
Heilongjiang, Jilin, Liaoning, Henan, Anhui, and Guangxi. Meanwhile the price of bioethanol
is fixed by the government at 91.1% of the gasoline ex-factory variable price. However
government does not have an incentive to determine E10 as national binding mandate in the
nearest future because of its aversion to grain-based biofuels and lack of alternative feedstocks.
Another unfavourable condition for domestic biofuel production is no tax benefits, it is charged
by five% consumption tax. In 2012 China cut off import tariffs for bioethanol with selected
countries and keeps free trade agreement (ten ASEAN countries plus Pakistan, Chile,
Singapore and Vietnam). For other countries the 5% tariff is applied.
On the opposite side, Chinese production of biodiesel is currently very limited even
14 Nonetheless no mandates were established so far and only a few biodiesel plants managed to
stay in business, many of them became unprofitable.
2.5.
Current trends on global biofuel market
While countries all over the world are working on the development of sustainable
biofuel economies, each for their own reasons, United States and European Union are debating
about impacts of 1st generation biofuels on the environment. The argument of the negative
influence from conventional biofuels on food supply, biodiversity, land use and water was
especially in the center of attention after world’s food price crisis in 2007-2008. Meanwhile unpublished report from the World Bank claims that, food products could cost up to 75%
cheaper, if not production of biofuels (Chakrabortty, 2008). Nonetheless concerns about
conventional biofuels led some governments to revise their ambiguousness and targets for next
years and shift focus onto advanced biofuels.
After series of challenges facing biofuel’s market including mentioned food crisis and
rise of feedstock prises, it is necessary to mention current lower oil price environment and its
impact. The recent drawdown in oil prices to five years minimum was the last negative
influence on global renewable industry in the recent years. As shown in the Graph 2 below:
investments into biofuels have followed decreasing trend for the five years, from 10.3 billion
USD in 2011 to 3.1 billion in 2015. However the biggest slide in the investments took place in
2015 caused by drop in oil prices. Investments had declined by 34% in comparison with the
previous year and reached only 1% shares in the total renewable energy investments.
According the Medium-Term Renewable Energy Market Report (IEA, 2015) the negative
effect on the sector of biofuels seems to be overestimated in comparison with reality. Oil usage
in energy production is quite limited in the power sector, but utilization in transport and for
renewable heat extraction is the same as biofuels. This makes them competitors in latter. The
15 Graph 2: Investments in biofuels and oil prices evolution 2004-2015
Source: UNEP, 2016; Statista, 2016; EIA, 2016
Mandates and government’s policies in general have evolved in the key markets over
recent years. Brazil has raised both biodiesel (7%) and bioethanol (27%) mandates as was
mentioned earlier in the paper. To support local producers, governments of Argentina and
Indonesia decided to increase the blending mandate for biodiesel up to 10% as well. Actually
drop in oil prices partially have had a positive effect on biofuels, because of fossil fuel subsidies
abolishment in several countries. Meanwhile there are still risks challenging the biofuels
growth. Potentially continued low oil prices conditions will place development of biofuel’s
policies under critical observation. The industry has already dealt with structural obstacles in
stagnating bioethanol demand in the United States; meanwhile EU announced 7% cap on the
first generation biofuels share in the 10% target for RES used in transportation for 2020.
The biggest challenge facing biofuels nowadays is shortage of investments into
research and development of new generation technologies (Bland, 2015). Especially it
concerns the feedstock, whether food or non-food based. The amount of feedstock for biofuels
is normally 15-20 times lower than is required for chemicals production. Therefore the aim is
to produce with low costs with secured feedstock supply (Bari, 2014). This area requires extra
attention from the technology developers in the nearest future and we could already see some
of them going out of the business. Recent example was BP’s announcement in 2014 to halt cellulosic bioethanol business and sell out its related assets. Strategic decision was made after
0 20 40 60 80 100 120 0 50 100 150 200 250 300 350
2004 2005 2006 2007 2008 2009 2010 2011 2012 2013 2014 2015
OI l p ri ce -US D /b ar re l In v e stm e n ts -b il li o n US D
Investments in biofuels and oil prices evolution
16 investments over $750 million since 2008, pushed by the challenging external environment of
low oil prices (Tullo, 2014).
However International Energy Agency in its Renewable energy medium-term market
report (2015) estimates biofuels production for the next four years to remain stable, see Graph
2. In 2015 worldwide production had achieved the slowest growth rate of 0.9% since 2000 (BP
Statistical Review of World Energy, 2015). But despite low oil prices, blending mandates hold
biofuels consumption and production on the same levels in the sector of transport. In this regard
production of biofuels did not experienced noticeable drawdown even in 2014: biofuels
contribute to 4% of global road transport fuel and production volumes reached 127 billion
litres. The forecast for to 2020 remains 144,5 billion litres and biofuels growth is expected to
reach 4,3% share in transportation.
Graph 3: Production of biofuels and forecast to 2020
Source: Renewable energy medium-term market report, OECD/IEA, 2015
In line with the industry prosperity, forecasted by OECD/IEA, the majority of biofuels
growth is foreseen to come from Asia and South America regions, which are still enthusiastic
in asserting volume targets. The situation on biofuel market in America and Europe is quite
different. Consumption there is motivated by legislation, which is continuously changing. And
uncertainty about future changes in the policy framework brings much higher risk for
renewables in general. There is still a room for strengthening the policy support, which is also
risk prone to decline in oil prices. Therefore for these markets, it is vital to clarify the energy
0 20 40 60 80 100 120 140 160
2008 2009 2010 2011 2012 2013 2014 2015 2016 2017 2018 2019 2020
B
il
li
o
n
l
ite
rs
Production of biofuels
17 strategy and develop sustained long-term policy commitment, which brings confidence in
future investments and secures growth in biofuels industry (Bland, 2015).
3.
Analysis of potential and future prospects of biofuels in
Russia, Ukraine and Belarus
Consumption and related development of biofuels in the country generally depends on
numerous crucial determinants including legislation, infrastructure and feedstock availability.
In the analysed countries, an establishment of biofuel industry is even more complicated due
to the lack of modern technologies, reliance on traditional sources of energy and risks from
unsuccessful biofuel’s market formation, nonetheless they are well provided with the
feedstock.
According to the Doku and Di Falco (2011) study, land availability is more significant
as a driver of biofuel policy than impact of GDP for the developing countries. In opposite way,
GDP is crucial factor for OECD countries while impact of land availability is insignificant.
Countries, selected for analysis, have originally promising comparative advantages for the
development of biofuels. Thus naturally endowed in the land factor, Russia, Ukraine and
Belarus have a precondition to be successful in the sphere of biofuels. Taking into the account
only conventional types of liquid biofuels and relevant feedstock, investigated countries have
high availability potential in at least three out of six most promising crops for production, as
shown in the Table 2. In fact Russian Federation is 3rd in the world in wheat production (exported 30 thousands kt in 2015), Ukraine is 7th (10.9 thousands kt exported) and Belarus is 22nd (35 kt exported). These countries also have placed within ten biggest producers of rapeseed oilseed (Ukraine–6th place, Russia-7th and Belarus is 9th). Availability potential is considered high if production of selected crop is sufficient for the domestic consumption and excessive
volumes are being exported.
18
Feedstock for bioethanol Feedstock for biodiesel
Country Wheat Sugar beet Maize Rapeseed Sunflower Soybean
Russian Federation H L H H H H
Ukraine H L H H H H
Belarus H H L H L L
H - high availability potential; L - low feedstock availability for biofuel production
Most of crops, exported from Russian Federation, Ukraine, and Belarus to the EU are
used for further processing into biofuels. In this regard we would like to calculate the potential
of exported crops and contribution it could bring to the balance of each country’s TPES. We would like to analyze the potential only for the six crops, which have high potential for the
investigated countries. Thus sugar beet will not be considered for Russian Federation, same as
for Ukraine and maize with sunflower and soybean for Belarus. Due to lack of official data for
each of these countries and difficulties to find required statistics in one place, we have compiled
the table below from a number of different sources, which were used above in the work.
3.1.
Biodiesel and bioethanol potential from exported feedstock
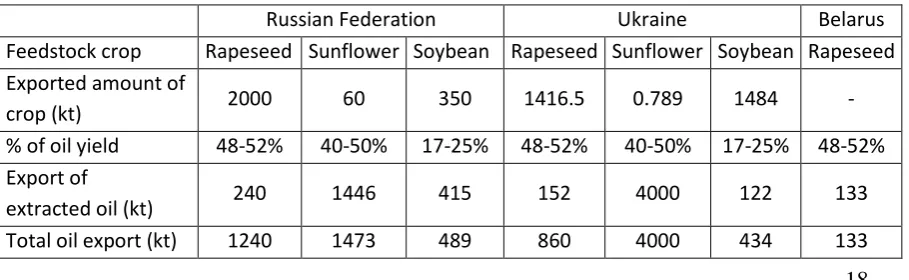
For biodiesel, the calculation of “Total oil export” is taking into account the export of
specific crop oilseeds as well as export of extracted oil from this crop. Annual data for both
indicators are available for Belarus at BELSTAT, for Ukraine – UkrAgroConsult and Russia
– GAIN reports (2016). As in case of Belarus, rapeseed oilseed is not being exported in the opposite to rapeseed oil. To estimate percentage of oil in the crops yield and biodiesel in oil
yield data from the study of Shrestha (2012) were used. The content of oil in the crop represents
the maximum amount of oil that could be extracted. In addition the extraction should be
[image:19.595.90.545.622.762.2]processed by solvent, since mechanical extraction will contribute 10% in the form of food.
Table 3: Biodiesel potential from the exported crops and oil in Russia, Ukraine and Belarus, 2015
Russian Federation Ukraine Belarus
Feedstock crop Rapeseed Sunflower Soybean Rapeseed Sunflower Soybean Rapeseed
Exported amount of
crop (kt) 2000 60 350 1416.5 0.789 1484 -
% of oil yield 48-52% 40-50% 17-25% 48-52% 40-50% 17-25% 48-52%
Export of
extracted oil (kt) 240 1446 415 152 4000 122 133
19
Conversion rate (L/t) 1082 1087 1080 1082 1087 1080 1082
Biodiesel
potential (106 l) 1342 1601 528 931 4348 468 144
Biodiesel potential
(ktoe) 1015.38 1211.75 403.36 704.59 3290.85 354.40 108.91
Share of TPES
per crop 0.15% 0.17% 0.06% 0.56% 2.62% 0.28% 0.39%
Share of TPES per
country 0.38% 3.47% 0.39%
Biodiesel potential (in litres) is estimated, using conversion rate that represents how
many litres could be produced from 1 tonne of extracted oil. In order to be able to measure the
contribution of biodiesel potential from the exported crops to the balance of TPES, we need to
convert litres to the tonnes of oil equivalent. First step is to transform volume of biodiesel to
the mass units of measure, using density, which is equal to 0.880 kg/L for biodiesel. Next step
is to evaluate the energy content by multiplying tonnes of biodiesel potential by 0.86 toe (1
t biodiesel = 0.86 toe). Because of unavailability of TPES data for year 2015, for an estimation
[image:20.595.89.539.446.578.2]of biodiesel share in the TPES, its average level for the last ten years was taken.
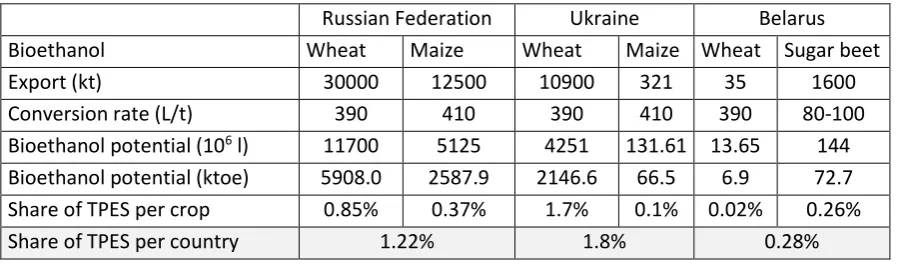
Table 4: Bioethanol potential from the exported crops in Russia , Ukraine and Belarus, 2015
Russian Federation Ukraine Belarus
Bioethanol Wheat Maize Wheat Maize Wheat Sugar beet
Export (kt) 30000 12500 10900 321 35 1600
Conversion rate (L/t) 390 410 390 410 390 80-100
Bioethanol potential (106 l) 11700 5125 4251 131.61 13.65 144
Bioethanol potential (ktoe) 5908.0 2587.9 2146.6 66.5 6.9 72.7
Share of TPES per crop 0.85% 0.37% 1.7% 0.1% 0.02% 0.26%
Share of TPES per country 1.22% 1.8% 0.28%
Similar analysis was done for the bioethanol production from the wheat, maize and
sugar beet. Exported amounts were converted to bioethanol potential in litres, based on the
rates from the Ukrainian Scientific Research Institute of Alcohol and study of Patni, Pillai and
Dwivedi (2013). Litres of bioethanol potential measured in units of mass are calculated, using
density of bioethanol- 0.789 kg/L. Energy content for bioethanol reaches 0.64 toe/t, which is
lower than for biodiesel. Than bioethanol potential, measured in kilo tonnes of oil equivalent
20 bioethanol per crop and country took into account average TPES during recent decade (see
[image:21.595.87.539.152.228.2]Table 3, 7, 13).
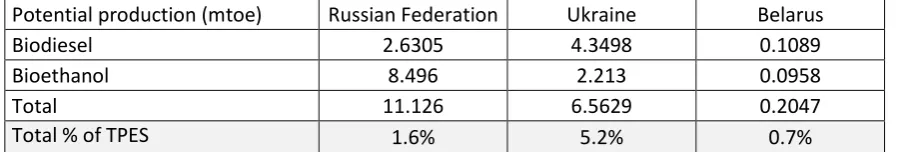
Table 20: Total bioethanol and biodiesel potential per country, 2015
Potential production (mtoe) Russian Federation Ukraine Belarus
Biodiesel 2.6305 4.3498 0.1089
Bioethanol 8.496 2.213 0.0958
Total 11.126 6.5629 0.2047
Total % of TPES 1.6% 5.2% 0.7%
Based on the estimation of biofuel potential from the exported crops, Ukraine has
highest revealed potential in the balance of TPES for both bioethanol and biodiesel among
three selected countries. It is leading in the potential production of biodiesel with the main
input from sunflower oil. In 2014 Ukraine has imported overall 34.4 mtoe of different types of
energy sources including natural gas (16 mtoe), coal (10.3 mtoe), oil products (8.2 mtoe), crude
oil (0.2 mtoe) and biofuels and waste (0.02 mtoe) (IEA, 2016). Based on provided estimations,
revealed potential of bioethanol and biodiesel would bring additional 5.27% to the TPES. Thus
Ukraine would be able to achieve approximately 7.1% of Biofuels and waste in the balance of
TPES including current share of 2014. In this regard Ukraine would reach highest share of
biofuels and waste in the energy balance among analysed countries. Average final consumption
of energy in the sector of transport from 2005 till 2014 was 12.7 mtoe (in 2014 - 10.3 mtoe).
In this regard approximately 6.6 mtoe of biofuels, which being exported in the form of crops,
could potentially cover almost half of needs in the transportation (51.7%) and substitute
imported energy sources.
Draft of Energy Strategy of Ukraine until 2035 created by National Institute for
Strategic Research, which targets were approved by NREAP, projects to reach 13.1 mtoe of
biofuels and waste in 2035 (see Table 11). Despite the fact that both drafts of ES are currently
being under discussion and awaiting for confirmation, we assume accepted ES would not differ
significantly from the existing drafts. Considering contribution to achievement of target
established in the ES: potential from exported feedstock would help country to reach 50% from
the 2035 objective. Taking into the account 2014 level of domestic production of biofuels and
waste (2.383 mtoe without net export) and investigated potential volumes, Ukraine would
manage to attain around 8.95 mtoe that account for 68% from the planned goal. Draft of ES
21 industry-6.9% from gross final consumption of 4.9 mtoe. In spite of feedstock availability,
implementation of settled targets would depend primarily on reduction of excise tax for
biofuels and its synchronization with European excise law.
Despite low contribution of analysed biofuel’s potential to TPES, Russian Federation
would gain from the exported feedstock 11.1 mtoe of biofuels in 2015, what is almost twofold
higher than Ukraine. However compared to the Ukraine, these volumes would not significantly
contribute to the Russian energy supply since their share would reach only 1.6%. Together with
current share of biofuels and waste in the balance of TPES it would provide 2.6% supply. Last
version of Energy Strategy until 2035 does not include a quantitative object for biofuels and
generally Russia does not have any obligations to accomplish in the sphere of renewables.
Apart from large-scale hydroelectricity, renewables in Russia are still in the early developing
phase. As confirmed by European Parliament report (Russia's domestic energy policy, 2016),
even if all planned projects to be implemented, share of renewables and therefore biofuels
would remain meagre. Thus involvement of exported feedstock potential won’t bring notable change into sector.
Belarusian potential in selected biofuels prevails in biodiesel production given by the
exported amounts of rapeseed oil. Investigated potential would provide balance of TPES with
only 1.09 mtoe of biodiesel and 0.96 mtoe of bioethanol (in total 0.7% of TPES). If share of
biofuels and waste remains the same as in 2014 (5.3%), Belarus would reach not less than 6%
by utilization of its potential from the exported feedstock. It will also lead Belarus to a decision
to reduce its energy sources imports by 2 mtoe (40.5 mtoe in 2014). Regarding energy needs
in transportation, the estimated amounts of biodiesel and bioethanol would cover around 50%
of needs in that sector (based on average energy consumption of 3.7 mtoe during period
2005-2014).
Strategy for energy potential development in Belarus established a target of 2 mt as a
minimum use of biodiesel and bioethanol by 2020. During analysis was revealed potential of
0.15 mt of bioethanol and 0.13 mt of biodiesel that would be enough to cover 14% of the
Strategy objective. In the view of 2014 production of liquid biofuels (0.28 mt) Belarus would
be able to reach 28% of its target by usage of exported raw materials domestically for further
biofuel extraction.
22 Nowadays growth of biofuel markets is considered to be strongly connected with
enacted biofuel policies, crude oil prices and macroeconomic environment. Table 5 summarize
policies established in the selected countries. .Based on the experience of biggest biofuel
producers, minimum mandatory share of biofuels in the transportation supported by tax reliefs
proved to be most efficient policies. None of three countries has settled mandates or any other
obligatory objectives in the sector. Besides none of analysed countries have a government body
that would track execution of biofuel market policies together with projects, financed by
government or foreign investments in the framework of international collaboration.
Meanwhile Ukraine, compared to others, has placed more powerful incentives; it has
the same impediment as Russia in the form of high excise tax for bioethanol. Recently Ukraine
was facing a dilemma: the government had been actively promoting biofuels and at the same
time price gap and high demand from EU has triggered increase in the rapeseed production for
the export. Therefore while low oil prices trend continues, export of raw materials abroad and
cheap import of energy sources is more profitable for Ukraine compared to development of
[image:23.595.86.534.431.586.2]biodiesel production.
Table 5: Biofuel policies applied in Russia, Ukraine and Belarus
Country Russia Ukraine Belarus
Regulatory policies
Feed -in tariff NA A NA
Biofuel obligations/mandate NA NA NA
Tradable REC NA NA NA
Standardisation A A A
Fiscal incentives and public financing
Capital subsidy/ grant A A A
Investment/
production tax credits NA A NA
Tax reliefs NA A A
*A – Applied, NA – Not Applied
If not for low oil prices environment, Belarussian and Ukrainian policy gaps may be
improved within current policy frameworks, whereas Russia may require the development of
new legislation approaches. Meanwhile EU had recently shifted their focus to the advanced
biofuels and in the nearest future will change their policies of no support for a food-based
alternative energy sources. In spite the fact, that EU had been major importer of feedstock for
biofuel production from Ukraine, Belarus and Russia, it inevitably will lead to the fall in
23 exported feedstock toward domestic conventional biofuel extraction sufficient for the early
development stage. However for Russia there is a chance to leapfrog directly to advanced
biofuels, since undertaken efforts proved to be incapable to integrate agricultural and energy
sectors. Growing demand of EU in biofuels followed by increasing amounts of imported wood
pellets keep Russia encouraged for the expanding production of solid biofuels. Russia became
third biggest importer of wood pellets to European countries, after USA and Canada (USDA,
GAIN Report, 2016). Meanwhile biodiesel and bioethanol could be interesting only in sense
of further export, usage in rural areas, reduction of GHG and diversity, what have never been
Russian focal points. Thus in the sphere of liquid biofuels Russia has never had clear objectives,
proposed incentives were not ambitious and probably remain the same based on the
government approach to related topics.
Ensuring energy security was considerable reason for the initial setup of biofuel policies
especially for Ukraine and Belarus. Development of biofuel and renewables in general will
have an impact on energy security of all three countries in various ways. Since they have vast
sources of feedstock for production of biofuels, the result will depend mainly on the oil prices,
policies and investments into R&D of new technologies. Meanwhile current low oil prices do
not favour short to the medium-term development of biofuels. In these circumstances questions
of energy security get lower priority. However in this environment is necessary to prevent risks
from long term point of view. From the perspective of security supply, main benefit of
development of biofuels is sustainable utilization of energy resources. That would ensure
supply of energy flows, including traditional sources and renewable, for a long period of time.
In the terms of security, energy balances of Ukraine and Belarus face bigger issues than
Russian. They are considerably volatile because oil and natural gas remain major imported
energy sources. Oil products provide up to 85% of energy consumption in transportation and
supply is focused in a few countries such as Russia with problematic economic and political
environment affecting their stability. Risk caused by vulnerable trade of traditional fuels had
already encouraged many countries to support of their own sector of biofuels through
regulatory and fiscal policy incentives. Belarus and Ukraine as well need to overcome their
energy dependence by expansion of biofuels industry in order to increase diversity, making
24
Conclusion
During last 15 years there have been waves of interest in biofuels as major producers
have been concerned by oil prices, sustainability, environmental impact and other global issues.
Many countries have intensively supported their biofuel’s industries with ambitions for higher energy security and mitigation of climate change. Their active expansion was prompted mainly
by efficient policies and incentives placed through whole supply chain from producer to the
consumer. Government policies have set floor for production and price of biofuels that remain
rather stable even in the low oil prices environment.
For some countries biofuels became universal solution to the range of national problems
from agricultural overproduction to the energy dependence on imported fuels. However for a
long time Russia had stayed aside from the global biofuel euphoria. Energy efficiency,
diversification and utilization of extensive agricultural commodities had encouraged Russia to
support alternative fuels despite vast naturally endowed energy sources. Significant availability
of feedstock, arable land and production capacities favor Russian intentions. In 2006 Russia
has joined biofuel development with numerous strategies, supportive programs and
international projects including subsidies from International Finance Corporation. Nonetheless
without any obligations and following sanctions, Russian government has proved its
incapability to accomplish developing incentives. Strong oil and gas lobby, that is closely
supported by government may play significant role in fulfillment of biofuel projects. Further
analysis has shown that huge feedstock potential for conventional biofuels won’t notably
contribute to the balance of total primary energy supply. Taking into account recent food
embargo followed by strong support of agricultural sector and economic crisis, Russia needs
to continue R&D and its intentions rather in advanced biofuels sphere then in conventional, in
order to have efficient diversification of energy sources and achieving settled goals.
Pushed by strong reliance on imported energy sources plans to join EU and fulfill Kyoto
protocol requirements; Ukraine has managed to implement biofuel policies and programs,
some of which actually proved to be efficient. As two other analyzed countries, Ukraine has
been exporter of biofuel feedstock to EU for a long period. But Ukrainian attention was paid
only to bioethanol production while ambitions in biodiesel industry did not succeed. Ukraine
has established considerable regulatory policies and fiscal incentives in the form of tax benefits
25 biofuels in the balance of TPES in 2014. But last changes in excise law in 2013 and further in
2015 have negatively affected Ukrainian biofuel sector and pushed industry into stagnation.
Based on estimations of Ukrainian exported feedstock, we came to the conclusion that
potential of exported raw materials would provide country with 50% from the targeted biofuels
share, planned in draft of Energy Strategy until 2035. Despite disadvantages of conventional
biofuels and global trend to shift to 2nd generation, potential from the available feedstock would be sufficient for the first development stage of the industry followed by expansion to advanced
biofuels energy. But low oil prices trend together with high excise tax rate hinder Ukraine from
expansion of the sector and accomplishment biofuels Strategy goal.
While Ukraine or Russia did not succeeded in the projects for biodiesel production,
Belarus has been developing only this type of liquid biofuel. Belarus same as Ukraine had also
struggled with critical level of dependence on imported energy. Biodiesel has been presented
in the balance of TPES from year 2008 and encouraged by State Program for the Production
of Biodiesel for the period 2007-2010. To support the market Belarus has also set tax reliefs,
nonetheless that were related only to producers. In spite of low rapeseed yield in 2010, weak
domestic demand and insufficient capacities of manufactures, volume of produced biodiesel
from Belarus remains stagnating and now is exported to EU. Reduction of imported energy is
among the priorities for increase the efficiency of Belarusian economy. Investigated potential
from exported biofuel and feedstock from Belarus would allow decrease imported energy by
5% and achieve 14% from objective of Strategy for energy potential development. However in
order to accomplish set targets of Strategy, Kyoto protocol and to deal with low energy security,
in the long-term Belarus would require revision of current policies and expansion of biofuel’s production capacities including bioethanol production.
If analyzed countries leave biofuel sector underdeveloped, they will have to face same
energy issues, whether in near future or later. But until oil prices stay on the low levels,
supportive policies would not be sufficient for the growth of young industry. While in
short-term biofuels could offer limited benefits and serious challenges for Russia, Ukraine and
Belarus, the potential for clean energy sources, country’s energy independence and efficiency
26
List of references
Akulova M., 2010. Belarusian yearbook. A survey and analysis of developments in the Republic of Belarus in 2010.[online] Minsk: Belarusian Institute for Strategic Studies; 2011. p. 286–95. [cit. 2016-12-17]. Available at:
http://belinstitute.eu/images/doc-pdf/YB%202010%20eng.pdf
APD German-Ukrainian Agricultural Policy Dialogue, 2016. [online]. IAMO. [cit. 2016-09-14]. Available at: https://www.iamo.de/en/research/projects/details/apd/.
Arbuzov, S., 2013. This year agrarian sector can become the leader taking into account investment volumes. [online]. Press service of first vice prime minister. [cit. 2016-08-14]. Available at: https://forua.wordpress.com/2013/06/04/arbuzov-agricultural-sector-can-become-leader-in-volumes-of-investments/.
Baklanova, J., 2007. Industrial production of bioethanol in Russia as one of the priority pathways of the development of alternative energy (in Russian). Regional Economy and Management, 4 (12). [cit. 2016-09-11]. Available at:
http://region.mcnip.ru/modules.php?name=News&file=article&sid=142
Bari D., 2014. Bio-based chemical industry: Challenges and opportunities.IHS Blogs. [cit. 2016-08-28]. Available at: http://blog.ihs.com/q12-bio-based-chemical-industry-challenges-and-opportunities
Barros S., 2015. Brazil: Biofuels Annual: Biofuels - Ethanol and Biodiesel [online]. USDA Foreign Agricultural Service: GAIN. [cit. 2017-08-3].
Blanco M., Adenauer M., Shrestha S., Becker A., 2013. Methodology to assess EU Biofuel Policies: The CAPRI Approach [online]. European Commission: Joint Research Centre. [cit. 2017-07-20]. ISSN 1831-9424. Available at: http://ftp.jrc.es/EURdoc/JRC80037.pdf
27 BP Statistical Review of World Energy, 2015. [online] ,[cit. 2016-08-29] Available at: bp.com/statisticalreview
Bushuev V. 2014, The Experience of Energy Strategy development in Russia. Institute for Energy Strategy [online]. [cit. 2016-11-17]. Available at: http://www.energystrategy.ru/press-c/source/Bushuev_ep-2-14.doc
Chakrabortty A., 2008. The global food crises [online]. Food and Agriculture Organization of the United Nations [cit. 2016-08-18]. Available at:
http://www.un.org/esa/socdev/rwss/docs/2011/chapter4.pdf
Climate Action Tracker: Ukraine. [online] Available at:
http://climateactiontracker.org/countries/developed/ukraine.html.
De Gorter, Just H. , 2008. “Water” in the U.S. Ethanol Tax Credit and Mandate:
Implications for Rectangular Deadweight Costs and the Corn-Oil Price
Relationship [online]. Department of Applied Economics and Management, Cornell University.
Demaree H., 2016. Russia anticipates record wheat harvest. World-grain.com. [cit. 2016-09-12]. Available at: http://www.worldgrain.com/articles/
Doku A., Di falco S., 2012. Biofuels in developing countries: Are comparative advantages enough? Energy Policy 44 101–117 [online]. [cit. 2016-11-23].
Eight Joint EU-Ukraine. (2016). [online]. European Commission. [cit. 2016-08-21]. Available at:
https://ec.europa.eu/energy/sites/ener/files/documents/20140320_mou_progress_report8_en.p df
Environmental consequences of the Chernobyl accident and their remediation: twenty years
of experience, 2006. Report of the UN Chernobyl Forum Expert Group ’Environment’
28
European Renewable Ethanol: State of the industry 2015 [online]. ePure, 2015 [cit. 2017-07-5]. Available at: http://epure.org/media/1215/epure_state_industry2015_web.pdf
Farkov A., 2016. Bez Nefti. Amic [online]. [cit. 2016-9-28]. Available at: http://www.amic.ru/news/320494/
Geletukha, G, Zeleznaya T., 2012. Mesto bioenergetiky v projekte obnovlennoj energeticheskoj strategii Ukrainy do 2030 goda. [online]. UABIO. [cit. 2016-08-15]. Available at: http://www.journal.esco.co.ua/industry/2013_5/art127_1.pdf
Geletukha, G, et. al.,2015. Analyses of energy strategies of EU and world countries and role of renewables in their energy systems. [online]. Bioenergy Association of Ukraine. [cit. 2016-09-2]. Available at: http://uabio.org/en/activity/uabio-articles/3075-bioenergy-strategies-part-2
Geletukha, G. (2012) Nuzen li Ukraine biogas? [online] Obozrevatel. [cit. 2016-09-3]. Available at: http://obozrevatel.com/author-column/73812-nuzhen-li-ukraine-biogaz.htm
Geletukha, G., et. al., 2006. Overview on Renewable Energy in Agriculture and Forestry in Ukraine . [online]. German – Ukrainian Agricultural Policy Dialogue. [cit. 2016-09-6]. Available at:
http://www.ier.com.ua/files/publications/Policy_papers/Agriculture_dialogue/2006/AgPP6_e n.pdf
GIZ. Ukraine, 2016. [online] [cit. 2016-09-21]. Available at: https://www.giz.de/en/worldwide/302.html .
Global trends in renewable energy investment 2016 [online]. Frankfurt School-UNEP Centre/BNEF. [cit. 2016-08-28]. Available at:
http://fs-unep-centre.org/sites/default/files/publications/globaltrendsinrenewableenergyinvestment2016lowr es_0.pdf
29 Greenfield Creditors Group, 2016. [online]. [cit. 2016-10-21]. Available at:
https://greenfieldcreditorsgroup.wordpress.com/
Intended Nationally Determined Contribution (INDC) of Ukraine to a New Global Climate Agreement, 2016. [online]. [cit. 2016-09-21]. Available at:
http://www4.unfccc.int/submissions/INDC/Published%20Documents/Ukraine/1/150930_Ukr aine_INDC.pdf.
International Energy Outlook 2016. U.S. Energy Information Administration (EIA) [online]. 2016, s. 290 [cit. 2016-05-14]. Available at: http://www.eia.gov/outlooks/ieo
International Energy Statistics: Biofuels Production [online]. Renewable Fuels Association, 2016 [cit. 2017-08-1]. Available at: http://www.afdc.energy.gov/data/10331
Joffe M., 2011. Problemy razvitija biotoplivnoj otrasli [online]. Gomel State Technical University [cit. 2016-07-2]. Available at: https://elib.gstu.by
Kaletnik G., Prutska O., Pryshliak N., 2014. Resource potential of bioethanol and biodiesel production in Ukraine. Visegrad Journal on Bioeconomy and Sustainable Development
[online]. [cit. 2016-10-12]. DOI: 10.2478/vjbsd-2014-0002. ISSN 1339-3367. Available at: http://www.degruyter.com/view/j/vjbsd.2014.3.issue-1/vjbsd-2014-0002/vjbsd-2014-0002.xml
Kalnitskaya J., 2013. Business opportunities in the bio-based economy in Ukraine [online].
ProMarketing Ukraine, 2013 [cit. 2016-10-19]. Available at:
http://www.biobasedeconomy.nl/wp-content/uploads/2011/08/BBE-Ukraine-study-2013-12-13.pdf
Kantamanemi, R.(2014), Executive Summary of Evaluation. International Finance Corporation. [online]. [cit. 2017-01-12]. Available at:
http://www.ifc.org/wps/wcm/connect/ced716804602cb75adf6bd9916182e35/Terminal+Eval uation+of+RSEFP.pdf?MOD=AJPERES
Karpov S., 2007. Current Aspects of Fuel Ethanol Production in Russia and
30 Katona, V., 2016. Realizing Russia's renewable energy potential in 2017. Russia Direct.
[online]. [cit. 2016-08-29]. Available at: http://www.russia-direct.org/opinion/realizing-russias-renewable-energy-potential-2017
Key Renewables Trends Excerpt form : Renewables information, 2016. International Energy Agency. [online]. [cit. 2016-05-14]. Available at:
https://www.iea.org/publications/freepublications/publication/KeyRenewablesTrends.pdf
Lane, J. Biofuels Mandates Around the World: 2016. Biofuels Digest [online]. 2016 [cit. 2016-06-29]. Available at: http://www.biofuelsdigest.com/bdigest/2016/01/03/biofuels-mandates-around-the-world-2016/
Malygina, K., 2013. The oligarchization of the Ukrainian energy sector under Victor Yanukovytsc 2010- 2012. [cit. 2016-10-12] UkraineAnalysen 112, 2-6.
Medvedkova I., Trudayeva, T., 2013. Biofuel market: problems and prospects. Mosty, vol. 6, no. 3.
Ministry of Agrarian Policy and Food [online]. [cit. 2016-10-12]. Available at: http://minagro.gov.ua/en/node/5529
Ministry of Agriculture Russia [online]. [cit. 2016-09-12]. Available at: http://www.mcx.ru/
Minnesota Biodiesel Program. Minnesota Department ofAgriculture [online]. [cit. 2016-07-28] Available at: http://www.mda.state.mn.us/renewable/biodiesel/aboutbiodiesel.aspx
National Agency of Investment and Privatization of Republic of Belarus, 2016. [online]. [cit. 2016-10-1]. Available at: www.investinbelarus.by/en/
National Statistical Committee of Republic of Belarus (2016) [online]. [cit. 2016-11-08]. Available at: http://www.belstat.gov.by/
31
O’Kray C., Wu K, 2010.Biofuels in China: Development Dynamics, Policy Imperatives, and Future Growth [online]. International Association for Energy Economics[cit. 2016-08-28]
Oilseeds: world markets and trade. USDA [online]. 2017 [cit. 2017-1-1]. Available at: http://usda.mannlib.cornell.edu/usda/current/oilseed-trade/oilseed-trade-01-12-2017.pdf
Osterkorn M., Lemaire X., Emerging market for Green Certificates. United Nations: Sustainable development knowledge platform [online]. 2008 [cit. 2017-07-3]. Available at: http://www.un.org/esa/sustdev/csd/csd15/lc/reep_emgc.pdf
Overview on Renewable Energy in Agriculture and Forestry in Ukraine, 2010 [online]. The Institute for Economic Research and Policy Consulting (IER) [cit. 2016-10-13]. Available at: http://www.ier.com.ua/ua/institute/about_institute
Parnell J. , 2012. Belarus threaten to leave Kyoto Protocol after Doha controversy. [online].
Climate Change News. [cit. 2016-9-29]. Available at:
http://www.climatechangenews.com/2012/12/11/kyoto-protocol-faces-more-walkouts-after-doha-controversy/
Patni N., Shibu G. Pillaji , Dwivedi A. Wheat as a Promising Substitute of Corn for Bioethanol Production, Procedia Engineering, Volume 51, 2013, Pages 355-362
Petro N., 2016. Why Ukraine needs Russia more than ever. The Guardian. [online]. [cit. 2016-09-25]. Available at: https://www.theguardian.com/world/2016/mar/09/ukraine-needs-russia-nicolai-petro
Pochemu Ukraina ne pochuvstvovala padenie mirovych cen na neft, 2016. [online] The Kiev tomes. [cit. 2016-09-10] Available at: http://thekievtimes.ua/economics/462068-pochemu-ukraina-ne-pochuvstvovala-padenie-mirovyx-cen-na-neft.html
Policies and measures: Ukraine. Green Tariff (Feed-in Tariff).2009. [online] International Energy Agency. [cit. 2016-09-17]. Available at: