How Far are We from Fully Automatic High Quality
Grammatical Error Correction?
Christopher Bryant
Department of Computer Science National University of Singapore
13 Computing Drive Singapore 117417
Hwee Tou Ng
Department of Computer Science National University of Singapore
13 Computing Drive Singapore 117417
Abstract
In this paper, we first explore the role of inter-annotator agreement statistics in grammatical error correction and conclude that they are less informative in fields where there may be more than one correct answer. We next created a dataset of 50 student essays, each corrected by 10 dif-ferent annotators for all error types, and in-vestigated how both human and GEC sys-tem scores vary when different combina-tions of these annotacombina-tions are used as the gold standard. Upon learning that even hu-mans are unable to score higher than 75% F0.5, we propose a new metric based on
the ratio between human and system per-formance. We also use this method to in-vestigate the extent to which annotators agree on certain error categories, and find that similar results can be obtained from a smaller subset of just 10 essays.
1 Introduction
Interest in grammatical error correction (GEC) systems has grown considerably in the past few years, thanks mainly to the success of the recent Helping Our Own (HOO) (Dale and Kilgarriff, 2011; Dale et al., 2012) and Conference on Natu-ral Language Learning (CoNLL) (Ng et al., 2013; Ng et al., 2014) shared tasks. Despite this increas-ing attention, however, one of the most significant challenges facing GEC today is the lack of a robust evaluation practice. In fact Chodorow et al. (2012) even go as far to say that it is sometimes “hard to draw meaningful comparisons between differ-ent approaches, even when they are evaluated on the same corpus.”
One of the reasons for this is that, tradition-ally, system performance has only ever been eval-uated against the gold standard annotations of a
single native speaker (rarely, two native speakers). As such, system output is not actually scored on the basis of grammatical acceptability alone, but rather is also constrained by the idiosyncrasies of the particular annotators.
The obvious solution to this problem would be to compare systems against the gold standard an-notations of multiple annotators, in an effort to di-lute the effect of individual annotator bias, how-ever creating manual annotations is often consid-ered too time consuming and expensive. In spite of this, while other studies have instead elected to use crowdsourcing to produce multiply-corrected an-notations, often concerning only a limited number of error types (Madnani et al., 2011; Pavlick et al., 2014; Tetreault et al., 2014), one of the main con-tributions of this paper is the provision of a dataset of 10 human expert annotations, annotated in the tradition of CoNLL-2014, that is moreover anno-tated for all error types.1
With this new dataset, we have, for the first time, been able to compare system output against the gold standard annotations of a larger group of human annotators, in a realistic grammar check-ing scenario, and consequently been able to quan-tify the extent to which additional annotators af-fect system performance. Additionally, we also noticed that some annotators tend to agree on cer-tain error categories more than others and so at-tempt to explain this.
In light of the results, we also explore how hu-man annotators themselves compare against the combined annotations of the remaining annotators and thus calculate an upper bound F0.5 score for
the given dataset and number of annotators; e.g., if one human versus nine other humans is only able to score a maximum of 70% F0.5, then it is
unrea-sonable to expect a machine to do better. For this reason, we propose a more informative method of
1http://www.comp.nus.edu.sg/˜nlp/sw/
10gec_annotations.zip
evaluating a system based on the ratio of that sys-tem’s F0.5score against the equivalent human F0.5
score.
Section 2 contains an overview of some of the latest research in both GEC and SMT that makes use of IAA statistics. Section 3 shows an example sentence from our dataset and qualitatively anal-yses how individual annotator bias affects their choice of corrections. Section 4 describes the data collection process and presents some preliminary results. Section 5 discusses the main quantitative results of the paper, formalizing the formulas used and introducing the more informative method of ratio scoring for GEC, while Section 6 summa-rizes the results from our additional experiments on category agreement and essay subsets. Section 7 concludes the paper.
2 Inter-Annotator Agreement (IAA)
Whenever we discuss multiple annotators, re-searchers invariably raise the issue of inter-annotator agreement (IAA), or rather the extent to which annotators agree with each other. This is because data which shows a higher level of agree-ment is often believed to be in some way more reli-able than data which has a lower agreement score. Within GEC, agreement has often been reported in terms of Cohen’s-κ(Cohen, 1960), although other agreement statistics could also be used.2
In the rest of this section, however, we wish to challenge the use of IAA statistics in GEC and question their value in this field. Specifically, while IAA statistics may be informative in areas where items can be classified into single, well-defined categories, such as in part-of-speech tag-ging, we argue that they are less well-suited to GEC and SMT, where there is often more than one correct answer. For example, two annotators may correct or translate a given sentence in two com-pletely different yet valid ways, but IAA statistics are only able to interpret the alternative answers as disagreements.
2.1 Inter-Annotator Agreement in GEC One important study that made use ofκas a mea-sure of agreement between raters is by Tetrault and Chodorow (2008) (also in Tetreault et al. (2014)), who asked two native English speakers to insert a missing preposition into 200 randomly chosen,
2See Hayes and Krippendorff (2007) or Artstein and Poe-sio (2008) for the pros and cons of different IAA metrics.
well-formed sentences from which a single prepo-sition had been removed.
Despite the simplicity of this correction task, the authors reportedκ-agreement of just 0.7, not-ing that in cases where the raters disagreed, their disagreements were often “licensed by context” and thus actually “acceptable alternatives”. This led them to conclude that they would “expect even more disagreement when the task is preposition er-ror detection in ’noisy’ learner texts” and, by ex-tension, imply that detection ofallerror types in ’noisy’ texts would show more disagreement still. The most important question to ask then, as a result of this study, is whether low κ-scores in ’noisy’ texts are truly indicative of real disagree-ment, or whether, as in this preposition test, the disagreement is actually the result of multiple cor-rect answers, and therefore not disagreement at all. In a related study, and aware of the fact that there are often multiple ways to correct individual words in sentence, Rozovskaya and Roth (2010) instead chose to compute agreement at the sen-tence level. Specifically, three raters were asked simply to decide whether they thought 200 sen-tences were correct or not.
This time, despite operating at the more gen-eral sentence level, the authors reported κscores of just 0.16, 0.4 and 0.23, surmising that “the low numbers reflect the difficulty of the task and the variability of the native speakers’ judgments about acceptable usage.” If that is the case, then true dis-agreement may be indistinguishable from native variability, and we should be wary of using IAA statistics as a measure of agreement or evaluation in GEC.
2.2 Inter-Annotator Agreement in SMT In fact, the issues regarding the reliability of IAA metrics are not unique to GEC and we can also draw a parallel with the field of statistical machine translation (SMT). In the same way that there is often more than one way to correct a sentence in GEC, it is also well known that there is often more than one way to translate a sentence in SMT.
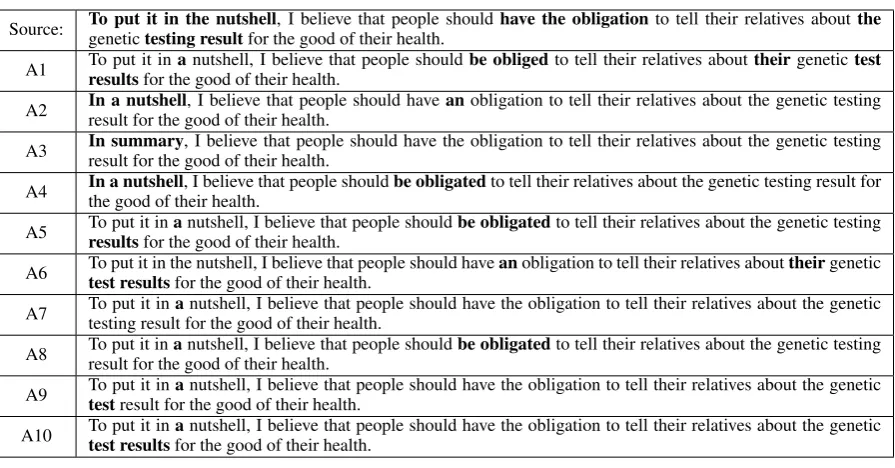
Source: To put it in the nutshellgenetictesting resultfor the good of their health., I believe that people shouldhave the obligationto tell their relatives aboutthe A1 To put it inresultsfor the good of their health.anutshell, I believe that people shouldbe obligedto tell their relatives abouttheirgenetictest A2 In a nutshellresult for the good of their health., I believe that people should haveanobligation to tell their relatives about the genetic testing A3 In summaryresult for the good of their health., I believe that people should have the obligation to tell their relatives about the genetic testing A4 In a nutshellthe good of their health., I believe that people shouldbe obligatedto tell their relatives about the genetic testing result for A5 To put it inresultsfor the good of their health.anutshell, I believe that people shouldbe obligatedto tell their relatives about the genetic testing A6 To put it in the nutshell, I believe that people should havetest resultsfor the good of their health. anobligation to tell their relatives abouttheirgenetic A7 To put it intesting result for the good of their health.anutshell, I believe that people should have the obligation to tell their relatives about the genetic A8 To put it inresult for the good of their health.anutshell, I believe that people shouldbe obligatedto tell their relatives about the genetic testing A9 To put it intestresult for the good of their health.anutshell, I believe that people should have the obligation to tell their relatives about the genetic A10 To put it intest resultsafor the good of their health.nutshell, I believe that people should have the obligation to tell their relatives about the genetic
Table 1: Table showing how each of the 10 annotators edited the same source sentence in Essay 25. The words in the source sentence that were changed are highlighted in bold.
This is in spite of the fact that the average inter-annotator κ score across all language pairs over the past five years has never been higher than 0.4 (Bojar et al., 2014).
One important paper that attempts to explain why IAA metrics score so poorly in SMT is by Lommel et al. (2014), who asked annotators to highlight and categorize sections of automatically translated text they believed to be erroneous. Their results showed that while annotators were often able to agree on the rough locations of errors, they often disagreed as to the specific boundaries of those errors: for instance, given the phrase “had go”, some annotators considered just the partici-ple “go”→“gone” to be the minimal error, while others considered the whole verbal unit, “had go”
→ “had gone”, to be the minimal error. Simi-larly, the authors also noted that annotators some-times had problems categorizing ambiguous errors which could be classified into more than one error category.
In short, while annotators already vary as to what they consider an error, these observations show that even when they do apparently agree, there is no guarantee that every annotator will de-fine the error in exactly the same terms. This poses a problem for IAA statistics, which rely on an ex-act match to measure agreement.
Finally, it is also worth mentioning that a related study, by Denkowski and Lavie (2010), suggested that “annotators also have difficulty agreeing with
themselves” (shown from intra-annotator agree-mentκ scores of about 0.6), and so we should be especially wary of using IAA metrics to validate datasets that may even be unreliable for a single annotator.
3 Annotator Bias
In an effort to better understand how annotators’ judgments might differ, we first carried out a small-scale qualitative analysis on a handful of random sentences corrected by the 10 human an-notators in our dataset. One such sentence, and all its various corrections, is shown in Table 1.
It is interesting to note that, for even as short an idiom as “To put it in the nutshell’, there are still multiple alternative edits. Although 8 out of the 10 annotators elected to replace the article “the” with “a”, among them, A2 and A4 also deleted “To put it” from the expression. Of the remaining 2 an-notators, A3 chose to replace the idiom entirely with “In summary”, while A6 made no correction at all. Although no correction appears to be un-acceptable to the majority of annotators, it is also not completely ungrammatical (just idiomatically awkward) so it may be that A6 has a higher tol-erance for this kind of error than the other anno-tators. Alternatively, there is also always the pos-sibility that, given such a large amount of text to correct, this error was simply overlooked.
verb “have the obligation” from active to passive, although A1 still disagreed with the others on the form of the participle. Similarly, there is also a great difference of opinion on whether “testing re-sult” should be corrected or not, and if so, how. While half of the annotators left the phrase un-changed, A1, A6, and A10 all changed both words to “test results”. Meanwhile, somewhere in be-tween, A5 decided to change “result” to “results”, but not “testing” to “test”, while, conversely, A9 decided to do the opposite. This would suggest that error correction of even minor phrases falls along a continuum governed by each annotator’s natural bias.
Finally, one of the most important results of this qualitative evaluation is that even though all 10 annotators edited the same sentence to a level they deemed grammatical, not one single annota-tor agreed with another exactly. This fact alone suggests IAA statistics are not a good way to eval-uate GEC data and that a more robust agreement metric must take into account the possibility of al-ternative correct answers.
4 Data Collection
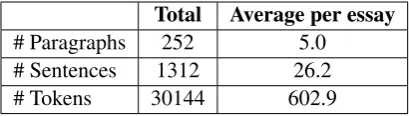
The raw text data in our dataset was originally pro-duced by 25 students at the National University of Singapore (NUS) who were non-native speakers of English. They were asked to write two essays on the topics of genetic testing and social media respectively. All essays were of similar length and quality. This was important because varying the skill level of the essays is likely to further affect the natural bias of the annotators, who may then consistently over- or under-correct essays. These raw essays also formed the basis of the CoNLL-2014 test data (Ng et al., CoNLL-2014). See Table 2 for some basic statistics on the resulting 50 essays.
The 10 annotators who annotated all 50 essays include: the 2 official annotators of CoNLL-2014, the first author of this paper, and 7 freelancers who were recruited via online recruitment website, Elance.3 All annotators are native British English
speakers, many of whom also have backgrounds in English language teaching, proofreading, and/or Linguistics.
All annotations were made using an online an-notation platform, WAMP, especially designed for annotating ESL errors (Dahlmeier et al., 2013). Using this platform, annotators were asked to
3http://www.elance.com
Total Average per essay # Paragraphs 252 5.0
[image:4.595.314.519.62.120.2]# Sentences 1312 26.2 # Tokens 30144 602.9
Table 2: Statistics for the 50 unannotated essays.
highlight a minimal error string in the source text, provide an appropriate correction, and then cate-gorize their selection according to the same 28-category error framework used by CoNLL-2014. Before commencing annotation, however, each annotator was given detailed instructions on how to use the tool, along with an explanation of each of the error categories. In cases of uncertainty, an-notators were also encouraged to ask questions.
As it was slightly harder to control the qual-ity of the 7 independently recruited annotators via Elance, they were each preliminarily asked to an-notate only the first two essays before being given detailed feedback on their work. The main pur-pose of this feedback was to make sure that they a) understood the error category framework, and b) knew how to deal with more complicated cases such as word insertions, punctuation, etc. Unless it was felt that they had overlooked an obvious er-ror in these first two essays, the feedback did not go so far as to tell annotators what they should and should not highlight in an effort to preserve indi-vidual annotator bias.
In all, while the specific time taken to complete annotation of all 50 essays was not calculated, all annotators completed the task over a period of about 3 weeks, at a rate of about 45 minutes per essay.
4.1 Early Observations
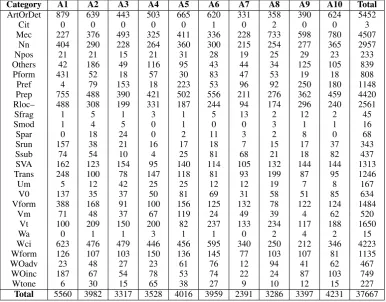
To investigate the extent to which different anno-tators have different biases, we first counted the total number of edits made by each annotator and sorted them by error category (Table 3).
As can be seen, there is quite a difference be-tween the annotator who made the most edits (A1) and the annotator who made the fewest edits (A7), with A1 making more than twice the number of edits as A7. This just goes to show how varied judgments on grammaticality can be. Incidentally, annotators A3 and A7, who are among those who made the fewest edits, were also the two official gold standard annotators in CoNLL-2014.
Category A1 A2 A3 A4 A5 A6 A7 A8 A9 A10 Total
ArtOrDet 879 639 443 503 665 620 331 358 390 624 5452
Cit 0 0 0 0 0 1 0 2 0 0 3
Mec 227 376 493 325 411 336 228 733 598 780 4507
Nn 404 290 228 264 360 300 215 254 277 365 2957
Npos 21 21 15 21 31 28 19 25 29 23 233
Others 42 186 49 116 95 43 44 34 125 105 839
Pform 431 52 18 57 30 83 47 53 19 18 808
Pref 4 79 153 18 223 53 96 92 250 180 1148
Prep 755 488 390 421 502 556 211 276 362 459 4420
Rloc– 488 308 199 331 187 244 94 174 296 240 2561
Sfrag 1 5 1 3 1 5 13 2 12 2 45
Smod 1 4 5 0 1 0 0 3 1 1 16
Spar 0 18 24 0 2 11 3 2 8 0 68
Srun 157 38 21 16 17 18 7 15 17 37 343
Ssub 74 54 10 4 25 81 68 21 18 82 437
SVA 162 123 154 95 140 114 105 132 144 144 1313
Trans 248 100 78 147 118 81 93 199 87 95 1246
Um 5 12 42 25 25 12 12 19 7 8 167
V0 137 35 37 50 81 69 31 58 51 85 634
Vform 388 168 91 100 156 125 132 78 122 124 1484
Vm 71 48 37 67 119 24 49 39 4 62 520
Vt 100 209 150 200 82 237 133 234 117 188 1650
Wa 0 1 1 3 1 1 0 2 4 2 15
Wci 623 476 479 446 456 595 340 250 212 346 4223
Wform 126 107 103 150 136 145 77 103 107 81 1135
WOadv 23 48 27 23 61 76 12 94 41 62 467
WOinc 187 67 54 78 53 74 22 24 87 103 749
Wtone 6 30 15 65 38 27 9 10 12 15 227
[image:5.595.106.493.63.365.2]Total 5560 3982 3317 3528 4016 3959 2391 3286 3397 4231 37667
Table 3: Table showing how many annotations each annotator made in terms of error category. See Ng et al. (2014) Table 1 for a more detailed description of error categories.
terms of category use, with almost half of all edits falling into the categories for article or determiner (ArtOrDet), spelling or punctuation (Mec), prepo-sition (Prep), or word choice (Wci) errors.
5 Quantitative Analysis
In the main phase of experimentation, we first in-vestigated how different numbers of annotators af-fected the performance of various systems in the context of the CoNLL-2014 shared task. To do this, we downloaded the official system output of all the participating teams4 and then the
Max-Match (M2) Scorer5 (Dahlmeier and Ng, 2012),
which was the official scorer of the previous CoNLL-2013 and CoNLL-2014 shared tasks.
This scorer evaluates a system at the sentence level in terms of correct edits, proposed edits, and gold edits, and uses these to calculate an F-score for each team. When more than one set of gold standard annotations is available, the scorer will calculate F-scores for each alternative
4http://www.comp.nus.edu.sg/˜nlp/
conll14st/official_submissions.tar.gz
5http://www.comp.nus.edu.sg/˜nlp/sw/
m2scorer.tar.gz
gold-standard sentence and choose the one from whichever annotator scored the highest. As in CoNLL-2014, we calculate F0.5, which weights
precision twice as much as recall, because it is more important for a system to be accurate than to correct every possible error. See (Ng et al., 2014) for more details on how F0.5is calculated.
5.1 Pairwise Evaluation
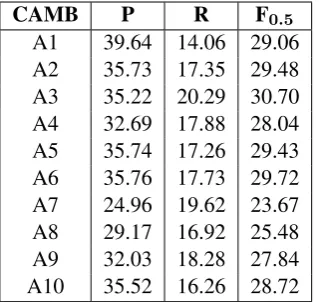
In order to quantify how much the F-score can vary in a realistic grammar checking scenario when there is only one gold standard annotator, we first computed the scores for a participating sys-tem vs each annotator in a pairwise fashion. Table 4 hence shows how the top team in CoNLL-2014, CAMB (Felice et al., 2014), performed against each of the 10 human annotators individually.
differ-CAMB P R F0.5 A1 39.64 14.06 29.06 A2 35.73 17.35 29.48 A3 35.22 20.29 30.70 A4 32.69 17.88 28.04 A5 35.74 17.26 29.43 A6 35.76 17.73 29.72 A7 24.96 19.62 23.67 A8 29.17 16.92 25.48 A9 32.03 18.28 27.84 A10 35.52 16.26 28.72
Table 4: Table showing the F0.5scores for the top
team in CoNLL-2014, CAMB, against each of the 10 annotators individually.
ence of over 7% F0.5 (A3 vs A7) and once again
shows how varied annotator’s judgments can be. 5.2 All Combinations
5.2.1 Human vs Human
Whereas previously we could only calculate F0.5
scores on a system vs human basis, when there are two or more annotators, we can also calculate scores on a human vs human basis. In fact, as the number of annotators increases, we can also start to calculate scores against different combinations of gold standard annotations.6
To give an example, since we have 10 annota-tors, a subset of these annotaannota-tors, say annotators a2–a8, could be chosen as the gold standard anno-tations. We could then evaluate how each of the re-maining annotators (i.e., annotator a1, a9, and a10) performs against this gold standard, by comput-ing the M2 score for annotator a1 against annota-tors a2–a8, annotator a9 against annotaannota-tors a2–a8, and annotator a10 against annotators a2–a8. We then average these 3 M2 scores, to determine how, on average, an annotator performs when measured against gold standard annotators a2–a8.
It is worth reiterating, however, that when more than one annotator is used as the gold standard, the M2 scorer will choose whichever annotator for the given sentence produces the highest F-score; i.e., if a2–a8 are the gold standard and we want to compute the F-score for a9, the M2 scorer will compute a9 vs a2, a9 vs a3, . . . , a9 vs a8 separately for each sentence, and choose the highest.
6Note that by combinations of annotators, we mean sim-ply that the M2 scorer has access to a larger number of alter-native gold standard corrections; we do not attempt to merge annotations in any way.
The above calculations can be formalized as Equation 1:
g(X) = 1
|A| − |X|
X
a∈A\X
f(a, X) (1)
whereAis the set of all annotators (|A| = 10in our case) andXis a non-empty and proper subset ofA, denoting the set of annotators chosen to be in the gold standard. The functionf(a, X)is the score computed by the M2 scorer to evaluate anno-tatoraagainst each set of gold standard annotators
X.g(X)is thus the average M2 scores for the re-maining annotators against the input gold standard combinationX.
So far, in our example, we have chosen anno-tators a2–a8 to be the gold standard. There are, however, many other different ways of choosing 7 annotators to serve as the gold standard. For exam-ple, we could have chosen{a1, a2, . . . , a7},{a1, a3, a4, . . . , a8}, etc. In fact, there are 107= 120 different combinations of 7 annotators. As such, we can also compute how an individual human an-notator performs when measured against any com-bination of 7 gold standard annotators, by averag-ing these 120 M2 scores. The above calculation is formalized in the general case in Equation 2:
hi = |1A| |X|
X
X:|X|=i
g(X) (2)
where ||XA|| is the binomial coefficient for |A|
choose|X|and1 ≤ i <|A|. The functiong(X) is defined in Equation 1.
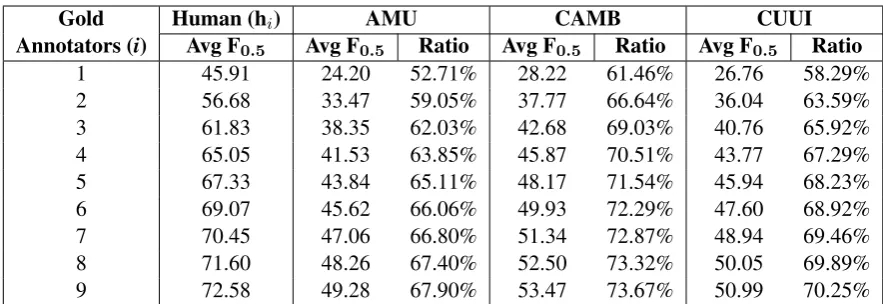
The resulting hi values are hence the average F0.5 scores achieved by any human against any
combination of i other humans, and so, in some ways, also represent the upper bound of human performance on the current dataset. The specific values forhi are shown in the second column of Table 5.
5.2.2 Caveat
Gold Human (hi) AMU CAMB CUUI
Annotators (i) Avg F0.5 Avg F0.5 Ratio Avg F0.5 Ratio Avg F0.5 Ratio
1 45.91 24.20 52.71% 28.22 61.46% 26.76 58.29%
2 56.68 33.47 59.05% 37.77 66.64% 36.04 63.59%
3 61.83 38.35 62.03% 42.68 69.03% 40.76 65.92%
4 65.05 41.53 63.85% 45.87 70.51% 43.77 67.29%
5 67.33 43.84 65.11% 48.17 71.54% 45.94 68.23%
6 69.07 45.62 66.06% 49.93 72.29% 47.60 68.92%
7 70.45 47.06 66.80% 51.34 72.87% 48.94 69.46%
8 71.60 48.26 67.40% 52.50 73.32% 50.05 69.89%
[image:7.595.77.519.60.212.2]9 72.58 49.28 67.90% 53.47 73.67% 50.99 70.25%
Table 5: Table showing average human F0.5scores over all combinations of1≤i <10gold annotators
compared to the same averages for the top 3 systems in CoNLL-2014, and the ratio percentage of each team’s average score versus the human average score.
equal to the total number of annotators. We only compute all combinations here in order to quan-tify, for the first time, how much each additional annotator affects performance.
5.2.3 System vs Human
In addition to calculating scores on a human vs human basis, we also calculated the F-scores for the top three CoNLL-2014 teams, AMU (Junczys-Dowmunt and Grundkiewicz, 2014), CAMB (Fe-lice et al., 2014), and CUUI (Rozovskaya et al., 2014), versus all the combinations of humans (Equation 3).
si = |1A| |X|
X
X:|X|=i
f(s, X) (3)
Specifically, s ∈ S, where S is the set of all three shared task systems, i.e., {AMU, CAMB, CUUI}, andf(s, X)is the same function in Equa-tion 1 which is the score computed by the M2 scorer to evaluate system sagainst the set of an-notatorsXchosen to be in the gold standard. The average F0.5 scores for each of the team’s systems
versus increasing numbers ofiannotators are also shown in Table 5.
We notice from these scores that, as expected, both system and human performance increases as more annotators are used in a gold standard. We do now, however, have data that quantifies exactly how much each additional annotator affects the score. This effect can be more clearly seen in Fig-ure 1.
It is important to note, however, that even with 9 annotators, human output itself does not reach close to 100% F0.5 and instead, the difference
be-tween the systems and the humans is about 20% F0.5. Furthermore, the curves for humans and
sys-tems also remain roughly parallel, suggesting hu-man corrections gain as much benefit as system corrections from larger sets of gold standard an-notations.
5.3 Ratio Scoring
In light of the above observation that even humans vs humans are unable to score 100% F0.5, it thus
seems unreasonable to expect machines to do the same. As such, we propose that it is much more informative to score system output against the av-erage performance of humans instead of against the theoretical maximum score. The ratio values for the three CoNLL-2014 teams against the hu-man gold standards of various sizes are hence also reported in Table 5. The most important thing to note is that these figures are not only much higher than the low F0.5 values currently reported in the
literature, they are also more representative of the state of the art. For instance, it is highly significant that we can report that the top system in CoNLL-2014, CAMB, is actually able to perform 73% as reliably as a human, which suggests GEC may ac-tually be a more viable technology than was pre-viously thought.
6 Additional Experiments
6.1 Error Categories
1 2 3 4 5 6 7 8 9 0
20 40 60 80 100
Number of Gold Standard Annotators F0.5
[image:8.595.78.289.63.280.2]Human AMU CAMB CUUI
Figure 1: Graph showing how average F0.5 scores
for humans and systems increase as the number of gold standard annotators also increases (all error types, 50 Essays).
single specific error type. Since the participating teams in CoNLL-2014 were not asked to classify the type of errors their systems corrected, we were only able to calculate these new values using the 10 sets of human annotations.
Like Figure 1, we can see from Figure 2 that the F0.5 performance of individual error types
in-creases diminishingly as the number of annotators in the gold standard also increases. More impor-tantly, however, we notice that some error types achieve much higher scores than others, which suggests some annotators agree on certain cate-gories more than others.
In particular, noun number (Nn) and subject-verb agreement (SVA) errors achieve the highest scores, at just under 90%F0.5, which is also not
far from the 100%F0.5 that would be achieved if
we had gold standard answers for all possible al-ternative corrections of this type. The most likely reason for this is that, as the correction of these error types typically only involves the addition or removal of an -s suffix, i.e., a minor change in number morphology, there is very little room for annotators to disagree.
In contrast, the next highest category, article and determiner errors (ArtOrDet), has a slightly larger confusion set, {the, a/an, }, which may account for the slightly lower score. Similarly, the next group of error categories, spelling and punctuation
1 2 3 4 5 6 7 8 9 0
20 40 60 80 100
Number of Gold Standard Annotators F0.5
Nn V t W Oinc
SV A W form W ci
ArtOrDet P rep
Mec T rans
Figure 2: Graph showing how average F0.5scores
for various error categories increase as the num-ber of gold standard annotators also increases (50 essays). Calculations based on human annotations only.
(Mec), verb tense (Vt), and word form (Wform), which all often involve a similar type of edit op-eration to a word lemma, likewise have slightly larger confusion sets that include a larger variety of possible morphological inflections. It is likely that the next category, prepositions (Prep), also has a confusion set of a similar size.
[image:8.595.311.528.64.342.2]1 2 3 4 5 6 7 8 9 0
20 40 60 80 100
Number of Gold Standard Annotators F0.5
[image:9.595.78.289.63.279.2]Human AMU CAMB CUUI
Figure 3: Graph showing how average F0.5 scores
for humans and systems increase as the number of gold standard annotators also increases (all error types, 10 Essays).
6.2 Essay Subsets
Now that we had empirical evidence showing how F0.5 scores varied with the number of annotators,
an additional question to ask was whether the same trends for 50 essays were also present in a smaller subset of essays. We therefore repeated the main experiment with all error types, but this time used just 10 essays (specifically, essays 1–10) in both the hypothesis and gold standard. The results are shown in Figure 3.
Compared to Figure 1, the most significant dif-ference between these two graphs is that the rank-ing for AMU and CUUI has changed, although not by much in terms of F0.5. The most likely reason
for this is that the distribution of error types in the smaller subset of essays is better suited to AMU’s more general SMT approach than to CUUI’s more targeted classifier based approach. For instance, see Table 9 in Ng et al. (2014) to compare each team’s performance on different error types in the CoNLL-2014 shared task.
In other words, while the overall relationship between the system and human scores on 10 and 50 essays remains more or less the same, re-searchers must be aware that smaller datasets may have more skewed error distributions, which in turn may affect system performance, dependent upon correction strategy. With a balanced test set though, it would seem feasible to carry out future
evaluation research on as few as 10 essays (about 6000 words).
7 Conclusion
To summarize, we first showed that 10 individual annotators can all correct the same sentence in 10 different ways, yet also all produce valid alterna-tives. This implies that inter-annotator agreement statistics, which rely on exact matching, are not well-suited to grammatical error correction, be-cause it may not be the case that annotators truly disagree, but rather that they have a bias towards a particular type of alternative answer.
We next showed that, as has long been sus-pected, increasing the number of annotators in the gold standard also leads to an increase in F0.5,
al-though at a diminishing rate. This data can be used to help researchers decide how many gold standard annotations should be used in GEC evaluation.
The main result of this paper however, is that by computing scores for human against human, we determined that it isnottrue that any human cor-rection is able to score 100% F0.5. Instead, we
found that the human upper bound is roughly 73% F0.5 and that the top 3 teams from CoNLL-2014
actually perform, on average, between 67-73% as reliably as this human upper bound. This result is highly significant, because it suggests GEC sys-tems may actually be more viable than their previ-ously low F0.5scores would suggest.
In addition to the above, we also found that hu-mans tend to agree on some error categories more than others, and suggest that one of the main rea-sons for this concerns the size of the confusion set of the particular error type.
Finally, not only are we making the corrections by 10 annotators of all 50 essays available with this paper, we also showed that the trends found in the data are also consistent with the annotations of just 10 essays, allowing future research to be conducted on much less text.
Acknowledgments
References
Ron Artstein and Massimo Poesio. 2008. Inter-coder agreement for computational linguistics. Computa-tional Linguistics, 34(4):555–596.
Ondrej Bojar, Christian Buck, Christian Federmann, Barry Haddow, Philipp Koehn, Johannes Leveling, Christof Monz, Pavel Pecina, Matt Post, Herve Saint-Amand, Radu Soricut, Lucia Specia, and Aleˇs Tamchyna. 2014. Findings of the 2014 Workshop on Statistical Machine Translation. InProceedings of the Ninth Workshop on Statistical Machine Trans-lation, pages 12–58, Baltimore, Maryland, USA, June. Association for Computational Linguistics. Martin Chodorow, Markus Dickinson, Ross Israel, and
Joel R. Tetreault. 2012. Problems in evaluating grammatical error detection systems. In COLING, pages 611–628.
Jacob Cohen. 1960. A coefficient of agreement for nominal scales. Educational and Psychological Measurement, 20(1):37–46.
Daniel Dahlmeier and Hwee Tou Ng. 2012. Better evaluation for grammatical error correction. In HLT-NAACL, pages 568–572.
Daniel Dahlmeier, Hwee Tou Ng, and Siew Mei Wu. 2013. Building a large annotated corpus of learner English: The NUS Corpus of Learner English. In
Proceedings of the Eighth Workshop on Innovative Use of NLP for Building Educational Applications, pages 22–31, Atlanta, Georgia, USA.
Robert Dale and Adam Kilgarriff. 2011. Helping Our Own: The HOO 2011 pilot shared task. In Pro-ceedings of the Generation Challenges Session at the 13th European Workshop on Natural Language Generation, pages 242–249.
Robert Dale, Ilya Anisimoff, and George Narroway. 2012. Helping Our Own: HOO 2012: A report on the preposition and determiner error correction shared task. In Proceedings of the Seventh Work-shop on Innovative Use of NLP for Building Educa-tional Applications, pages 54–62.
Michael Denkowski and Alon Lavie. 2010. Choos-ing the right evaluation for machine translation: an examination of annotator and automatic metric per-formance on human judgment tasks. Proceedings of AMTA.
Mariano Felice, Zheng Yuan, Øistein E Andersen, He-len Yannakoudakis, and Ekaterina Kochmar. 2014. Grammatical error correction using hybrid systems and type filtering. In Proceedings of the Eigh-teenth Conference on Computational Natural Lan-guage Learning: Shared Task, pages 15–24. Andrew F Hayes and Klaus Krippendorff. 2007.
An-swering the call for a standard reliability measure for coding data. Communication Methods and Mea-sures, 1(1):77–89.
Marcin Junczys-Dowmunt and Roman Grundkiewicz.
2014. The AMU system in the CoNLL-2014
shared task: Grammatical error correction by data-intensive and feature-rich statistical machine trans-lation. In Proceedings of the Eighteenth Confer-ence on Computational Natural Language Learn-ing: Shared Task, pages 25–33.
Arle Richard Lommel, Maja Popovic, and Aljoscha Burchardt. 2014. Assessing inter-annotator agree-ment for translation error annotation. In MTE: Workshop on Automatic and Manual Metrics for Op-erational Translation Evaluation.
Nitin Madnani, Philip Resnik, Bonnie J. Dorr, and Richard Schwartz. 2008. Are multiple reference translations necessary? Investigating the value of paraphrased reference translations in parameter op-timization. Proceedings of the Eighth Conference of the Association for Machine Translation in the Americas, October.
Nitin Madnani, Martin Chodorow, Joel R. Tetreault, and Alla Rozovskaya. 2011. They can help: Using crowdsourcing to improve the evaluation of gram-matical error detection systems. In Proceedings of the 49th Annual Meeting of the Association for Com-putational Linguistics, pages 508–513.
Hwee Tou Ng, Siew Mei Wu, Yuanbin Wu, Chris-tian Hadiwinoto, and Joel R. Tetreault. 2013. The CoNLL-2013 shared task on grammatical error cor-rection. InProceedings of the Seventeenth Confer-ence on Computational Natural Language Learn-ing: Shared Task, pages 1–12, Sofia, Bulgaria. ACL.
Hwee Tou Ng, Siew Mei Wu, Ted Briscoe, Christian Hadiwinoto, Raymond Hendy Susanto, and Christo-pher Bryant. 2014. The CoNLL-2014 shared task on grammatical error correction. InProceedings of the Eighteenth Conference on Computational Natu-ral Language Learning: Shared Task, pages 1–14, Baltimore, Maryland, USA. ACL.
Ellie Pavlick, Rui Yan, and Chris Callison-Burch. 2014. Crowdsourcing for grammatical error cor-rection. In Proceedings of the Companion Publi-cation of the 17th ACM Conference on Computer Supported Cooperative Work and Social Computing, CSCW Companion ’14, pages 209–212, New York, NY, USA. ACM.
Alla Rozovskaya and Dan Roth. 2010. Annotating ESL errors: Challenges and rewards. In NAACL Workshop on Innovative Use of NLP for Building Educational Applications, pages 28–36.
Matthew Snover, Bonnie Dorr, Richard Schwartz, Lin-nea Micciulla, and Ralph Weischedel. 2006. A study of translation error rate with targeted human annotation. In Proceedings of the Association for Machine Transaltion in the Americas.
Joel R. Tetrault and Martin Chodorow. 2008. Na-tive judgments of non-naNa-tive usage: Experiments in preposition error detection. InCOLING Workshop on Human Judgments in Computational Linguistics, pages 24–32, Manchester, UK.