Spatial structure of beta-amyloid Aβ
1-40
in complex
with a biological membrane model
Konstantin S. Usachev1*, Andrey V. Filippov1,2, Oleg N. Antzutkin2,3, Vladimir V. Klochkov1
1Kazan Federal University, Kazan, Russia; *Corresponding Author: [email protected] 2Luleå University of Technology, Luleå, Sweden
3Department of Physics, Warwick University, Coventry, UK
Received 13 October 2012; revised 15 November 2012; accepted 23 November 2012
ABSTRACT
The spatial structure of beta-amyloid Aβ1-40 in complex with sodium dodecyl sulfate micelles as a model membrane system was investigated by 1H-1H two-dimensional NMR (TOCSY, NOESY) spectroscopy and molecular dynamic method calculations. On the basis of NOE and chemical shifts changes data, spatial structure of the com- plex beta-amyloid-model of the cell surface me- mbrane was obtained.
Keywords: NMR; 1
H NMR; Two-Dimensional NMR (TOCSY, NOESY) Spectroscopy; Alzheimer’s Disease; Beta-Amyloid; Oligopeptides; Micelle
1. INTRODUCTION
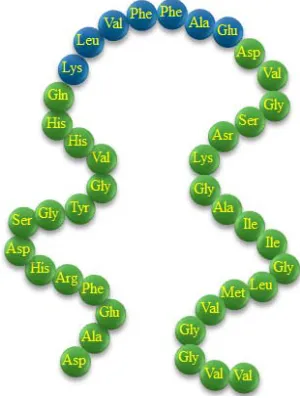
Alzheimer’s disease (AD) is a neurodegenerative sic- kness, which is characterized by the presence of amyloid plaques and neurofibrillar tangles in brain tissue. Produ- cts of enzymatic cleavage of a precursor peptide, amy- loid precursor protein (APP) [1] are small peptides, 39 - 43 amino acid residues in length, called amyloid Aβ- peptides. APP is a 695 - 770 residue transmembrane pro- tein which is found in all mammals. When APP is cleaved sequentially by α-, β-, and γ-secretases Aβ-pep- tides are produced. Among amyloid-β peptides, the most abundant Aβ1-40 species is the 40-amino-acid-long ver- sion (Figure 1), but several of the highly aggregation-
prone Aβ1-42 and Aβ1-43 are also present in amyloid plaques of AD patients. There is increasing proofs that prefibrillar intermediates and/or the fibrils themselves play a significant role in neurodegeneration [2-7].
[image:1.595.348.498.255.454.2]To discover medicines to prevent the development of AD, it may be necessary to understand the exact mecha- nism of amyloid Aβ-peptide aggregation. Interaction of amyloid peptides with the cellular membrane believed to be is one of the mechanisms for the neurotoxicity of amy-loid peptides [8,9]. Therefore, structural studies on Aβ1-40
Figure 1. Beta-amyloid Aβ1-40 amino acid
sequence (active fragment Aβ16-22 in blue balls).
bio-membrane systems are of intense interest. A discrip-tion of the spatial structure of the complex of Aβ1-40 with the membrane, would provide a fundamental under- standing of the mechanisms taking place on the cell sur- face and could lead to the discovery of inhibitors of se- nile plaque formation.
Micelles of sodium dodecyl sulfate (SDS) can be used for modeling the behaviour of these proteins on biolo- gical membranes for small hydrophobic proteins that form complexes linking directly with the micelle of SDS. Synthetic SDS micelles, like many biomembranes, have a negatively charged surface. This charge is also influ- enced by the critical micelle formation concentration (C- MC) of SDS.
2. EXPERIMENTAL
2.1. Materials
renylmethoxycarbonyl group and with reaction mixture conductivity control. Fmoc (9-fluorenylmethyloxycarbo- nyl groups)-protected amino acids of “peptide synthe- sis” grade were purchased from Applied Biosystems, Fo- ster City, CA, USA. Peptide synthesis was made using 0.1 mmol automated fast Fmoc solid phase procedure using HBTU (O-Benzotriazole-N, N, N’, N’-tetramethy- luronium-hexafluoro-phosphate) activation [10-12]. The procedure was performed on ABI 433A peptide synthe- sizer (Applied Biosystems, Foster City, CA, USA) at 293 K. Separation of the peptide substrate and the protecting groups was carried out in an acidic environment based on trifluoroacetic acid. The peptide was purified using high- performance liquid chromatography instrument Series 200 Perkin Elmer HPLC System, Waltham, MA, USA. Vydac 259VHP810 column (Grace, IL, USA) was used at 323 K, water-acetonitrile linear gradient, flow rate 4 mls/min and backpressure 1400 psi. Concentration of a- cetonitrile in the water-acetonitrile mixture for the target peptide desorption was around 15%. The quality of the final product was characterized using MALDI-TOF (Ma- trix-Assisted Laser Desorption-Ionization) mass spectro- metry. Purity of the peptide was estimated as better than 98%. The sample was lyophilized and stored at a tem- perature of 80˚C before usage.
The SDS micelle solution in H2O + D2O (90% + 10%) was prepared at a concentration of 5.72 g/l. The Aβ1-40 peptide was dissolved in the micelle solution immedi-ately before the NMR experiment.
2.2. NMR Data Acquisition and Processing
All data were acquired on a 500 MHz (1H) Bruker Avance II NMR spectrometer (Kazan Federal University NMR Laboratory).
2D NOESY and TOCSY spectra were acquired at 293 K. For each spectrum, 32 transients were collected using 16 dummy scans with spectral widths of 12 ppm in both dimensions, using 1024 complex points for F2 and 256 complex points for F1. All chemical shifts were measu- red from two-dimensional TOCSY spectra. The solvent signal was suppressed using 3-9-19 pulsesequence with gradients. NOESY data were collected with a mixing time of 100, 200, and 300 ms to derive 1H-1H distance constraints.
Spectra were processed using standard Bruker soft- ware (TOPSPIN, version 3.0) and analyzed with SPAR- KY. Sequence-specific backbone resonance assignments and side-chain assignments for all residues were obtain- ned using a combination of 2D TOCSY and NOESY ex- periments as described elsewhere [13,14].
Interproton distances obtained from analysis of inten- sities of cross-peaks from NMR NOESY spectra with tm variation were used as the primary data for the calcula-tions by molecular dynamics method in the XPLOR
pro-gram [15].
3. RESULTS
As a model of a biomembrane the system of Aβ1-40- SDS (in aqueous solution) was used. Micelle formation could be observed by 1Н NMR spectroscopy at an SDS concentration of more than 4.3 g/l.
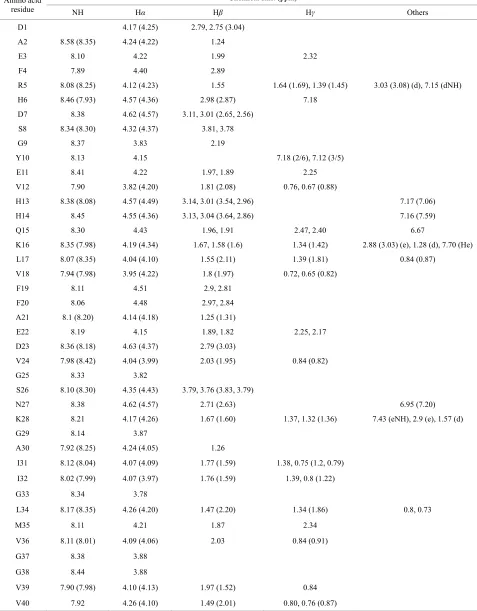
Using 2D NMR 1Н-1H TOCSY and NOESY experi- ments the chemical shifts of the beta-amyloid in the solu- tion of Н2О + D2O with SDS micelles (Table 1), and in the phosphate buffer aqueous solution, were determined. Comparing them, one can see a change in these values. The difference is probably due to changes in electrostatic environment brought about by the binding of the peptide to the micelle surface. To determine the interproton dis- tances which directly characterize the spatial geometry of peptide in solution, NMR NOESY spectra with varied mixing times (tm) were obtained.
To determine the spatial structure of beta-amyloid in a solution of Н2О + D2O with SDS the molecular dyna- mics method of the XPLOR program was used [15].
4. DISCUSSION
Chiefly there are two ways of proteins interaction with membranes: by simply permeating through the bilayer (in the case of integral peptides) and by forming a com- plex with lipids on the bilayer surface [1]. Modern NMR spectroscopy methods have been more widely used to study peptides interacting with micelles than the micelles/ lipids themselves.
The first studies of protein-membrane complexes by NMR spectroscopy were of amphiphilic peptides, such as melittin [16], a peptide from bee venom with 26 ami- no acid residues, and d-hemolysin, a small peptide from Staphylococcus aureus. Both of these peptides are in-clined to aggregate in aqueous solution [16,17].
Suitable models of cellular membranes for structural studies by NMR spectroscopy are micelles and micellar aggregates [18,19]. This has been shown in an NMR study (TOCSY, HSQC, HMBC, NOESY) of the spatial structure of a complex of the N-terminal domain of IIAGlc with micelles [20]. This peptide is predominantly disordered in water, consistent with previous data ob- tained in the absence of membranes. In detergent mice- lles of dihexanoylphosphatidylglycerol (DHPG) or SDS, however, residues Phe3-Val10 of the peptide adopt a helical conformation in the ensemble of structures calcu- lated on the basis of NOE-derived distance restraints.
Table 1. 1H NMR chemical shifts of the Aβ1-40 in a phosphate buffer solution and in a solution of Н2О + D2O with SDS. Т = 293 K. In brackets are shown data of chemical shifts for Н2О + D2O with SDS solution.
Chemical shift (ppm) Amino acid
residue NH Hα Hβ Hγ Others D1 4.17 (4.25) 2.79, 2.75 (3.04)
A2 8.58 (8.35) 4.24 (4.22) 1.24
E3 8.10 4.22 1.99 2.32 F4 7.89 4.40 2.89
R5 8.08 (8.25) 4.12 (4.23) 1.55 1.64 (1.69), 1.39 (1.45) 3.03 (3.08) (d), 7.15 (dNH) H6 8.46 (7.93) 4.57 (4.36) 2.98 (2.87) 7.18
D7 8.38 4.62 (4.57) 3.11, 3.01 (2.65, 2.56) S8 8.34 (8.30) 4.32 (4.37) 3.81, 3.78 G9 8.37 3.83 2.19
Y10 8.13 4.15 7.18 (2/6), 7.12 (3/5) E11 8.41 4.22 1.97, 1.89 2.25 V12 7.90 3.82 (4.20) 1.81 (2.08) 0.76, 0.67 (0.88)
H13 8.38 (8.08) 4.57 (4.49) 3.14, 3.01 (3.54, 2.96) 7.17 (7.06) H14 8.45 4.55 (4.36) 3.13, 3.04 (3.64, 2.86) 7.16 (7.59) Q15 8.30 4.43 1.96, 1.91 2.47, 2.40 6.67
K16 8.35 (7.98) 4.19 (4.34) 1.67, 1.58 (1.6) 1.34 (1.42) 2.88 (3.03) (e), 1.28 (d), 7.70 (He) L17 8.07 (8.35) 4.04 (4.10) 1.55 (2.11) 1.39 (1.81) 0.84 (0.87)
V18 7.94 (7.98) 3.95 (4.22) 1.8 (1.97) 0.72, 0.65 (0.82) F19 8.11 4.51 2.9, 2.81
F20 8.06 4.48 2.97, 2.84 A21 8.1 (8.20) 4.14 (4.18) 1.25 (1.31)
E22 8.19 4.15 1.89, 1.82 2.25, 2.17 D23 8.36 (8.18) 4.63 (4.37) 2.79 (3.03)
V24 7.98 (8.42) 4.04 (3.99) 2.03 (1.95) 0.84 (0.82) G25 8.33 3.82
S26 8.10 (8.30) 4.35 (4.43) 3.79, 3.76 (3.83, 3.79)
N27 8.38 4.62 (4.57) 2.71 (2.63) 6.95 (7.20) K28 8.21 4.17 (4.26) 1.67 (1.60) 1.37, 1.32 (1.36) 7.43 (eNH), 2.9 (e), 1.57 (d) G29 8.14 3.87
A30 7.92 (8.25) 4.24 (4.05) 1.26
I31 8.12 (8.04) 4.07 (4.09) 1.77 (1.59) 1.38, 0.75 (1.2, 0.79) I32 8.02 (7.99) 4.07 (3.97) 1.76 (1.59) 1.39, 0.8 (1.22) G33 8.34 3.78
L34 8.17 (8.35) 4.26 (4.20) 1.47 (2.20) 1.34 (1.86) 0.8, 0.73 M35 8.11 4.21 1.87 2.34
V36 8.11 (8.01) 4.09 (4.06) 2.03 0.84 (0.91) G37 8.38 3.88
G38 8.44 3.88
V39 7.90 (7.98) 4.10 (4.13) 1.97 (1.52) 0.84 V40 7.92 4.26 (4.10) 1.49 (2.01) 0.80, 0.76 (0.87)
rather conform to the native lipid bilayer. These vesicles have a quite large rotation correlation time, tc~4 × 10⁻⁶ s.
Long correlation times result in small times of trans- verse relaxation, Т2, with further broadening resonance signals in NMR spectra and increase of spin-diffusion in 1Н NOE experiments [22]. Short transverse relaxation
times, Т2, lead to loss of information in 2D NMR ex- periments (TOCSY, HSQC, HMBC, NOESY), which is required to identify resonance signals and to characterize the spatial structure of proteins in complexes [22,23]. Thus, such particle sizes are not suitable for 2D experi- ments, and therefore, structural studies based on analysis of intramolecular 1Н NOE are restricted to molecules of large molecular masses interacting with small micelles surfactants.
Surfactant molecules consist of hydrophobic and hy- drophilic parts. Polar chemical groups of these molecu- les are located on the micelle surface, whereas no polar chemical groups are concealed in the micelle center [19]. The CMC of a surfactant in solution is the minimal con- centration of the surfactant at which the system forms stable micelles.
In aqueous solution, micelles conduct like globular proteins containing around 60 amino acid residues with a rather small rotational correlation time (τc~5 × 10⁻⁸ s) [17]. After a protein-micelle complex formation, the mass of the particle increases, which may lead to slower tumbling of the peptide in the micelle-bound form; and now, the NOE method can be used [22,23].
Micelles of SDS form in water at a concentration of 8.1 mM [17].
Many proteins interact with SDS micelles at a weight ratio of 1.4 g of SDS to 1 g of peptide [20].
In our experiments, micelles of SDS were used as a model of a biomembrane at the concentrations of SDS under conditions of micelle formation in water, which were determined by 1Н NMR spectroscopy [14].
The positioning of Aβ in SDS was discussed in the study by Coles et al. [1] and later was supplemented by Jarvet et al. [24]. In the first work positioning was pro- duced with respect to the membrane spanning segment of the APP, and in the second—by NMR spectroscopy combined with using paramagnetic 5-doxyl fatty acids and Mn2+ ions. This result supported one of the hypo-thetic positioning models of the Aβ1-40 in complex with the SDS micelle. According to this data the central helix (residues 15 - 24) is significantly affected by 5-doxyl stearic acid however somewhat less for residues 16, 20, 22 and 23. Therefore this α-helix resides in the SDS headgroup region with the face with residues 16, 20, 22 and 23 directed away from the hydrophobic interior of the micelle [24]. This discus- sion inspired the present study. In our work by chemical shifts changes value, NOE data and molecular dynamics method calculations a
model of the Aβ1-40 in complex with the SDS micelle was obtained.
Comparing chemical shifts of the beta-amyloid in the solution of Н2О + D2O with SDS micelles (Table 1) and in the phosphate buffer aqueous solution, one can see a change in these values. The difference is probably due to changes in electrostatic environment brought about by the binding of the peptide to the micelle surface.
Moreover, in the 2D 1H-1H NOESY spectrum of the beta-amyloid in the solution of Н2О + D2O with SDS micelles a significant increase of well resolved cross- peaks was observed (Figure 2). The presence of nume-
rous well resolved cross-peaks in the NOESY spectra is an indication of increases in the mass of the particle, that is in our case, an indication of formation of a protein-mi- celle complex.
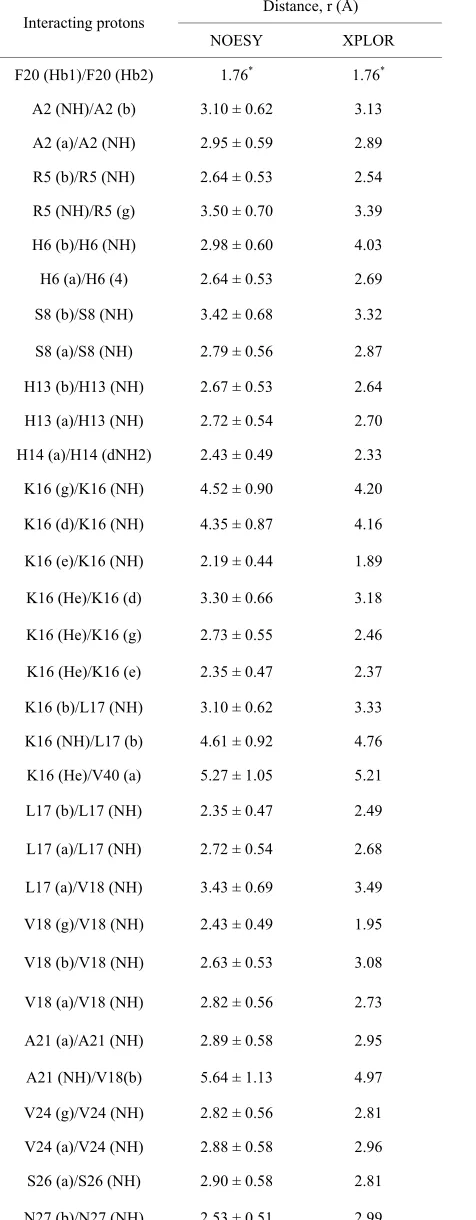
To determine the interproton distances, which directly characterize the spatial geometry of peptide in solution, NMR NOESY spectra with varied mixing times (tm) were obtained.
In Table 2, experimental interproton distances are pre-
sented. For calibration purposes, the intensity of the peak from the protons of the beta group of phenylalanine Phe20-(Hb1)-Phe20-(Hb2) was chosen. The distances be- tween these protons were determined by different tech- niques and calculated to be 1.76 Å.
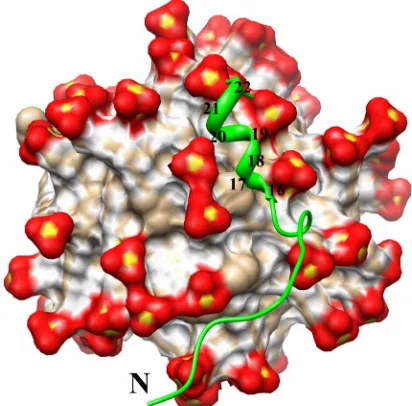
To determine the spatial structure of beta-amyloid in a solution of Н2О + D2O with SDS the molecular dyna- mics method of the XPLOR program was used [15]. These calculations allowed us to determine the most probable structure of conformer with the optimal struc- ture of the beta-amyloid (Figure 3).
A total of 57 intramolecular NOE distance constraints (Table 2) were determined for the structure calculations.
None of the ten structures have any violated NOE distan- ces.
On the basis of the fact that chemical shift changes of the beta-amyloid 1H NMR spectra were observed in phosphate buffer solution and in complex with SDS mi- celles, a potential orientation of the peptide with respect to the micelle surface is suggested. It can be assumed that amino acid residues with 1H chemical shifts changed to upfield, are directed away from the hydrophobic inte- rior of the micelle, which corresponds with a previous study [1,24-26].
Using the chemical shifts changes data and NOE data, together with the molecular dynamic calculations, a simulated structure of beta-amyloid Aβ1-40 in complex with a biological membrane model was obtained.
5. CONCLUSIONS
Table 2. Experimental interproton distances for the beta-amy-
loid Aβ1-40 in a solution of Н2О + D2O with SDS micelles.
Distance, r (Å) Interacting protons
NOESY XPLOR F20 (Hb1)/F20 (Hb2) 1.76* 1.76*
A2 (NH)/A2 (b) 3.10 ± 0.62 3.13 A2 (a)/A2 (NH) 2.95 ± 0.59 2.89 R5 (b)/R5 (NH) 2.64 ± 0.53 2.54 R5 (NH)/R5 (g) 3.50 ± 0.70 3.39 H6 (b)/H6 (NH) 2.98 ± 0.60 4.03 H6 (a)/H6 (4) 2.64 ± 0.53 2.69 S8 (b)/S8 (NH) 3.42 ± 0.68 3.32 S8 (a)/S8 (NH) 2.79 ± 0.56 2.87 H13 (b)/H13 (NH) 2.67 ± 0.53 2.64 H13 (a)/H13 (NH) 2.72 ± 0.54 2.70 H14 (a)/H14 (dNH2) 2.43 ± 0.49 2.33 K16 (g)/K16 (NH) 4.52 ± 0.90 4.20 K16 (d)/K16 (NH) 4.35 ± 0.87 4.16 K16 (e)/K16 (NH) 2.19 ± 0.44 1.89 K16 (He)/K16 (d) 3.30 ± 0.66 3.18 K16 (He)/K16 (g) 2.73 ± 0.55 2.46 K16 (He)/K16 (e) 2.35 ± 0.47 2.37 K16 (b)/L17 (NH) 3.10 ± 0.62 3.33 K16 (NH)/L17 (b) 4.61 ± 0.92 4.76 K16 (He)/V40 (a) 5.27 ± 1.05 5.21 L17 (b)/L17 (NH) 2.35 ± 0.47 2.49 L17 (a)/L17 (NH) 2.72 ± 0.54 2.68 L17 (a)/V18 (NH) 3.43 ± 0.69 3.49 V18 (g)/V18 (NH) 2.43 ± 0.49 1.95 V18 (b)/V18 (NH) 2.63 ± 0.53 3.08 V18 (a)/V18 (NH) 2.82 ± 0.56 2.73 A21 (a)/A21 (NH) 2.89 ± 0.58 2.95 A21 (NH)/V18(b) 5.64 ± 1.13 4.97 V24 (g)/V24 (NH) 2.82 ± 0.56 2.81 V24 (a)/V24 (NH) 2.88 ± 0.58 2.96 S26 (a)/S26 (NH) 2.90 ± 0.58 2.81 N27 (b)/N27 (NH) 2.53 ± 0.51 2.99
Continued
D23 (a)/D23 (NH) 2.81 ± 0.56 2.30 N27 (a)/N27 (gNH2) 4.22 ± 0.84 4.11 N27 (a)/N27 (NH) 2.97 ± 0.59 2.93 N27 (a)/A30 (NH) 5.30 ± 1.06 5.62 A30 (a)/A30 (NH) 2.95 ± 0.59 2.90 I31 (d)/I31 (NH) 4.27 ± 0.85 4.35 I31 (b)/I31 (NH) 3.70 ± 0.74 3.57 I31 (NH)/I32 (a) 5.11 ± 1.02 5.15 I31 (a)/I32 (NH) 2.80 ± 0.56 3.36 I32 (d)/I32 (NH) 3.95 ± 0.79 3.62 I32 (b)/I32 (NH) 2.60 ± 0.52 2.50 I32 (a)/I32 (NH) 2.84 ± 0.57 2.80 I32 (NH)/G33 (a) 5.05 ± 1.01 5.59 A30 (a)/I31 (NH) 2.96 ± 0.59 2.37 A30 (a)/I32 (NH) 3.18 ± 0.64 3.03 L34 (b)/L34 (NH) 2.50 ± 0.50 2.50 L34 (a)/L34 (NH) 2.82 ± 0.56 2.87 V36 (g)/V36 (NH) 2.91 ± 0.58 2.41 V36 (b)/V36 (NH) 2.62 ± 0.52 2.37 V36 (a)/V36 (NH) 2.95 ± 0.59 2.71 V39(a)/V39(NH) 2.96 ± 0.59 2.91 G37 (a)/V39 (NH) 3.95 ± 0.79 3.43 G37 (a)/V40 (NH) 3.26 ± 0.65 3.35 V39 (g)/V39 (NH) 3.78 ± 0.76 3.94 V40 (a)/V40 (NH) 2.93 ± 0.59 2.96
*is the calibrating distance.
membrane environment (sodium dodecyl sulfate micel- les).
To determine the spatial structure of beta-amyloid in a solution of Н2О + D2O with SDS the molecular dyna- mics method of the XPLOR program was used
On the basis of the fact that chemical shift changes of the beta-amyloid 1H NMR spectra were observed in pho- sphate buffer solution and in complex with SDS micel- les, a potential orientation of the peptide with respect to the micelle surface.
6. ACKNOWLEDGEMENTS
The work was supported by the Ministry of Education and Science of the Republic of Tatarstan (project No. 12-03-97040) and by the Minis-try of Education and Science of the Russian Federation (KFU, code 2.2792.2011).
(a) (b)
Figure 2. Fingerprint region of 2D NMR 1H-1H NOESY spectrum of beta-amyloid Aβ1-40: (a) in 20 mM phosphate buffer solution; (b) in solution Н2О + D2O with SDS micelles. Т = 293 K. Mixing time tm = 0.2 s.
REFERENCES
[1] Coles, M., Bicknell, W., Watson, A., Fairlie, D.P. and Craik, D.J. (1998) Solution structure of amyloid β-peptide (1-40) in a water-micelle enviroment. Is the membrane- spanning domain where we think it is? Biochemistry, 37, 11064-11077. doi: 10.1021/bi972979f
[2] Dahlgren, K.L., Manelli, A.M., Stine, W.B., Baker, L.K., Krafft, G.A. and LaDu, M.J. (2004) Oligomeric and fi-brillar species of amyloid-β peptides differentially affect neuronal viability. Journal of Biological Chemistry, 277,
32046-32053. doi: 10.1074/jbc.M201750200
[3] Lansbury, P.T. (1999) Evolution of amyloid: What normal protein folding may tell us about fibrillogenesis and dis- ease. Proceedings of National Academy Sciences of the USA, 96, 3342-3344. doi: 10.1073/pnas.96.7.3342
[4] Lansbury, P.T. (2002) Neurodegenerative disease: Amy- loid pores from pathogenic mutations. Nature, 418, 291.
doi: 10.1038/418291a
Figure 3. Simulated structure of beta-amyloid Aβ1-40 in
complex with a biological membrane model. [5] Petkova, A.T., Leapman, R.D., Guo, Z.H., Yau, W.M., Mattson, M.P. and Tycko, R. (2005) Self-propagating, molecular-level polymorphism in Alzheimer’s β-amyloid fibrils. Science, 307, 262-265.
doi: 10.1126/science.1105850
of J.C. and Seth M. Kempe for grants, from which equipment for the peptide synthesis and purification has been purchased. We also ac-knowledge Dr. S. Afonin for electrospray mass-spectrometry analysis of the peptide.
[image:6.595.69.275.448.651.2]Journal of National Institutes of Health, 7, 57-64.
[7] Walsh, D.M., Klyubin, I., Fadeeva, J.V., Cullen, W.K., Anwyl, R., Wolfe, M.S., Rowan, M.J. and Selkoe, D.J. (2002) Naturally secreted oligomers of amyloid protein potently inhibit hippocampal long-term potentiation in vivo. Nature, 416, 535-539. doi: 10.1038/416535a
[8] Aisenbrey, C., Borowik, T., Byström, R., Bokvist, M., Lindström, F., Misiak, H., Sani, M.A. and Gröbner, G. (2008) How is protein aggregation in amyloidogenic dis- eases modulated by biological membranes? European Biophysics Journal, 37, 247-255.
doi: 10.1007/s00249-007-0237-0
[9] Gehman, J., O’Brien, C., Shabanpoor, F., Wade, J. and Separovic, F. (2008) Metal effects on the membrane in-teractions of amyloid-β peptides. European Biophysics Journal, 37, 333-344. doi: 10.1007/s00249-007-0251-2
[10] Jones, J. (2002) Amino acid and peptide synthesis. Ox-ford University Press, New York, 92.
[11] Filippov, A. (2010) Synthesis and aggregation studies on amyloid oligomers of Alzheimer’s abeta peptides. Lulea University of Technology, Lulea, 26.
[12] Merrifield, R.B. (1963) Solid phase peptide synthesis. I. The synthesis of a tetrapeptide. Journal of the American ChemicalSociety, 85, 2149-2154.
doi: 10.1021/ja00897a025
[13] Wuthrich, K. (1986) NMR of proteins and nucleic acids. Wiley-VCH, New York, 1-292.
[14] Blokhin, D.S., Efimov, S.V., Klochkov, A.V., Yulmetov, A.R., Filippov, A.V., Antzutkin, O.N., Aganov, A.V. and Klochkov, V.V. (2011) Spatial structure of the decapep- tide Val-Ile-Lys-Lys-Ser-Thr-Ala-Leu-Leu-Gly in water and in a complex with sodium dodecyl sulfate micelles.
Applied Magnetic Resonance, 41, 267-282.
doi: 10.1007/s00723-011-0257-x
[15] Schwieters, C.D., Kuszewski, J.J., Tjandra, N. and Clore, G.M. (2003) The Xplor-NIH NMR molecular structure determination package. Journal of Magnetic Resonance,
160, 65-73. doi: 10.1016/S1090-7807(02)00014-9
[16] Smith, R., Separovic, F., Milne, T.J., Whittaker, A., Ben- nett, F.M., Cornell, B.A. and Makriyannis, A. (1994) Structure and orientation of the pore-forming peptide me- littin, in lipid bilayers. Journal of Molecular Biology, 241,
456-466. doi: 10.1006/jmbi.1994.1520
[17] Henry, G.D. and Sykes, B.D. (1994) Methods to study membrane protein structure in solution. Method in Enzi-
mology, 239, 515-535.
doi: 10.1016/S0076-6879(94)39020-7
[18] Lee, K.H., Fitton, J.E. and Wüthrich, K. (1987) Nuclear magnetic resonance investigation of the conformation of δ-haemolysin bound to dodecylphosphocholine micelles.
Biochimica et Biophysica Acta (BBA)—Protein Structure and Molecular Enzymology, 911, 144-153.
doi: 10.1016/0167-4838(87)90003-3
[19] Motta, A., Pastore, A., Goud, N.A. and Castiglione Mo- relli, M.A. (1991) Solution conformation of salmon cal- citonin in sodium dodecyl sulfate micelles as determined by two-dimensional NMR and distance geometry calcula- tions. Biochemistry, 30, 10444-10450.
doi: 10.1021/bi00107a012
[20] Wang, G., Keifer, P. and Peterkofsky, A. (2003) Solution structure of the N-terminal amphitropic domain of Es- cherichia coli glucose-specific enzyme IIA in mem- brane-mimetic micelles. Protein Science, 12, 1087-1096.
doi: 10.1110/ps.0301503
[21] Marcotte, I. and Auger, M. (2005) Bicelles as model membranes for solid- and solution-state NMR studies of membrane peptides and proteins. Concepts in Magnetic Resonance Part A,24A, 17-37. doi: 10.1002/cmr.a.20025
[22] Ernst, R.R., Bodenhausen, B. and Wokaun, A. (1987) Principles of nuclear magnetic resonance in one and two dimensions. Oxford University Press, Oxford, 610. [23] Berger, S. and Braun, S. (2004) 200 and more NMR
ex-periments. Wiley-VCH, Weinheim, 810.
[24] Jarvet, J., Danielsson, J., Damberg, P., Oleszczuk, M. and Gräslund, A. (2007) Positioning of the Alzheimer Aβ(1-40) peptide in SDS micelles using NMR and paramagnetic probes. Journal of Biomolecular NMR, 39, 63-72.
doi: 10.1007/s10858-007-9176-4
[25] Vivekanandan, V., Brender, J.R., Lee, Sh.Y. and Rama-moorthy, A. (2011) A partially folded structure of amy- loid-beta(1-40) in an aqueous environment. Biochemical and Biophysical Research Communications, 411, 312-316.
doi: 10.1016/j.bbrc.2011.06.133
[26] Usachev, K.S., Efimov, S.V., Yulmetov, A.R., Filippov, A.V., Antzutkin, O.N., Afonin, S. and Klochkov, V.V. (2012) Spatial structure of heptapeptide Abetha(16-22) (beta- amyloid Abetha(1-40) active fragment) in solution and in complex with a biological membrane model.
Magnetic Resonance in Chemistry, 50, 784-792.
ABBREVIATIONS AND ACRONYMS
The following abbreviations were used in text: AD—Alzheimer’s Disease.APP—Amyloid Precursor Protein. CMC—Critical Micelle Formation. DHPG—Dihexanoylphosphatidylglycerol. Fmoc—9-fluorenylmethyloxycarbonyl groups.
HBTU—O-Benzotriazole-N, N, N’, N’-tetramethyl-uro- nium-hexafluoro-phosphate.
HSQC—Heteronuclear Single Quantum Coherence Spec- troscopy.
HMBC—Heteronuclear Multiple Bond Correlation. MALDI-TOF (Matrix-Assisted Laser Desorption-Ioniza- tion) mass spectrometry.
NMR—Nuclear Magnetic Resonance.
NOESY—Nuclear Overhauser Effect Spectroscopy. SDS—Sodium dodecyl sulfate.