Munich Personal RePEc Archive
Estimating recreational values of coastal
zones
Halkos, George and Matsiori, Steriani
Department of Economics, University of Thessaly , Department of
Ichthyology and Aquatic Environment, University of Thessaly
August 2017
Online at
https://mpra.ub.uni-muenchen.de/80911/
1
Estimating recreational values of coastal zones
George Halkos
1and Steriani Matsiori
2Abstract
The present study tries to improve our understanding of why some people value coastal zone using attitudinal and preference factors in a Contingent Valuation Method (CVM) study. Specifically, it aims at public preferences for improving the quality (protection) of Pagasitikos coastal area in Greece and explores the influence of environmental attitude on preference to people’s willingness to pay (WTP) coastal zone conservation. It also presents the results of a discrete CVM survey which investigates households’ WTP for a set of wetland attributes. The proposed approach uses applied methodological methods like Principal Components and Cluster Analyses together with logistic regression. Various demographic variables (as education and income) together with people’s preferences for coastal zone show a strong impact on WTP and the specific amounts stated. At a second stage people who accept the CVM scenario results and grouped into two segments, with different attitude against coastal zone management and ecological view.
Keywords: Environnemental attitudes; NEP scale; CVM; WTP; coastal zone people perception.
JEL classifications: C10; C52; Q20; Q51; Q57.
1 Laboratory of Operations Research, Department of Economics, University of
Thessaly, 28hs Octovriou 78, Volos 38333, Greece, Tel: 00302421074920, Fax: 00302421074772 , E-mail: halkos@uth.gr
2 Department of Ichthyology and Aquatic Environment, School of Agricultural Sciences, University of Thessaly, Volos Greece, Tel: 00302421093251, E-mail:
2
1. Introduction
Coastal zone is a very important area source because it provides a significant
number of products and services with high economic values while people live, work
and recreate there (Costanza et al. 1997; Ledoux and Turner 2002). On the other
hand, the water quality reduction and people’s activities on coastal zone have as a
result the loss of marine biodiversity, habitats and other services provided by marine
and coastal zones (Halkos 2011a,b; Halkos and Jones 2012). Nowadays marine
policies need the use of cost benefit analysis and by extension environmental
valuation (Hanley et al. 2015). For the purpose of effective management of coastal
and marine resources, it is essential to integrate the total economic value of those
resources to decision-making processes (Birol et al. 2006).
Over the years a significant number of studies are interested in people’s
willingness to pay (hereafter WTP) for coastal zone ecosystem services. The natural
ecosystem services valuation handle the problems of a better understanding of
socio-ecological system complexity (Luisetti et al. 2014). Therefore, research on coastal
zone valuation many times focuses on people’s preferences towards its utility and as a
way to manage environmental and development issues to attain sustainable
development (Tran et al. 2002).
The Contingent Valuation Method (hereafter CVM) is based on individual
preferences aiming to maximize their utility under their income constraint or to reduce
their expenditures underlying a utility constraint (Spash 2006). With the years the use
in CVM models of psychological or attitudes variables was considered essential if we
want to improve results’ quality (Harris et al. 1989; Mitchell and Carson 1989;
Ndebelea and Forgiec 2017). As a consequence, CVM studies were designed in the
3
The goal of our study is to measure the strength of people's preference and
environmental attitude in terms of their WTP for coastal zone quality improvement.
Specifically, it is explored if environmental attitudes are a significant motive for the
behavioral intention of WTP and how people's preferences, opinions, and knowledge
influence their behavior. In these lines, the causal method is considered at the
parameter level and the effect of individuals' attitude against the coastal zone utility
on the causal method is clarified.
Our research addresses several questions like whether there is a significant
NEP scale–WTP relationship and whether the impact of differing demographic and
socio-economic people's characteristics are important in a CVM study. The
association between NEP scale and WTP has been proved in the literature, however,
there are studies claiming that this relationship may not be important. Despite trying
to calculate an economic value for the coastal area we do not have this as a goal, but
to analyze the public preferences revealed through CVM responses. Then we try to
segment respondents who said yes to CVM scenario into their respective preference
groups based on individuals’ motives to pay for coastal zone quality improvement.
Our study also contributes to existing knowledge in a number of ways. First,
the findings contribute to the debate for the relationship between environmental
attitudes and WTP and if NEP scale is an explanatory factor of this. We explore if the
differences in attitudes for coastal zone utility can be accounted simultaneously with
their underlying preferences. Secondly, it extends the ecosystem services valuation
literature available regionally and internationally. Our results give a useful tool to
decision makers and government agencies to plan possible coastal management
4
contribute to discussions about motives behind people’s decision to value
economically natural ecosystems.
The structure of the paper is as follows. Section 2 reviews the existing relevant
literature while section 3 introduces the study area, the valuation approach, the
attitudinal questions and the survey process. Section 4 presents the results of WTP
analysis and the multi-criteria analysis for having a better view of people’s
preferences. Section 5 discusses and presents the management implications of the
empirical findings with the last section concluding the paper.
2. Relevant literature examining public attitudes to ecosystem’s valuation
CVM studies are faced with the problem of population heterogeneity in
characteristics and preferences (Choi and Fielding 2013) with the reliability of CVM
studies’ results depending on how researchers manage this heterogeneity (Hensher et
al. 2005; Louviere 2001) using a variety of explanatory variables. The main
categories of these variables are socio-demographic and attitudinal characteristics
(Choi and Fielding 2013). Therefore attitudinal questions and psychometric measures
are used into valuation models (Boxall and Adamowicz 2002; Brown et al. 1996;
Cooper et al. 2004; Hanley and Craig 1991; Kahneman et al. 1993; Kotchen and
Reiling 2000; Stern et al. 1995; Halkos and Matsiori 2012; Dietz et al. 2005; Hoyos et
al. 2015).
According to the literature attitudes and beliefs influence people in paying (or
not) for protecting the environment (Franco and Luiselli 2014; Johnson et al. 2004;
Pouta 2004; Spash 2000; Stern and Dietz 1994). Bartczak (2015) reveals that the
greater part of the literature on non-economic motives of WTP for environmental
5
interested in this relationship (among others Aldrich et al. 2007; Cooper et al. 2004;
Kang et al. 2012; Kotchen and Reiling 2000; Meyerhoff 2006).
The need for this research is that people’s attitudes should influence their
behavior in the frame of a CVM study revealing unobserved preference heterogeneity
(McFadden and Train, 2000). Attitude questions are used for segmentation of
participants to the survey (Halkos and Matsiori 2012, 2016; Choi 2011; Morey et al.
2006; Scarpa and Menzel 2005; Winter 2005) or as explanatory variables of economic
models (Ben-Akiva et al. 1999; Boxall and Adamowicz, 2002; Vredin Johansson et
al. 2006). On the other hand, there are many attempts to investigate the importance of
knowledge and familiarity in affecting people’s WTP for protection (Ackerberg 2003;
Wilson and Tisdell 2005; Tisdell and Wilson 2007; LaRiviere et al. 2014)
A very famous and most widely used measure (Dunlap 2008) of people’s
relationship between humans and the environment is the New Ecological Paradigm
(NEP scale) which was developed by Dunlap et al. (2000). NEP scale was used as an
explanatory variable and predictor of mean WTP in many studies which estimate the
economic value of natural ecosystems. For instance, Kotchen and Reiling (2000) and
Aldrich et al. (2007) accounted an important part of environmental attitudes
(measured by NEP scores) as a determinant of mean WTP estimates for the
endangered species protection. NEP scale also has been used in many surveys for
economic valuation of water resources quality improvement (Cooper et al. 2004;
Halkos and Matsiori 2012).
There are many studies using public surveys to explore public attitudes,
preferences and awareness to coastal zone protection (Whitmarsh et al. 2009; Brody
6
human environmental perceptions providing a tool for protecting and rationally
managing the environment.
Several coastal zones researchers focused in economic value of coastal
recreation through (Beharry-Borg et al. 2009): a) quality changes of area’s
characteristics which are not connected to water quality (Silberman and Klock 1988;
Parsons et al. 2000; Hanley et al. 2003; Landry et al. 2003; Ostberg et al. 2012) and
b) changes connected to water quality (Vaughn et al. 1985; Bockstael et al. 1987;
McGonagle and Swallow 2005; Petrolia and Kim 2009; Voke et al. 2013).
A part of researches was conducted in tourist areas aiming to investigate
preferences for beach use with samples consisted of residents and visitors of the area
(Beharry-Borg and Scarpa 2010; Hess and Beharry-Borg 2012; Nunes and Van Den
Bergh 2004; Halkos and Matsiori 2012; Zhang et al. 2015). On the other hand, there
are studies focused only to non-residents users of the coastal zone (Cook 2000;
Blakemore and Williams, 2008; Castaño- Isaza et al. 2015; Jones et al. 2011).
Finally, there are studies focusing on the deferential behavior between residence and
those that travelled to visit the site (Prayaga 2017).
In Greece, to our knowledge, there is not significant number of previous
studies measuring benefits associated with people’s preferences and environmental
attitudes and their WTP for coastal zone quality improvement. Some studies focusing
on economic valuation of coastal zones are those of Jones et al. (2008), Organtzi et al.
7
3. Study area and survey design
A CVM survey was carried out to residents of Volos city. Volos is a coastal
port city in Thessaly located in the middle of the Greek mainland along the
Pagasitikos Gulf. The lengthy (56 km) coastline of Volos offers attractive seaside
secure for swimming with high quality of waters. On the contrary, Volos port is the
third commercial port of Greece with human activities causing serious environmental
problems. For these reasons sometimes the conflict uses of coastal zone makes
necessary the economic valuation of those and the decision for the management of the
area in the frame of a cost-benefit analysis. Halkos and Matsiori (2012) attempted to
understand the motivations behind WTP for Pagasitikos coastal quality, including an
individual’s perceived importance of environmental protection
Our primary research was carried out on a total sample of 400 randomly
selected people. The survey was designed according to the principles of a CVM
survey with the sample chosen randomly with personal interviews and using a
questionnaire designed and tested according to guidelines established by the NOAA
panel (Arrow et al. 1993). With the help of a hypothetical market, respondents
expressed their WTP to improve quality of the coastal zone for recreational use.
The structure of the hypothetical market included three elements: (1) A brief
description of the measures that should be taken to improve the quality of coastal zone
for recreational use, within a hypothetical protection program to avoid ecosystem
degradation (loss of recreational goods and services provided by the coastal area);
(2) the vehicle and payment conditions (frequency of payment); (3) the WTP question
which was a dichotomous choice. Before the WTP question respondents were asked
8
improvement, which would be taken by the state. Participation in this program will
cost them a specified amount of money (in €) in a one-time payment.
In the subsequent stage, WTP was obtained only from people who had
responded positively in the first question. Now respondents were asked if they were
willing to pay a particular quantity of money to verify their involvement. The amounts
proposed were randomly fluctuated within the sample of respondents and ranged from
1 to 55 € (with €5 step). The bid step amounts were specified with the help of other
research which was carried out by the authors in the area and was tried to investigate
people’s WTP for incorporation of certain costs in “Blue Flags” program (Halkos &
Matsiori 2012). Knowing this information, respondents were asked if they would
choose “yes” or “no” to endorse this effort. Follow-up questions were asked to
establish causes for respondents' answer. As protest responses were taken these
declining some features of the hypothetical CVM scenario. Then, for those not agreed
to participate in the above program by paying a sum of money, the questionnaire
included questions which were designed to investigate the reasons for this behavior.
Follow-up questions tried to figure reasons for respondents' answers.
Respondents who choose not to pay the proposed amount were asked if they were
willing to pay another amount. Similarly respondents who gave us an idea about a
value were asked to rate several reasons associated with tourism development and
protection of coastal zone and marine biodiversity.
Respondents’ environmental attitude was measured with the help of NEP
scale. NEP scale is an improved version of an older scale used to investigate people’s
ecological attitudes (Dunlap & Van Liere 1978). NEP scale was designed by Dunlap
et al. (2000) and attempts to explore people’s attitudes and perceptions with the help
9
limits to growth”, “Antianthropocentrism”, “Fragility of nature’s balance”, “Rejection
of exceptionalism”, and “Possibility of an ecocrisis”.
4. Empirical results
4.1. Sample socioeconomic and ecological profile
Table 1 illustrates the descriptive statistics of respondents’ socioeconomic
characteristics.3 Means percentage distributions for NEP responses in the survey is
[image:10.595.88.513.332.527.2]shown in Table 2.
Table 1: Descriptive statistics of respondents’ basic socioeconomic characteristics
Number of
observations Mean/Percentage Deviation Standard
Gender (%) 400 52.0 % (Female) -
Age (years) 400 39.923 15.76
Education level (years) 400 13.60 2.43
Mean monthly income (€) 363 885.53 654.861
Employment (%) Private sector Public sector
Housework Students Unemployed Retired
400
33.8 15.2 3.0 17.7 16.4 12.9
Marital Status 400 49.0% (Single) -
3 The sample characteristics are representative of Volos’ city population as they are similar to the
10
Table 2: Mean percentage distributions and item–total correlations for New Ecological Paradigm (NEP) scale items*
*STA, strongly agree; SWA, somewhat agree; U, unsure; SWD, somewhat disagree; STD, strongly disagree; ri–t, item–total correlation. Percentages may not sum to 100 due to rounding.
Responses (%) NEP
scale Scale items STD SWD U SWA STA Mean Mean SD ri-t
We are approaching the limit of the number of people the earth can
support 10.7 15.9 31.6 24.4 17.4 3.2 1.2 0.191
The earth has plenty of natural resources if we just learn how to
develop them 6.7 6.0 12.4 21.9 53.0 4.1 1.2 0.228
R ea lit y of li m its to gr ow th
The earth has only limited room
and resources 19.2 20.6 27.6 18.2 14.4
10.18
2.9 1.3 0.159
Humans have a right to modify the natural environment to suit their
needs 22.4 26.4 30.3 11.7 9.2 2.6 1.,2 0.068
Humans were meant to rule over
the rest of nature 43.8 16.7 21.1 10.0 8.5 2.2 1.3 -0.012
A nt ia nt hr o-poc ent ris m
Plants and animals do not have
equal rights as humans to exist 4.5 7.0 16.4 19.2 53.0
8.91
4.1 1.2 0.269
When humans interfere with nature, it often produces disastrous
consequences 5.0 10.0 15.4 23.6 46.0 3.9 1.2 0.357
The balance of nature is strong enough to cope with the impacts of
modern industrial development 26.4 27.9 25.1 12.4 8.2 2.5 1.2 0.049
Fr agi lit y of na tur e’ s ba la nc e
The balance of nature is very
delicate and easily upset 6.2 9.7 21.4 29.1 33.6
10.18
3.7 1.2 0.321
Human intelligence will ensure that
we don’t make the earth unlivable 13.9 14.4 38.1 20.1 13.4 3.1 1.2 0.064
Despite our special abilities, humans are still subject to the laws
of nature 5.0 9.0 22.9 23.6 39.6 3.9 1.2 0.261
R ej ec tion of e xc ept iona -lis m
Humans will eventually learn enough about how nature works to
be able to control it 17.4 19.9 36.3 14.4 11.9
9.72
2.8 1.2 0.201
Humans are severely abusing the
environment 4.7 6.5 15.2 27.9 45.8 4.0 1.1 0.331
Human destruction of the environment has been greatly
exaggerated 30.6 21.6 23.9 14.9 9.0 2.5 1.3 -0.031
Pos si bi lit y of a n ec oc ris is
If things continue going as they presently are, we will soon experience a major ecological
disaster
5.0 10.7 22.4 26.9 35.1
11.64
[image:11.595.38.561.93.727.2]11
4.2 Economic value of Pagasitikos gulf coastal zone
As the existing literature suggests that people perception and preferences
influence their decision to pay for natural environment, in our research, we study
people’s perceptions of quality and of the importance of different coastal zone
aspects. Respondents have to specify the importance of seven attributes (Cronbach's
Alpha = 0.760) of the coastal zone (as recreation destination). Results are given in
[image:12.595.136.442.277.414.2]Table 3 with just 56% being interested in recreation facilities.
Table 3: Most important beach and management issues for Coastal zone YES (%) NO (%)
Seawater quality 95 5 Beaches' cleanliness 95 5 Information substructure 81.8 18.2
Security substructure 79.6 20.4 Seawater activities 76.6 23.4 Coexistence with fishers 78.6 21.4 Recreation facilities 56.2 43.8
Also trying to verify the utility that respondents assign to Pagasitikos gulf
coastal zone, all participants were presented with seven statements (Cronbach's Alpha
= 0.909) reflecting the main dimensions of coastal zone utility (identified through
previous research of the authors in the area; Halkos and Matsiori 2012). The question
was used to explore the motives behind the response to CVM scenario. The results
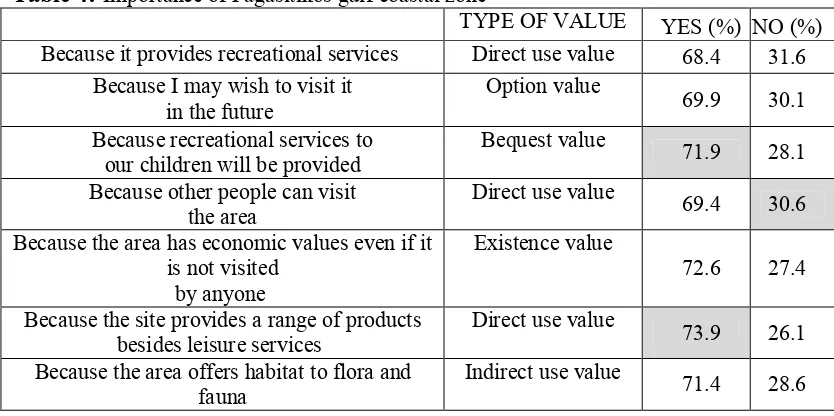
distribution in Table 4 are not clear with the bequest motive closely equal to existence
motives and with direct use motives also very close.
As mentioned a CVM was applied to explore people’s motives for the
economic value of coastal zone with a dichotomous choice asking people for their
WTP for a change in coastal zone quality. With a dichotomous WTP dependent
12
Table 4: Importance of Pagasitikos gulf coastal zone
TYPE OF VALUE YES (%) NO (%)
Because it provides recreational services Direct use value 68.4 31.6
Because I may wish to visit it
in the future Option value 69.9 30.1
Because recreational services to
our children will be provided Bequest value 71.9 28.1
Because other people can visit
the area Direct use value 69.4 30.6
Because the area has economic values even if it is not visited
by anyone
Existence value
72.6 27.4
Because the site provides a range of products
besides leisure services Direct use value 73.9 26.1
Because the area offers habitat to flora and
fauna Indirect use value 71.4 28.6
The results of the fitted model are presented in Table 5. According to the
obtained empirical results, the bid amount (BID) was negative and significant to
people’s intention to pay. On the contrary, income, education and perception of
people for coastal zone were all significant with positive relation to people’s response
[image:13.595.109.484.442.732.2]to CVM scenario.
Table 5: Econometric results of the proposed logit model formulations
Variables Estimates Odds Ratios
Constant term -3.567
[0.000] 0.028
BID -0.041
[0.000] 0.960 Education
(in years) [0.003] 0.148 1.159 Income 0.001
[0.003] 1.001 Reason to pay
(Future recreational use) [0.000] 1.124 3.078 Importance
(Coastal cleanliness) [0.006] 0.896 2.449 Nagelkerke R2 0.243
LR 71.867
[0.000] Hosmer-
Lemeshow [0. 339] 9,044
13
The mean WTP was calculated approximately equal to €23.06 per person by
assuming no negative values for environmental protection using the formula
suggested by Hanemann (1989):
4.3 Exploring motives behind respondent’s intention to pay
For having more information about the profile of people willing to pay for
coastal zone protection a combination of applied methodological research techniques
like Principal Components and Cluster Analyses was used. Respondents with a
positive WTP were asked to allocate their WTP (expressed to 100%) among five
different motives or reasons for their choice. The five reasons were associated with
the criteria of Blue Flag prize (Table 6).
Next respondents were asked to specify the motives behind their WTP with
the help of a modified version of a question used in Halkos and Matsiori (2012). This
question tries to better understand the importance of coastal zone to people well-being
and rely on: i) four criteria for awarding a beach with a blue flag award (Halkos and
Matsiori 2012), and ii) the classification of Coastal and Marine Ecosystem Services
from Potts et al. (2014). Only respondents who answered yes to CVM scenario were
asked to indicate on a five-point Likert scale for each topic (Babbie 1989) their
opinion for the importance of 27 reasons for saying yes to the CVM scenario and put
an economic value on the coastal zone.
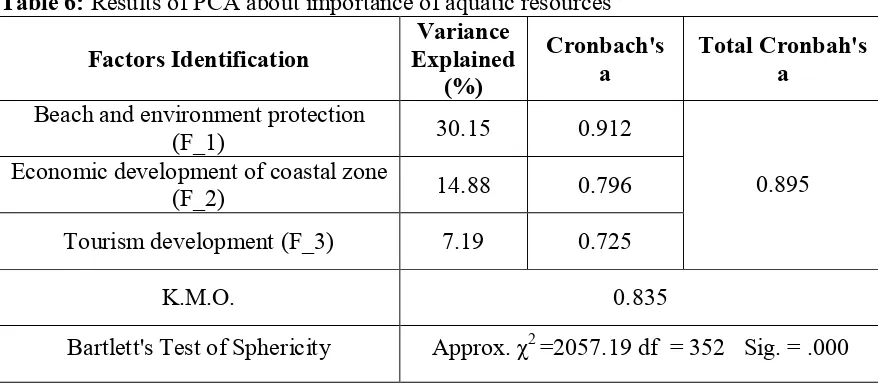
Reliability analysis of the question revealed that Cronbach-a was 0.895 (Table
6). The PCA has extracted three factors explaining 52.22% of the fluctuation of the
total variance and Cronbach-a of each factor was 0.912, 0.796 and 0.725 respectively
14
0.835 and Bartlett’s test of sphericity was equal to 2057.191 (with a P-value of 0.000
[image:15.595.90.529.133.327.2]and 325 degrees of freedom).
Table 6: Results of PCA about importance of aquatic resources
Factors Identification Explained Variance (%)
Cronbach's
a Total Cronbah's a
Beach and environment protection
(F_1) 30.15 0.912
Economic development of coastal zone
(F_2) 14.88 0.796
Tourism development (F_3) 7.19 0.725
0.895
K.M.O. 0.835
Bartlett's Test of Sphericity Approx. χ2 =2057.19 df = 352 Sig. = .000
The correlations among the factors are significant with the high correlations
between the extracted factors and the total factor (FTOT) showing that there are no
grounds for future separation of some items from the factors that interpret the reasons
for the economic value of coastal zones. Moreover, the high correlation between the
first and third factors shows that people are interested in both recreation developments
of the area and also for future management of coastal zone (Table 7).4
Next a cluster analysis was applied using the results of PCA for the sample
segmentation according to their perceptions for managing coastal zones. K-Means and
Hierarchical cluster analyses were used to having a better solution for the research
data. The hierarchical cluster was first used to identify the number of the cluster to
sample, with Ward’s method showing the sample could be grouped into two clusters.
4 For details on determinants of the environment and economic development see Halkos (1992, 2011)
15
K-means Cluster Analysis for PCA results revealed two clusters that provide an
[image:16.595.75.525.159.405.2]acceptable distribution of cases across the clusters and the most interpretable solution.
Table 7: Correlations between PCA factors
Beach and environment
protection (F_1)
Economic development of coastal zone (F_2)
Tourism Development
(F_3)
Ftot
Beach and environment
protection (F_1) 1.000 .428
** .121 .883**
Economic development of
coastal zone (F_2)
.428** 1.000 .441** .717**
Tourism development
(F_3) .121 .441
** 1.000 .442**
Ftot .883** .717** .442** 1.000
** Correlation significant at the 0.01 level (2-tailed)
[image:16.595.139.451.455.705.2]16
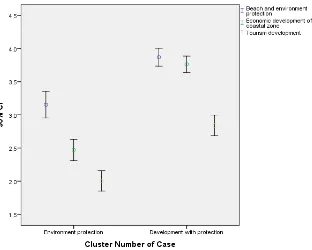
In the final solution, we used only variables that were significant and had the
ability to distinguish participants to different categories. The differences between the
two clusters were found with respect to beach and environment protection (U=1027.5,
z=-5.909, P=0.00], economic developmentof coastal zone [U=250.5, z=-9.24, P=0.00]
and tourism development mean scores [U=942.5, z=-6.270, P=0.00]. A 95%
confidence interval error bar verified the results of the Man Whitney U test that there
is a significant difference between the means for each group (Figure 1).
Mann-Whitney U statistics show differences among clusters (Table 8). All
[image:17.595.103.530.346.487.2]motives means were significantly different between clusters (Table 9).
Table 8: Motives Means for Clusters.
Cluster
Environment protection Development with protection
N 53 94
Beach and environment
protection (F_1) 3.15 3.87
Economic development of
coastal zone (F_2) 2.47 3.76
Tourism development (F_3) 2.00 2.84 Significant differences between cluster for pairs of motives means shown (P=0.00). No significant differences between means of F_1 and F_3 for 1st cluster (P=0.828)
and significance for 0,1 level for F_1 and F_2 for 2nd cluster (P=0.058)
Table 9: Comparison of factor scores for motives between clusters Cluster
N
Beach and environment
protection
Economic development of
coastal zone development Tourism Mean rank cluster 1:
Environment
protection 53 46.39 30.88 44.78 Mean rank cluster 2:
Development with protection
94
89.57 98.31 90.47
[image:17.595.75.515.572.752.2]17
A series of tests did not detect any significant differences comparing the two
clusters with the sample year (χ2=0.741, df =1, P=0.389), gender (χ2=1.034, df=1,
P=0.309), age (Mann-Whitney U=2096.0, P=0.111) and education measured in years
(Mann-Whitney U=2478.0 P=0.957), while income (Mann-Whitney U=2987.5,
P=0.00) and NEP SUM (Mann-Whitney U=2042.0, P=0.070) identified significant
differences. Mann-Whitney test was also used to explore the relationship between
clusters and people's WTP without detecting significant differences (Mann-Whitney
U=2096.5, P=0.109).
Figure 2 also shows that the two clusters have the same WTP (Mann-Whitney
Test=2096.5, P>0.05). Figure 2 shows that the two cluster have approximately the
same mean WTP (Mann-Whitney U=2096.5, P=0.109). Table 10 presents the results
of non-parametric tests between the mean WTP of the two clusters and respondents’
answers about how they allocate their WTP in some coastal zone issues representing
[image:18.595.131.467.459.707.2]the total economic value. Figure 3 compares percentage WTP between clusters.
18
5. Discussion
5.1. Ecological profile
According to the results the NEP scale possible minimum score was 23 and
maximum of 74, mean scores are 49.29 (+ 6.54) closer to earlier studies (McFarlane
et al. 2006, Halkos and Matsiori 2017). For Rideout et al. (2005), a NEP score above
45 shows a pre-ecological attitude. The mean score of the NEP scale was equal to
3.29, with a mean score equal to 3 representing people’s attitudes between
anthropocentric and eco-centric worldview (Rideout et al. 2005; Van Petegam and
[image:19.595.85.512.338.757.2]Blieck 2006).
Table 10: Percentage allocation of WTP
Null Hypothesis (% of WTP) Mean WTP (€) Sig. Decision
The distribution of "Quality of bathing water – WTP1" is the same across categories of cluster
Number of Case
33.5 7.91 .373 Retain the null hypothesis
The distribution of
"Environmental education and information – WTP2" is the same across categories of cluster
Number of Case
16.8 3.96 .690 Retain the null hypothesis
The distribution of "Safety, Lifeguarding first aid and services facilities – WTP3" is
the same across categories of cluster Number of Case
17.7 4.18 .000 Reject the null hypothesis
The distribution of "Environmental Management
– WTP4" is the same across categories of cluster Number of
Case
2.6 5.10 .180 Retain the null hypothesis
The distribution of "Recreation facilities – WTP5" is the same
across categories of cluster Number of Case
19
Figure 3: Percentage comparison of WTP between clusters
The mean sum of NEP scale of responses demonstrates a range of
environmental attitudes. While most respondents agree to the statement that plants
and animals have equal rights as humans to exist they insist that the earth has plenty
of natural resources if people learn how to develop them. The last column of Table 2
shows item–total correlations for each item and according to the results there are
correlations no reasonably strong. Cronbach’s a coefficient is equal to 0.508. A low
value of Cronbach’s a (lower than 0.7) indicates problems with inner consistency of
20
coefficient values closed to 0.6 can be accepted (Sekaran 2005; Hair et al. 2006;
Kaiser 1974). Even so, the low Cronbach’s a, as in previous studies in Greece, prove
the need to change the scale because it is probably not understood by people in our
country (Halkos and Matsiori 2017). In previous researches, the problem of the low
value of Cronbach’s a, has been attributed to the fact that concepts in the NEP
statements were new to respondents (Abdullah et al. 2014; Costello and Osborne
2005; Wu 2012).
Moreover, the prior conclusion is reinforced when looking at the last column
of Table 2. The negative values of item-total correlations mean that questions are
both unclear and may confuse respondents or even being mistaken questions. Very
low values of item-total correlation (between 0 and 0.19) may point out that the
question is not discriminated well. In the literature there is not an acceptable level for
item–total correlations with a value of 0.3 being acceptable (Aldrich et al. 2007; Clark
et al. 2003; Dunlap et al. 2000).
Mann – Whitney test shows no significant relationship among mean NEP
scale score and gender (U=21216.5 P=0.367), age (Spearman’s ρ: -0.690, P=0.166),
education (Spearman’s ρ: 0.082, P=0.101), income (Spearman’s ρ: 0.590, P =0.263)
people’s past pay for natural environment protection (U=2941.05, P=0.619).
Then according to Kotchen and Reiling (2000) the sample was categorized as
having weaker, moderate (NEP score between 46 and 59), or stronger (NEP scores
≥59) pre-environmental attitudes according to NEP results. The chi-square test shows
significant differences among NEP score groups (χ2= 5.15, P<0.05), showing that
environmental attitudes are related to people’s responses to CVM scenario. The
proposed causal relationship between NEP scale and conservation-related WTP
21
2000; Halkos and Matsiori 2017). In contrast, Cooper et al. (2004) using an
open-ended contingent valuation question open-ended that there is no significant relationship
between NEP scores and contingent values of water quality improvements supporting
that the water quality improvement for water resources (like a lake) is associated with
potential use values which conflict the existence-value orientation of scale and here
might lose its association with contingent values.
Finally, a series of tests to compare the NEP score groups with age
(Kruskal-Wallis W=1.905, P=0.386), gender (χ2=0.856, P=0.652), education measured in years
(Kruskal-Wallis W=4.659, P=0.097) and income (Kruskal-Wallis W=7.642, P=0.022)
detect significant differences only with income and (marginally) with education.
According to other studies socio-demographic indicators have no (or limited) relation
with people’s environmental concern (Gooch 1995; Van Liere and Dunlap 1980).
However, there are other studies that suggest that demographic characteristics (as
gender or area of living) can used to explain people’σ environmental concern (Casey
and Scott 2006; Rauwald and Moore 2002).
5.2. Economic value of Pagasitikos gulf coastal zone
Perceptions of stakeholders about recreational use of the coastal zone were
considered as essential because many times local people suffer from governmental
decisions and their observations and experiences of coastal management are important
for evaluation and improvement of environmental management programs. The
construction of the perception questions was based on specific issues affecting coastal
zone management. Respondents' answers reflect their awareness about coastal
attributes. These attributes included the cleanliness of beaches, the quality of
22
cleanliness were classified (Table 3) as important at previous researchers (Schuhmann
2010). Close related is the need for information substructure while on the contrary
recreational facilities seem not so important to respondents.
Α question was used to explore the motives behind the response to CVM
scenario. Table 4 shows that current and future use of coastal zone and both with
non-use values estimated in our study are is line with other studies (Gunawardena and
Rowan 2005; Yang et al. 2008; Becker et al. 2012; O’Garra 2012; Subade and
Francisco 2014). Local communities are willing to pay more to ensure resources will
be available to future generations (bequest values) despite their poverty conditions
(Oleson et al. 2015). In a valuation study among residents of Quezon City for
conservation of reefs bequest concerns for future generations was the main reason for
people’s WTP (Subade and Francisco 2014). The non-use values influence more than
the use values people’s decision in valuation studies of endangered species (Tisdell
and Wilson 2004).
The results of our CVM analysis are expected. Bid amount (BID) was
negative and significant, thus higher BID values, resulted in lowering probabilities of
responding 'yes'. As it can be seen only education and income from the demographic
variables have statistically significant effect on the respondent's probability in
answering ‘yes’ or ‘no’ to the valuation question.
People with a higher education level have a higher tendency to prefer the
coastal zone improvement project (Dorsch 2014, Camacho-Valdez et al. 2013,
O’Garra 2012, Bell et al. 2003; Kriesel et al. 2004; Veisten et al. 2004; Ojeda et al.
2008; Eggert and Olsson 2009; Rolfe and Windle 2012, Halkos and Matsiori 2012).
Beharry and Scarpa 2010 (among others) claim that educational programs help with
23
comprehend the need for managing environmental resources better than others who
are not well-educated (Langford et al. 1998). On the other hand, Van Lier and Dunlap
(1980) point out that people’s education level is a predictor of environmental concern.
The strong positive connection between education and environmentalism is a finding
of other studies (Mohai and Twight, 1987).
Our empirical analysis proved the positive effect of income on respondents’
response to CVM scenario (Morrison and Bennett; 2000; Brander et al. 2006; Ojeda
et al. 2008; Peters and Hawkins 2009; Zander et al. 2010; Petrolia and Kim 2011;
Rolfe and Windle 2012; Camacho-Valdez et al. 2013). This positive influence of
income on people’s responses on CVM scenario is a proof that they take into
consideration their budget constraint (Mitchell and Carson 1989). According to
Schläpfer (2006) the measurement of income effects in a CVM research counts the
change in stated WTP due to a change in income although there is less proof that
income is a determinate factor of people WTP.
On the other hand, “coastal cleanliness” is one of the most significant
determinants of yes/no responses with “Future recreational use”. This coastal
cleanliness was a predictor variable of people responding to CVM scenario in various
studies (Sarraf et al. 2004; Schuhmann 2012). Shivlani et al. (2003) argue that the
beach quality (available space, cleanliness of beach and coastal water, and amenities
offered) is an influencing factor of individuals’ demand with cleanliness being again a
satisfactory reason for beach users (Mouat et al. 2010).
Finally, respondents are paying more when areas provide creative activities to
the future (Bockstael et al. 1987; Sarraf et al. 2004; Schuhmann 2012; Halkos and
24
pay for present recreational opportunities but are more interested for a future
recreational use of coastal zone.
The NEP scale of environmental attitudes (NEP) has not a significant
influence on peoples’ response to CVM scenario. Then trying to explore the
relationship between people's NEP scale scores and their responses to CVM scenario,
peoples’ score of NEP scale was insignificantly related to their correspondence to
CVM scenarios (χ2=5.515 df=2, P=0.063) with a mean WTP approximately equal to
€23.06 per person.
5.3 Exploring motives behind respondent’s intention to pay
First, respondents were asked what precedence of their WTP would like to go
to specific reasons. According to the results the main reason (33.5%) of total WTP is
given for improving the quality of bathing water and equals to 7.906 €.
Consistent with the results, people’s WTP was positively correlated with the
reason “environmental management” (Spearman’s ρ: 0.210, P < 0.05). On the contrary
“support of recreational activities” was negatively related with respondent’ WTP
(Spearman’s ρ: -0.1345, P < 0.05). No significant relation was revealed among other
reasons and people’s WTP, like environmental education, water quality for
recreational activities, and “safety facilities”. Individual choices of the reason for
which respondents selected to invest their WTP were used to identify the underlying
factors influencing WTP for coastal zone conservation.
A PCA analysis was used to identify the motives behind the economic values
of the area. The result of PCA was similar to the results of a previous application of
the question at Halkos and Matsiori (2012). The first factor was the most important,
explaining 30.147% of the total variation in the data and can be also called “beach and
25
ecosystem was the first prepossession of people who say yes to CVΜ. The item of the
greatest response from individuals was “conservation of marine ecosystem and fish
stocks”, while the “protection of coastal beaches” was the 3rd item loaded to the
factor. This item was 1st loaded to previous application of the question and this
differential may be due to the sample consistency. At Halkos and Matsiori (2012) the
sample was consisted only of recreational users of the area.
The factors partially representεδ the structure of values, related to ecosystem
services are in line with dimensions of sustainability: environmental (ecological),
economic and social (Cole et al 2015). Moreover they are in line with Cummings and
Harrison (1995) who claim that total value has two components: those of separable
motive-related values and use-related values.
The items of the first factor are non-economic motives related with existence
and direct uses values. The existence value originates from the value people assign
simply to existence of coastal zone ecosystems and usually is related to altruistic
motives (Hanley and Barbier 2009). We note that coastal zone should be protected not
only because it provides many goods and services but as it is also an important
ecosystem contributing to people's well-being. Previous studies prove that people
(residents and visitors) value highly the ecological features of coastal areas, as well as
their biodiversity (Torres and Hanley 2016).
Participants’ WTP was positively correlated with the first factor (Spearman’s
test: 0.184, P < 0.05) and there was a significant relation between NEP scale score and
the first factor (Kruskal–Wallis: 13.524, P < 0.05). According to Turpie et al. (2003)
while existence values of coastal resources are relative to terrestrial resources, people
26
The second factor which was identified by the participants in the research was
named “economic development of coastal zone” and was not related to a specific
category of natural environment total economic values. For people who said yes to
CVM scenario some dimensions of direct use values emerge. The third factor was
also related with direct use values of the coastal zone. Oh et al. (2008) state that
residents are interested in taking measures for developing coastal zones. The third
factor was called “tourism development” and was related to recreational services and
information facilities. According to Budowski (1976) trying to explore the
relationship among environmental impacts and tourism development point out that
they can conform together. The important economic benefits of tourism make society
to want further boosting the development of this sector (De Gobbi 2013).
Then we applied clustering analysis techniques to identify individuals’ groups
with respect to their motives for paying. Cluster Analysis allows researchers to group
together variables according to similarities in the profiles. The results of cluster
analysis do not revealed significant differences between mean WTP and clusters. On
the contrary, the different population segments may have been used to explain the
way people allocate their total WTP. While respondents give 33.5% of their WTP to
ensure quality of bathing water, significant difference was detected between clusters
and “Safety, Lifeguarding first aid and services facilities” and Recreation facilities. So
WTP of the second cluster (Development with protection) is higher for “Safety,
27
6. Conclusions and policy implications
Literature findings are mixed for the relationship between environmental
attitudes and environmental WTP. Cooper et al. (2004) suggest that nature of the
goods is the determinant factor for the relation, and when we refer to public goods
(with existence or intrinsic values) the attitude-WTP association is expected than in
the case of other goods with potential use values. In our study this relation is
investigated using attitudinal questions (including NEP scale) and socio-demographic
characteristics. Then we capture the motivations behind WTP for coastal water
quality, including individual's perceived importance of environmental protection.
The findings reveal the psychological, personal and demographic factors
affecting people’s intention to pay for coastal zone improvement. For this reason we
try to determine the factors influencing people’s response to a CVM scenario for
coastal zone improvement quantity. The results do not confirm the determinant role of
NEP scale to people’s probability to pay for the coastal zone. Moreover the low value
of reliability test is in line with previous applications of NEP scale to our country and
leads to the conclusion that NEP scale items are not understood. On the other hand
attitudes and motives towards the environment are important for understanding public
values for environmental goods such as coastal zone. More specifically demographic
information helps understanding people’s intention to pay. Finally, others attitudinal
data (about the future use of area) are important in people’s decision for paying.
Summarizing our findings, a great number of people were willing to pay for
improving quality of coastal zones. This is important and may help design of effective
environmental policies taking into account benefits and costs of proposed actions and
their alternatives. In addition the results confirm the suggestion for using attitudinal
28
understand coastal zone attributes and their uses. This information could contribute on
the success of environmental protection programs and public environmental education
policies. The incorporation of people preferences and needs to management plans
leads to more effective policies and allocation of budget process.
On the other hand, our study explores the links between general attitudes and
specific payment intentions. NEP scale has no influence to people decision for the
specific amount. People pay more when they want to improve water quality.
Our results segment population with intention to pay for the coastal zone
protection. According to the results, none of attitudinal data used had significant
relation to people’s intention to pay. On the contrary these variables had an influence
to general people behavior against coastal zone management. The results explain why
people place values on coastal zone and can help the decision makers to formulate
effective management programs according to people’s orientations.
Our experimental modification, which allows us to understand people’s
preferences expressed by the supporters of a water quality program, has greater
research implications for illustrating how attributes and coastal area uses affect
people’s intention to pay and allocate this amount in practice. Finally, our results
underline the need of various factors (anthropomorphic and anthropocentric) in
conjunction with WTP data for understanding how people take their decisions for
29
References
Abdullah K., Said A.M., Omar D., 2014. Community-based conservation in managing mangrove rehabilitation in Perak and Selangor. Procedia – Social and Behavioral Sciences,153, 121–131.
Ackerberg D.A., 2003. Advertising, learning, and consumer choice in experience good markets: an empirical examination. International Economic Review, 44(3), 1007–1040.
Aldrich GA., Grimsrud K.M., Thacher J.A., Kotchen M.J., 2007. Relating environmental attitudes and contingent values: how robust are methods for identifying preference heterogeneity? Environmental and Resource Economics, 37(4), 757-775.
Arrow K., Solow R., Portney P.R., Leamer E.E., Radner R., Schuman H. 1993. Report of the NOAA Panel on Contingent Valuation. Federal Register,58 (10), 4601-4614.
Babbie E., 1989. The Practice of Social Research, 5th ed. CA Wadsworth Publishing, Belmond.
Bartczak A. 2015. The role of social and environmental attitudes in non-market valuation. Forest Policy and Economics, 50, 357–365.
Becker N., Lavee D., Tavor T., 2012. Desalinate or divert? Coastal non-market values as a decision tool for an integrated water management policy: The case of the Jordan River basin. Ocean and Coastal Management,64, 27–36.
Beharry-Borg N., Hensher D.A., Scarpa R., 2009. An analytical framework for joint versus separate decisions by couples in choice experiments: the case of coastal water quality in Tobago. Environmental & ResourceEconomics43: 95–117 Beharry-Borg N., Scarpa R. 2010. Valuing quality changes in Caribbean coastal
waters for heterogeneous beach visitors. Ecological Economics, 69, 1124–1139. Bell K.P., Huppert D., Johnson R.L., 2003. Willingness-to-pay for local Coho Salmon
enhancement in coastal communities. Marine Resource Economics,18, 15–31. Ben-Akiva M., McFadden D., Garling T., Gopinath D., Walker J., Bolduc D.,
Borsch-Supan A., Delquie P., Larichev O., Morikawa T., Polydoropoulou A., Rao V., 1999. Extended framework for modeling choice behavior. Marketing Letters, 10, 187–203.
Bernath K., Roschewitz A. 2008. Recreational benefits of urban forests: explaining visitors' willingness to pay in the context of the theory of planned behavior. Journal of Environmental Management, 89, 155-166.
30
Blakemore F., Williams A. 2008. British tourists’ valuation of a Turkish beach using contingent valuation and travel cost methods. Journal of Coastal Research, 24(6), 1469-1480.
Bockstael N., Hanemann W., Kling C., 1987. Estimating the value of water quality improvements in a recreational demand framework. Water Resources Research,
23, 951–960.
Bockstael N.E., Hanemann M.W., Kling C.L., 1987. Estimating the Value of Water Quality Improvements in a Recreation Demand Framework. Water Resources Research, 23, 951-960.
Boxall P.C. Adamowicz W.L., 2002. Understanding Heterogeneous Preferences in Random Utility Models: a Latent Class Approach. Environmental and Resource Economics, 23, 421-446
Brander L., Florax R., Vermaat J., 2006. The empirics of wetland valuation: a comprehensive summary and a meta-analysis of the literature. Environmental Resource Economics, 33, 223–250.
Brody S., Zahran S., Vedlitz A., Grover H. 2008. Examining the Relationship between Physical Vulnerability and Public Perceptions of Global Climate Change in the United States, Environment and Behavior, 40, 72.
Brown T.C., Champ P.A., Bishop R.C., McCollum D.W., 1996. Which response format reveals the truth about donations to a public good? Land Economics, 72, 152–166.
Budowski G. 1976. Tourism and environmental conservation: conflict, coexistence or symbiosis, Environmental Conservation, 3(1), 27-31.
Camacho-Valdez V., Ruiz-Luna A., Ghermandi A., Nunes P., 2013. Valuation of ecosystem services provided by coastal wetlands in northwest Mexico. Ocean and Coastal Management, 78, 1-11.
Campos M., Velázquez A., Verdinelli G.B., Priego-Santander A.G., McCall M.K., & Boada M. 2012. Rural people's knowledge and perception of landscape: A case study from the Mexican Pacific Coast. Society & Natural Resources: An International Journal, 25, 759-774.
Casey Dr., Paul J., Scott K., 2006/ Environmental Concern and Behaviour in an Australian Sample within an Ecocentric – Anthropocentric Framework. Australian Journal of Psychology, 58(2), 57–67.
Castaño-Isaza J., Newball R., Roach B., Lau W.W.Y., 2015. Valuing beaches to develop payment for ecosystem services schemes in Colombia’s Sea flower marine protected area. Ecosystem Services, 11, 22–31.
Choi A.S., 2011. Implicit prices for longer temporary exhibitions in a heritage site and a test of preference heterogeneity: a segmentation-based approach. Tourism Management, 32, 511–519.
31
Clark C.F., Kotchen M.J., Moore M.R., 2003. Internal and external influences on pro– environmental behavior: Participation in a green electricity program. Journal of Environmental Psychology, 23, 237–246.
Cole Z., Holland S., Donohoe H., 2015. A Social Values Typology for Comprehensive Assessment of Coastal Zone Ecosystem Services. Society & Natural Resources, 28(12), 1290-1307.
Cook A., 2000. Estimation of Community Valves of Lakes: A Study of Lake Mokoan in Victoria, Australia": A Comment. Economic Analysis and Policy, 30(1), 99-102.
Cooper P., Poe G.L., Bateman I.J., 2004. The structure of motivation for contingent values: a case study of lake water quality improvement. Ecological Economics, 50(1–2), 69-82.
Costanza R., D'Arge R., De Groot R., Farber S., Grasso M., Hannon B., Limburg K., Naeem S., O'Neill R.V., Paruelo J., Raskin R.G., Sutton P. van den Belt M. 1997. The value of the world's ecosystem services and natural capital. Nature, 387, 253–260.
Costello A.B., Osborne J.W., 2005. Denpasar declaration on population and development. Practical Assessment. Research & Evaluation, 10, 1–9.
Cummings R.G., Harrison G.W., 1995. The Measurement and Decomposition of Nonuse Values: a Critical Review. Environmental and Resource Economics, 5, 225–247.
De Gobbi M.S. 2013. Public Policy Making in the Coastal Zone of the Venice Lagoon: Is There a Good Balance between Economic Development, the Social Dimension and Environmental Protection? Open Journal of Political Science,
3(4), 134-142.
Dietz T., Fitzgerald A., Shwom R. 2005. Environmental values. Annual Review of Environment and Resources, 30, 335–372.
Dorsch M.T., 2014. Economic Development and Determinants of Environmental Concern. Social Science Quarterly, 95, 960-977
Dunlap R.E., 2008. The new environmental paradigm scale: from marginality to worldwide use. The Journal of Environmental Education,40, 3–18.
Dunlap R.E., Van Liere K., Mertig A.G., Jones R.E. 2000. Measuring endorsement of the New Ecological Paradigm: A revised NEP scale. Journal of Social Issues,
56, 425-442.
Dunlap R.E., Van Liere K.D., 1978. The new environmental paradigm: a proposed measuring instrument and preliminary results. The Journal of Environmental Education, 9, 10–19.
32
Franco D., Luiselli L., 2014. Shared ecological knowledge and wetland values: A case study. Land Use Policy, 41, 526–532.
Gooch G.D., 1995. Environmental Beliefs and Attitudes in Sweden and the Baltic States. Environment and Behavior, 27(4), 513–539.
Gunawardena M., Rowan J.S., 2005. Economic valuation of a mangrove ecosystem threatened by shrimp aquaculture in Sri Lanka. Environmental Management, 36, 535–550.
Hair J.E., Anderson, R.E. Tatham, R.L., Black W.C., 2006. Multivariate Data Analysis. 5th Ed. Prentice Hall, Upper Saddle River.
Halkos G.E. 1992. Economic perspectives of the acid rain problem in Europe. University of York.
Halkos G.E., 2006, Econometrics: Theory and practice. Giourdas Publications.
Halkos G.E. 2007. Econometrics: Theory and Practice: Instructions in using Eviews, Minitab, SPSS and Excel. Gutenberg:Athens, Greece
Halkos G.E., 2011a, Nonparametric modelling of biodiversity: Determinants of threatened species, Journal of Policy Modeling, 33(4): 618-635.
Halkos G.E. 2011b. Environment and economic development: determinants of an EKC hypothesis. MPRA Paper 33262. University Library of Munich, Germany. Halkos G.E. and Jones N., 2012. Modeling the effect of social factors on improving
biodiversity protection, Ecological Economics, 78(C): 90-99.
Halkos G.E., Matsiori S., 2012. Determinants of Willingness to Pay for Coastal Zone Quality Improvement. Journal of Behavioral and Experimental Economics,
41(4), 391–399.
Halkos G.E., Matsiori S., 2016, Determining public attitudes and willingness-to-pay for artificial lakes protection. Water Resource Economics, 15, 15-27.
Halkos G.E., Matsiori S., 2017, Environmental attitude, motivations and values for marine biodiversity protection. Journal of Behavioral and Experimental Economics, 69,61-70.
Halkos G.E. and Skouloudis A. (2016). Cultural dimensions and corporate social responsibility: A cross-country analysis, MPRA Paper 69222, University Library of Munich, Germany.
Halkos G.E. and Tzeremes N.G. 2011. Public sector transparency and countries’ environmental performance: A nonparametric analysis. Resource and Energy Economics 38, 19-37.
Hanemann M., 1989. Information and the concept of option value. Journal of Environmental Economics and Management, 16, 23-37.
33
Hanley N., Bell D., Alvarez-Farizo B., 2003. Valuing the benefits of coastal water quality improvements using contingent and real behaviour. Environmental Resource Economics, 24, 273–285.
Hanley N., Craig S., 1991. Wilderness development decisions and the Krutilla–Fisher model: the case of Scotland's ‘flow country’. Ecological Economics, 4, 145–164. Hanley N., Hynes S., Patterson D., Jobstvogt N., 2015. Economic Valuation of
Marine and Coastal Ecosystems: Is it currently fit for purpose? Journal of Ocean and Coastal Economics, 2(1), 1–24.
Harris C.C., Driver B.L., McLaughlin W.J. 1989. Improving the contingent valuation method: a psychological perspective. Journal of Environmental Economics and Management, 17, 213- 229.
Hensher, D., Rose, J., Greene, W. 2005. Applied choice methods—A primer. Cambridge: Cambridge University Press.
Hess S., Beharry-Borg N., 2012. Accounting for Latent Attitudes in Willingness-to-Pay Studies: The Case of Coastal Water Quality Improvements in Tobago. Environmental and Resource Economics, 52, 109–131.
Hoyos D., Mariel P., Hess S. 2015. Incorporating environmental attitudes indiscrete choice models: An exploration of the utility of the awareness of consequences scale. The Science of the Total Environment, 505, 1100–1111.
Hynes S., Tinch D., Hanley N., 2014. Valuing Improvements to Coastal Waters using Choice Experiments: An Application to Revisions of the EU Bathing Waters Directive. Marine Policy, 40(1), 137–144.
Johnson C.Y., Bowker J.M., Cordell H.K. 2004. Ethnic variation in environmental belief and behavior: An examination of the new ecological paradigm in a social psychological context. Environment & Behavior, 36,157–186.
Jones N., Panagiotidou K., Spilanis I., Evangelinos K.I., Dimitrakopoulos P.G., 2011. Visitors’ perceptions on the management of an important nesting site for Loggerhead Sea turtle (Caretta caretta L.): The case of Rethymno coastal area in Greece. Ocean Coastal Management, 54, 577–584.
Jones N., Sophoulis, C.M. Malesios Ch., 2008. Economic valuation of coastal water quality and protest responses: a case study in Mitilini, Greece. Journal of Socio-Economy, 37, 2478–2491.
Kahneman D., Ritov I., Jacowitz K.E., Grant P., 1993. Stated willingness-to-pay for public goods: a psychological perspective. Psychological Science, 4, 310–315. Kaiser H., 1974. An index of factorial simplicity. Psychometrika,39, 31-36.
34
Kotchen M., Reiling S.D. 2000. Environmental attitudes, motivations, and contingent valuation of nonuse values: A case study involving endangered species. Ecological Economics, 31(1), 93–107.
Kriesel W., Keeler A., Landry C., 2004. Financing Beach Improvements: Comparing Two Approaches on the Georgia Coast. Coastal Management,32, 433–447. Landry C.E., Keeler A.G., Kriesel W., 2003. An economic valuation of beach erosion
management alternatives. Marine Resource Economics, 18, 105–127.
Langford I.H., Kontogianni A., Skourtos M.S., Georgiou S., Bateman I.J., 1998. Multivariate mixed models for openended contingent valuation data: willingness to pay for conservation of monk seals. Environmental Resource Economics, 12, 443–456.
LaRiviere J., Czajkowski M., Hanley N., Aanesen M., Falk-Petersen J., Tinch D., 2014. The value of familiarity: Effects of knowledge and objective signals on willingness to pay for a public good. Journal of Environmental Economics and Management, 68, 376–389.
Ledoux L., Turner R.K. 2002. Valuing ocean and coastal resources: a review of practical examples and issues for further action. Ocean and Coastal Management, 45, 583–616.
Louviere J. J., 2001. What if Consumer Experiments Impact Variances as well as Means? Response Variability as a Behavioral Phenomenon. Journal of Consumer Research, 28(3), 506–511.
Luisetti T., Turner R.K., Jickells T., Andrews J., Elliott M., Schaafsma M., Beaumont N., Malcolm S., Burdon D., Adams C., Watts W. 2014. Coastal zone ecosystem services: from science to values and decision making; a case study. Science of Total Environment, 493, 682-693.
McFadden, D. and K. Train (2000) Mixed MNL models of discrete response. Journal of Applied Econometrics,15(5), 447-470.
McFarlane B.L., Craig R., Stumpf-Allen G., Watson D.O., 2006. Public perceptions of natural disturbance in Canada’s national parks: The case of the mountain pine beetle (Dendroctonus ponderosae Hopkins). Biological Conservation,
130, 340 – 348.
McGonagle M.P., Swallow S.K., 2005. Open Space and Public Access: A Contingent Choice Application to Coastal Preservation. Land Economics, 81, 477–495. Meyerhoff J., 2006. Stated willingness to pay as hypothetical behaviour: can attitudes
tell us more? Journal of Environmental Planning and Management, 49, 209–226. Mitchell R.C., Carson R.T. 1989. Using Surveys to Value Public Goods: the
Contingent Valuation Method. Resources for the Future. Washington D.C., The Johns Hopkins University Press.
35
Morey E.R., Thacher J., Breffle W., 2006. Using angler characteristics and attitudinal data to identify environmental preference classes: a latent-class model. Environment and Resource Economics, 34, 91–115.
Morrison M., Bennett J., 2000. Choice Modelling, Non-Use Values and Benefit Transfer. Economic Analysis and Policy, 30(1), 13-32.
Mouat J., Lopez Lozano R., Bateson H., 2010. Economic impacts of marine litter. UK: Kommunenes Internasjonale Miljoorganisasjon (KIMO International). Available at: https://www.noordzeeloket.nl/images/Economic%20impacts%20 of%20marine%20litter_1290.pdf
Ndebelea T., Forgiec V. (2017). Estimating the economic benefits of a wetland restoration programme in New Zealand: A contingent valuation approach -Tom Economic Analysis and Policy, https://doi.org/10.1016/j.eap.2017.05.002. Nunes P.LD., Van Den Bergh J.C.J.M., 2004. Can people value protection against
invasive marine species? Evidence from a joint TC-CV survey in the Netherlands. Environmental. Resource Economics, 28, 517–532.
O’Garra T., 2012. Economic valuation of a traditional fishing ground on the coral coast in Fiji. Ocean and Coastal Management, 56, 44–55.
Oh C.O., Dixon A.W., Mjelde J.W., Draper J., 2008. Valuing visitors’ economic benefits of public beach access points. Ocean Coastal Management, 51, 847–853. Ojeda M.I., Mayer A.S., Solomon B.D., 2008. Economic valuation of environmental services sustained by water flows in the Yaqui River Delta. Ecological Economics, 65, 155–166.
Oleson K.L.L., Barnes M., Brander L.M., Oliver T.A., van Beek I., Zafindrasilivonona B., van Beukering P., 2015. Cultural bequest values for ecosystem service flows among indigenous fishers: A discrete choice experiment validated with mixed methods. Ecological Economics, 114, 104–116.
Organtzi, M., Mallios, Z., Latinopoulos, P., 2009. Double bounded contingent valuation of quality improvement in a coastal environment. In: In CEST2009, pp. A-1030–1037.
Östberg, K., Hasselström, L., Håkansson, C., 2012. Non-market valuation of the coastal environment - Uniting political aims, ecological and economic knowledge. Journal of Environmental Management, 110, 166-178.
Parsons G., Massey D.M., Tomasi T., 2000. Familiar and favorite sites in a random utility model of beach recreation. Marine Resource Economics, 14, 299–315. Peters H., Hawkins J.P., 2009. Access to marine parks: A comparative study in
willingness to pay. Ocean and Coastal Management, 52, 219–228.